


Written by:

Reviewed by:

- October 14, 2024
- 25 min read
Parabolic SAR Comprehensive Trading Guide
Deciphering when to enter or exit a trade is crucial. The Parabolic SAR is a technical indicator developed by J. Welles Wilder that plots points to signal when a trend may be about to reverse. Our guide will dissect its practical applications and settings adjustments, providing a clear path to optimise your trading strategy with this powerful tool.
Key Takeaways
- The Parabolic SAR is a trend following indicator that provides trade signals for entry and exit points all in one indicator.
- Effective in trending markets, but often yields false or late signals in sideways markets.
- Best used with other trend indicators such as moving averages to improve accuracy.
What is the Parabolic SAR Indicator
The Parabolic SAR (PSAR) is an indicator used by technical traders that lays on top of the chart’s price bars to aid traders in determining the direction of the trend and when the trend is considered to be reversing.
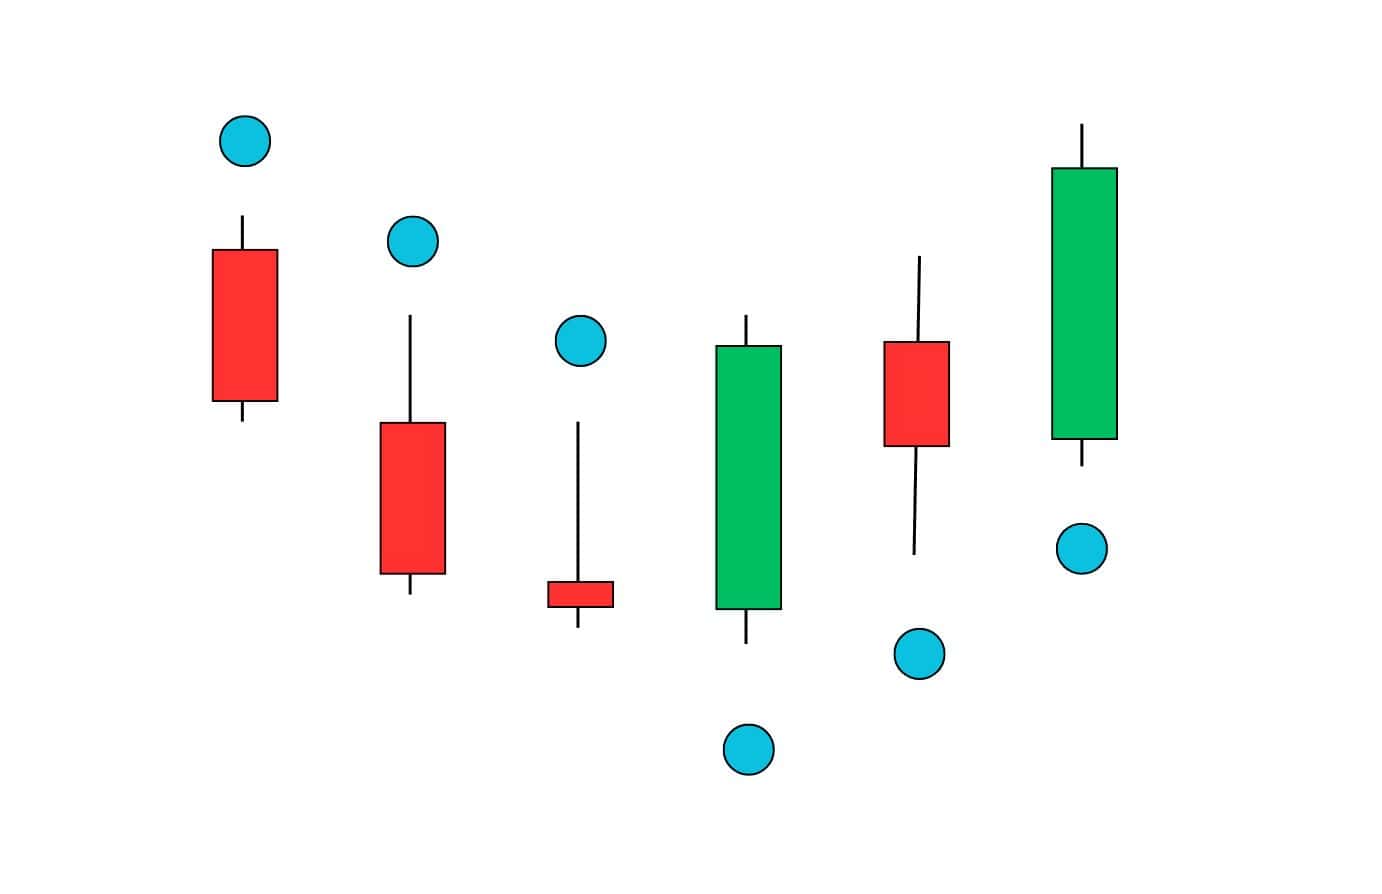
The Parabolic SAR indicator, also known as the ‘stop and reverse system’, was created by J. Welles Wilder. It is depicted as a series of dots that appear above or under the candlesticks on a price chart, which tell traders if the price is in an uptrend or downtrend. Traders tend to use these dots as their stop loss placement, or as a trailing stop loss.
The Parabolic SAR is an easy-to-use, yet complex in depth indicator. Its ability to generate frequent signals is both a strength and a weakness.
The key features of the Parabolic SAR are:
- Ability to identify trend directions
- Spot potential reversals
- Assess trend strength
- Provide traders an objective basis to time entries and place stops.
What Does the Parabolic SAR Indicator Tell You?
As a technical indicator, the Parabolic SAR tells traders when a trend is ending, and a new trend is forming. It operates by plotting parabolas (dots) above or below the current price, following the price from a distance.
Whenever the price breaks a parabola, it indicates a trend shift – the old trend is ending and a new trend is starting. This gives traders an entry and exit signal at the same time.
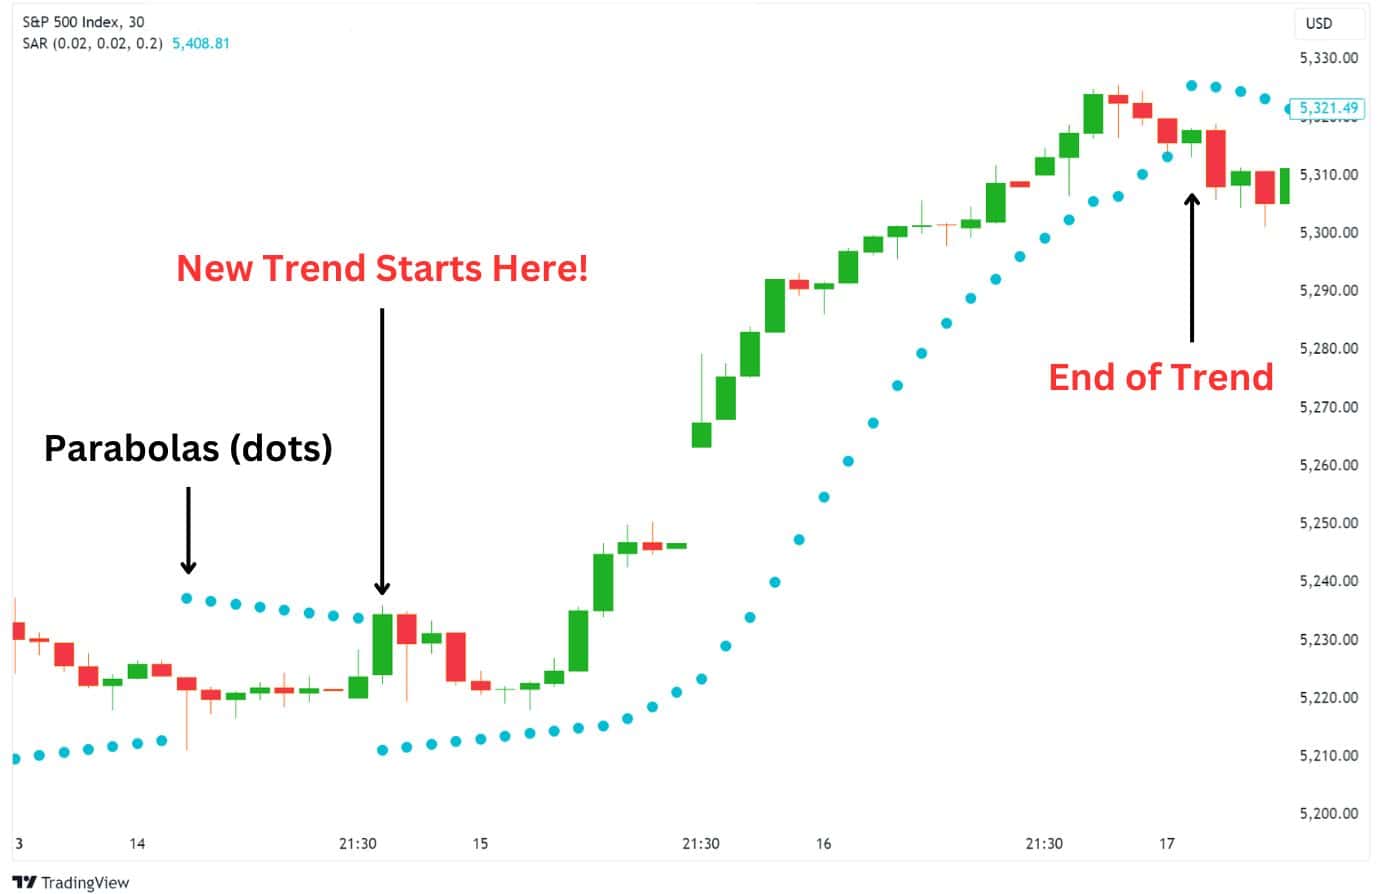
The direction of the parabolas matter too. When the dots are below the price, it indicates that price is in an uptrend. Conversely, when the dots above the price bars, it indicates a downward trend.
There are two main adjustable components to the parabolic SAR: Step Value and Maximum Step.
Adjusting the Step Value
This value adjusts the Parabolic SAR’s sensitivity to price changes.
Step value, also known as Increment or Acceleration Factor, starts at a default value of 0.02.
- A decrease in the step value will move the parabolas (dots) further away from the price.
- An increase in step value moves the parabolas closer.
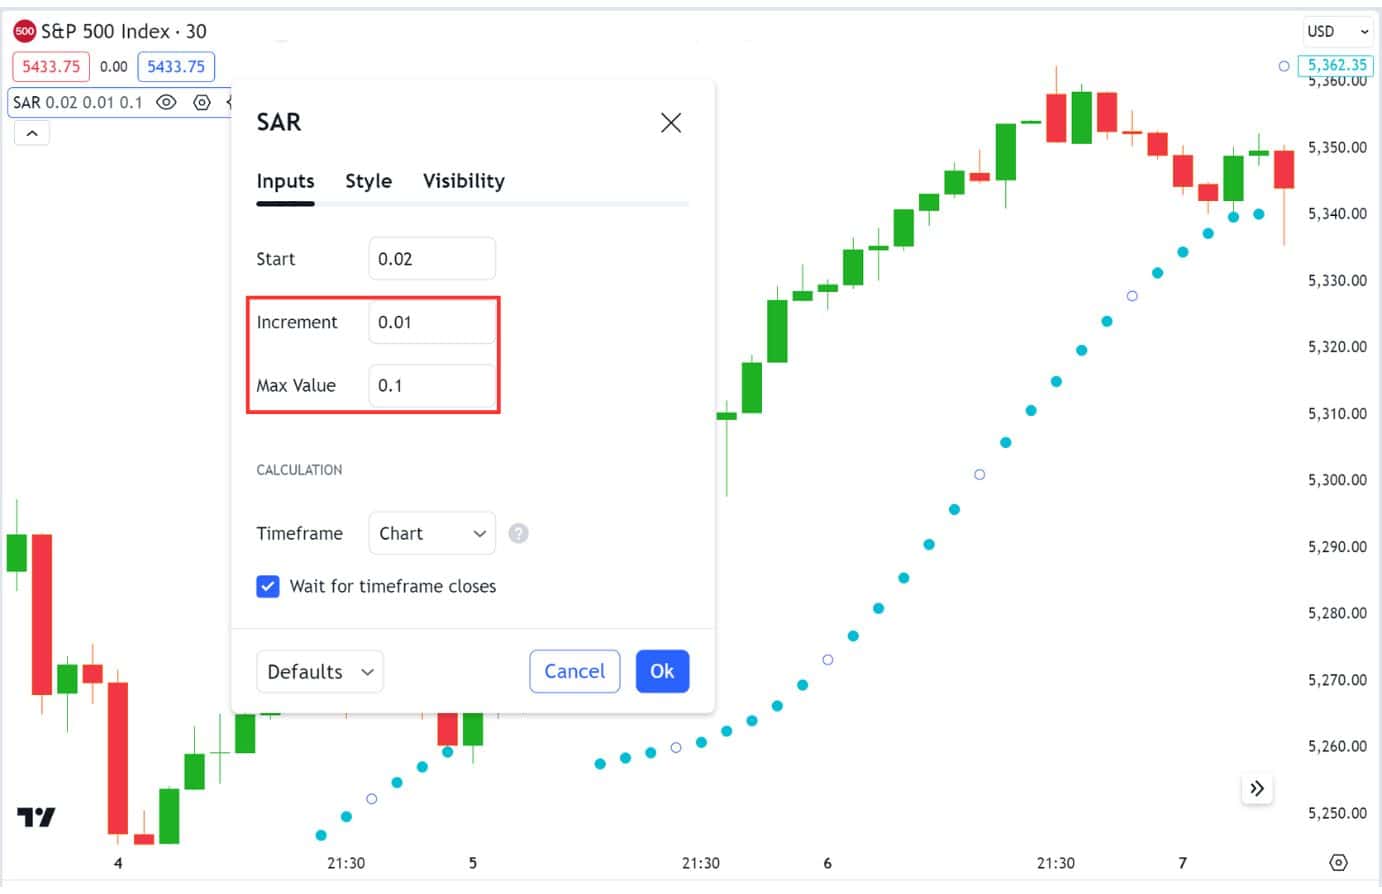
If the step value is too high, the Parabolic SAR may reverse too frequently, resulting in failure to capture a trend smoothly. This is why in most of our strategies we use an increment (step value) of 0.01.
Adjusting the Maximum Step
The Maximum Step, or max value in the Parabolic SAR controls the maximum acceleration factor.
In simple terms, it adjusts how responsive the indicator is to sudden price changes. A higher Maximum Step results in a more responsive Parabolic SAR.
This means that if price is drastically moving in one direction, a high maximum step will follow the price closer than if you had a slow maximum step, which reacts slower.
Importance of Parabolic SAR indicator
The Parabolic SAR’s primary use lies in gauging the short-term momentum of assets, guiding traders on where to position stop orders. It represents the presumption that a trader maintains a full investment in a position at all times, which is particularly relevant for those developing trading systems and traders looking for constant market engagement.
Traders often use the Parabolic SAR for the following purposes:
- For signalling the beginning of impactful trend reversals.
- For setting a trailing stop loss to follow the trend until the price retraces.
By adjusting the sensitivity of the PSAR, traders can change the frequency of signals, and thereby how long you can remain in a trend without a flip in the direction.
Adjusting the Acceleration Factor to Influence Sensitivity
The Acceleration Factor (AF) determines the rate at which the indicator moves in response to price changes – which directly affects the location of the parabolas (dots). The AF starts at a specified value (commonly 0.02) and can increase each time the trend extends, usually by 0.02.
By adjusting the AF, traders can control the sensitivity of the Parabolic SAR, making it more or less responsive to price changes depending on their trading strategy.
Most traders utilise the default settings of 0.02, 0.02, 0.2. For a less sensitive PSAR, traders will reduce those factors depending on the market conditions.
| Default Settings | 0.02, 0.02, 0.2 |
| Less Sensitive(Smoother Line) | 0.01, 0.01, 0.1 |
How to Calculate Parabolic SAR
To calculate the PSAR, we need to first understand a few terms:
| SAR Value: The lowest low in an uptrend, or the highest high in a downtrend. |
| Extreme Point (EP): The highest high in an uptrend, or the lowest low in a downtrend. |
| Acceleration Factor (AF): The acceleration factor is a multiplier that is applied to the difference between the EP and the SAR value, which gives the dots their distance from the price. |
Using these factors, we can calculate the Parabolic SAR (PSAR), or the dot’s location for each candlestick that appears on the price chart.
Parabolic SAR Formula
The formula for the PSAR differs based on the uptrend or downtrend.
An uptrend emerges when the price is consistently moving up, and only when the price breaks below the uptrend’s PSAR, a downtrend emerges.
| Uptrend PSAR: Prior SAR + Prior AF (Prior EP – Prior SAR) |
| Downtrend PSAR: Prior SAR – Prior AF (Prior SAR – Prior EP) |
Using these calculated values, dots are plotted on the chart, creating a trail of dots that traders can use as a trend filter, and trailing stop loss.
Parabolic SAR Example
Let’s see the parabolic SAR in action and learn how to interpret it.
Over here on this USOIL (WTI) 4H chart, we can see the Parabolic SAR indicator has plotted a series of blue dots all over the chart.
Notice how each candlestick has a blue dot either directly above or below it at a distance. The location of these dots informs us about the trend direction, and also acts as a trailing stop loss.
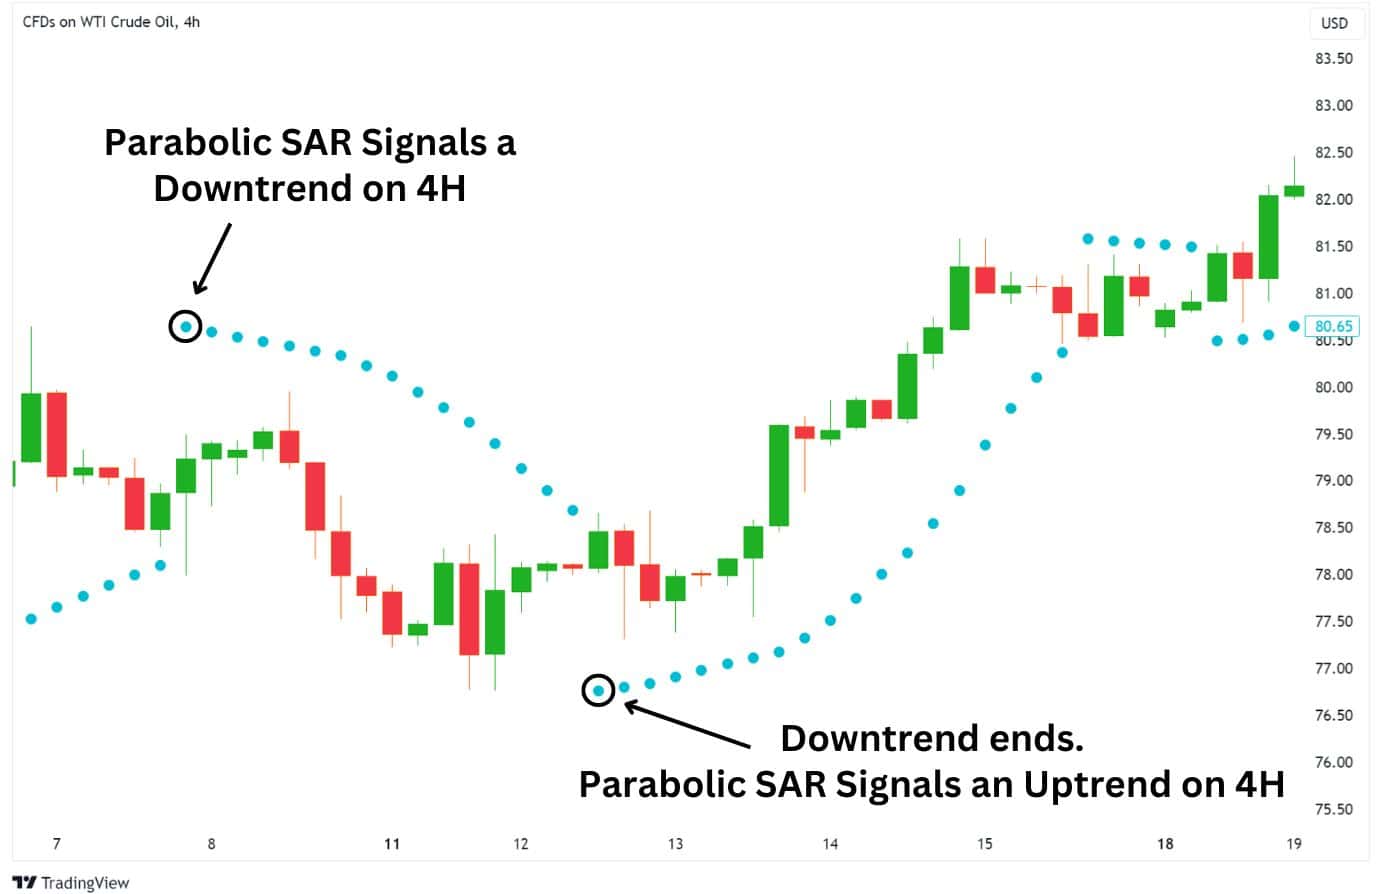
Downtrend: Due to the price being below the PSAR from March 7th to 12th, USOIL was in a 4H timeframe downtrend for this duration of time.
Uptrend: Similarly, because the price was above the PSAR from March 12th to 15th, USOIL was in a 4H timeframe uptrend for this duration of time.
It’s important to note that the PSAR does not identify sideways trends. Therefore, when the PSAR flips direction, it’s simply an indication of a trend ending, or the beginning of a potential reversal.
Parabolic SAR Trading Strategies

With high versatility, the Parabolic SAR can be integrated into various trading strategies. It can be effectively combined with other indicators to deliver high probability trading signals in trending markets. Some popular indicators to use in conjunction with the Parabolic SAR are:
- Moving averages
- Relative Strength Index (RSI)
- MACD (Moving Average Convergence Divergence)
- Bollinger Bands
It’s important, however, to understand that with indicator strategies that results will vary based on the asset and time frame that you’re trading on. Therefore, it’s highly recommended to backtest the strategy either manually, or with a script.
Be aware when using a script to backtest your strategy that errors are likely to occur, and that some errors may not be logged or result in a false positive.
With that being said, let’s hop into some trading strategies we’ve curated for you.
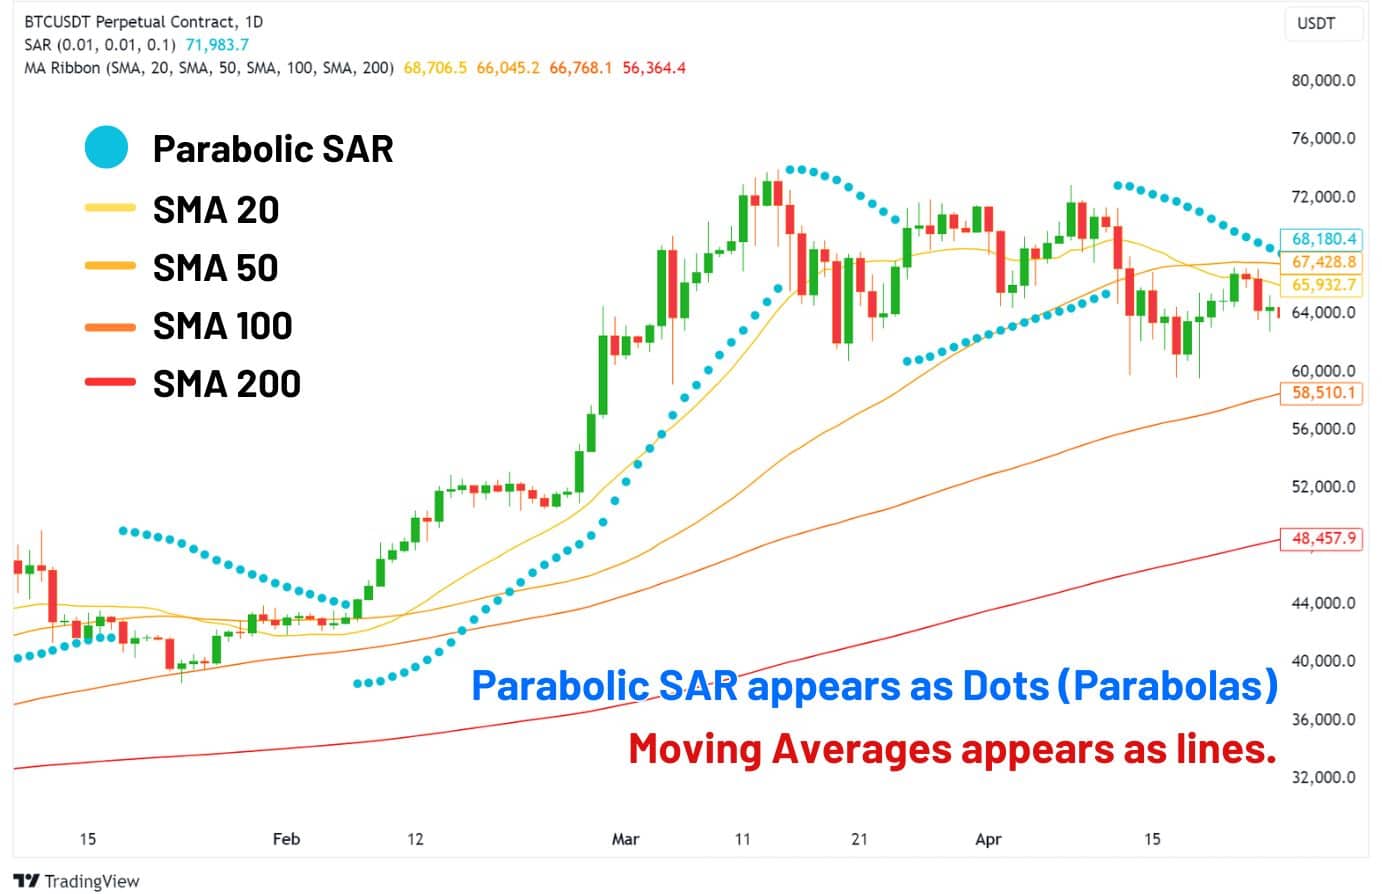
Trading Parabolic SAR with Moving Average
Pairing the Parabolic SAR with moving averages is a popular strategy that uses the moving average as a trend filter. Whenever the price is above a moving average, it’s considered to be in a bullish trend, and vice versa when it’s below the moving average.
One of the major weaknesses of the Parabolic SAR is the number of signals it can provide, causing a lot of noise in your analysis. With the moving average, traders can filter out which PSAR signals to take, allowing them to stay on the right side of the trend with more accuracy.
We suggest using either the exponential moving average 20, 50, 100, or 200, and a smoother SAR increment amount such as 0.01 to refine the number of signals you’ll get.
Finally, the PSAR will act as the trailing stop loss, triggering an exit whenever the direction is flipped.
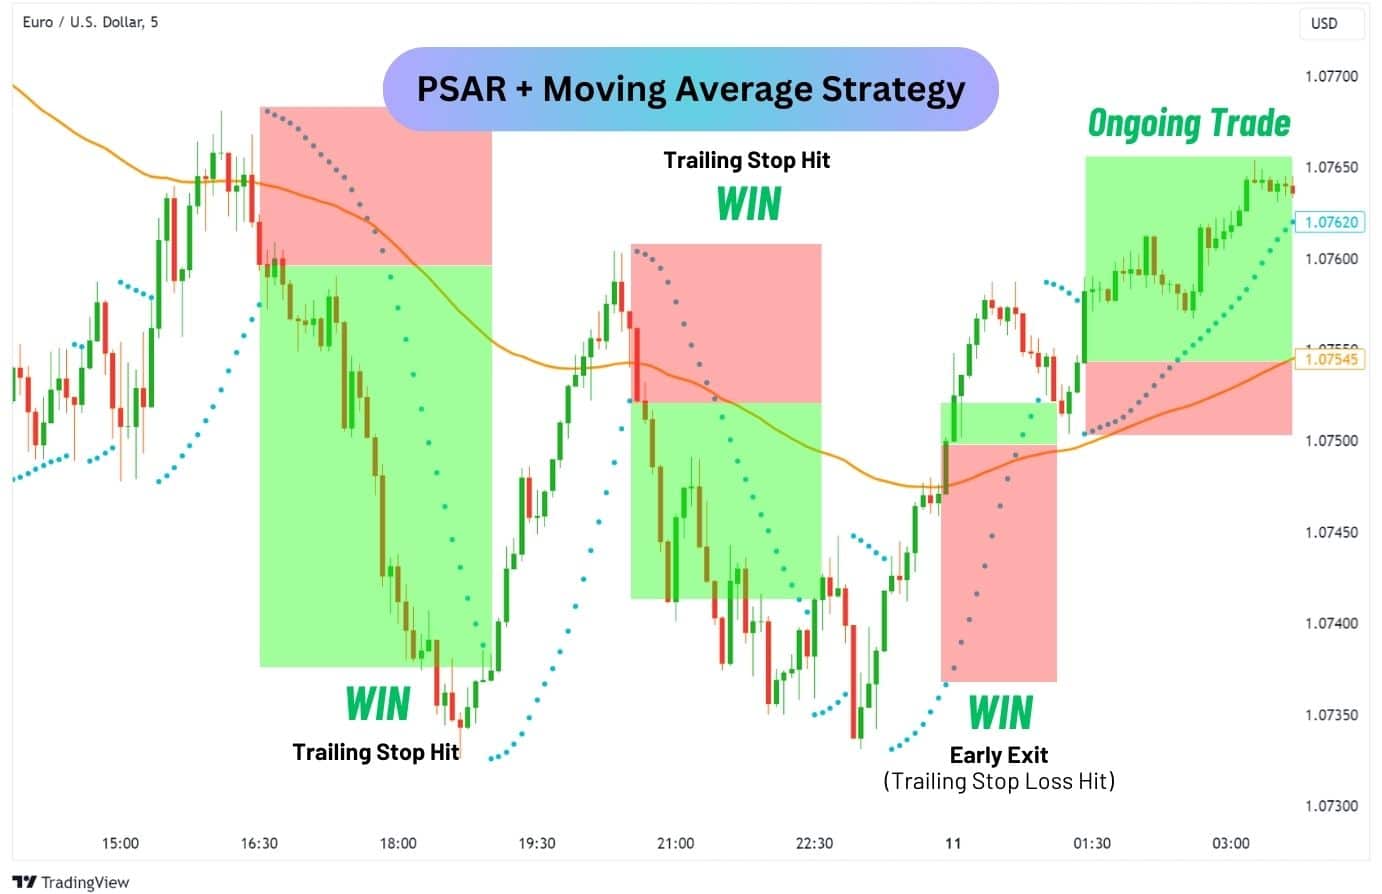
How it works:
- Whenever the price is above the moving average, look for long opportunities with the PSAR.
- Whenever the price is below the moving average, look for short opportunities with the PSAR.
- Exit your position when the PSAR trailing stop loss is hit.
The example above is Euro-Dollar on the 5 minute chart using PSAR settings 0.02, 0.01 (SAR Increment), and 0.2, with the 100-period exponential moving average acting as a trend filter.
Trading Parabolic SAR with ADX
Using the Average Directional Index (ADX), we can assess the strength of a move and predict its likelihood of continuing. This makes it a powerful companion to the Parabolic SAR, which can often signal weak trends that quickly reverse.
This strategy is simple. We will only take PSAR signals when the ADX indicates that momentum is above 25, and exit the trade when the PSAR flips against our trade’s direction.
We will also customise the PSAR to be less sensitive. This creates less flips with the PSAR, which leads to longer lasting trend lines and over time, helps us to capture bigger risk-to-reward trades.
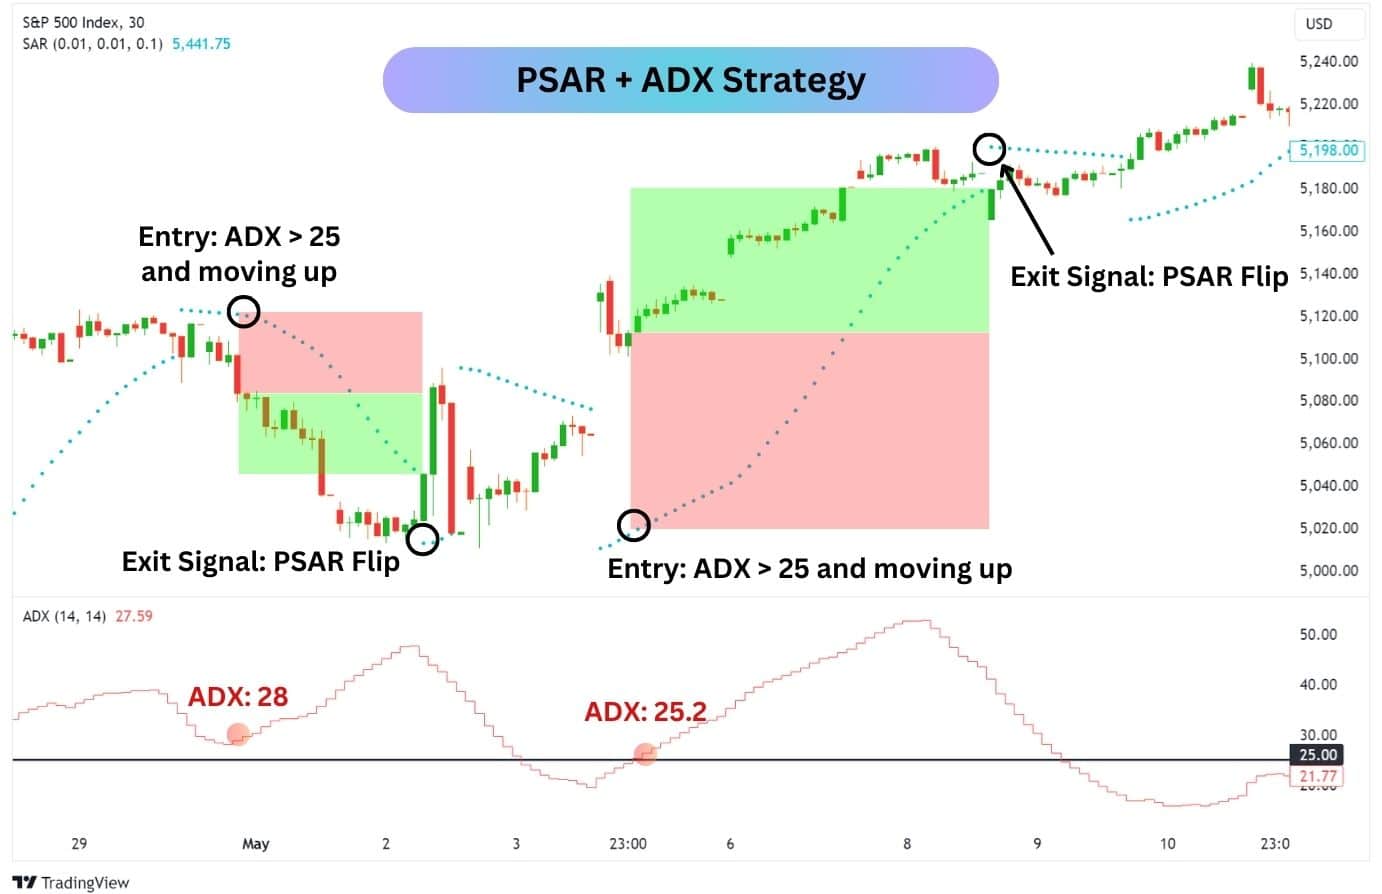
How it works:
- Enter a long position when the price is above the PSAR and the ADX is above 25.
- Enter a short position when the price is below the PSAR and the ADX is above 25.
- The ADX must be higher than its previous value, showing a tick up in momentum.
| Strategy Settings | |
| PSAR Settings | 0.01, 0.01, 0.01 |
| Take Profit / Stop Loss | When a single PSAR indicator flips direction |
Adjust the settings as needed to optimise for the traded asset and time frame.
Double Parabolic SAR Strategy
This strategy uses two Parabolic SAR indicators on different time frames to improve the accuracy of entry and exit points. The first PSAR should match the time frame of your chart, while the second PSAR should be set to double that time frame. For example, if you’re using a 15-minute chart, you should set one PSAR to 15 minutes and the other to 30 minutes.
By using two PSARs, you can filter out weak trending moves and only take trades that both indicators confirm. Additionally, applying an EMA as a trend filter helps you focus on trades that follow the overall trend, which can improve the consistency of your trades.
Both PSARs should be set to Start: 0.01, Step Value/Increment: 0.01, and Max: 0.1 for a smoother line.
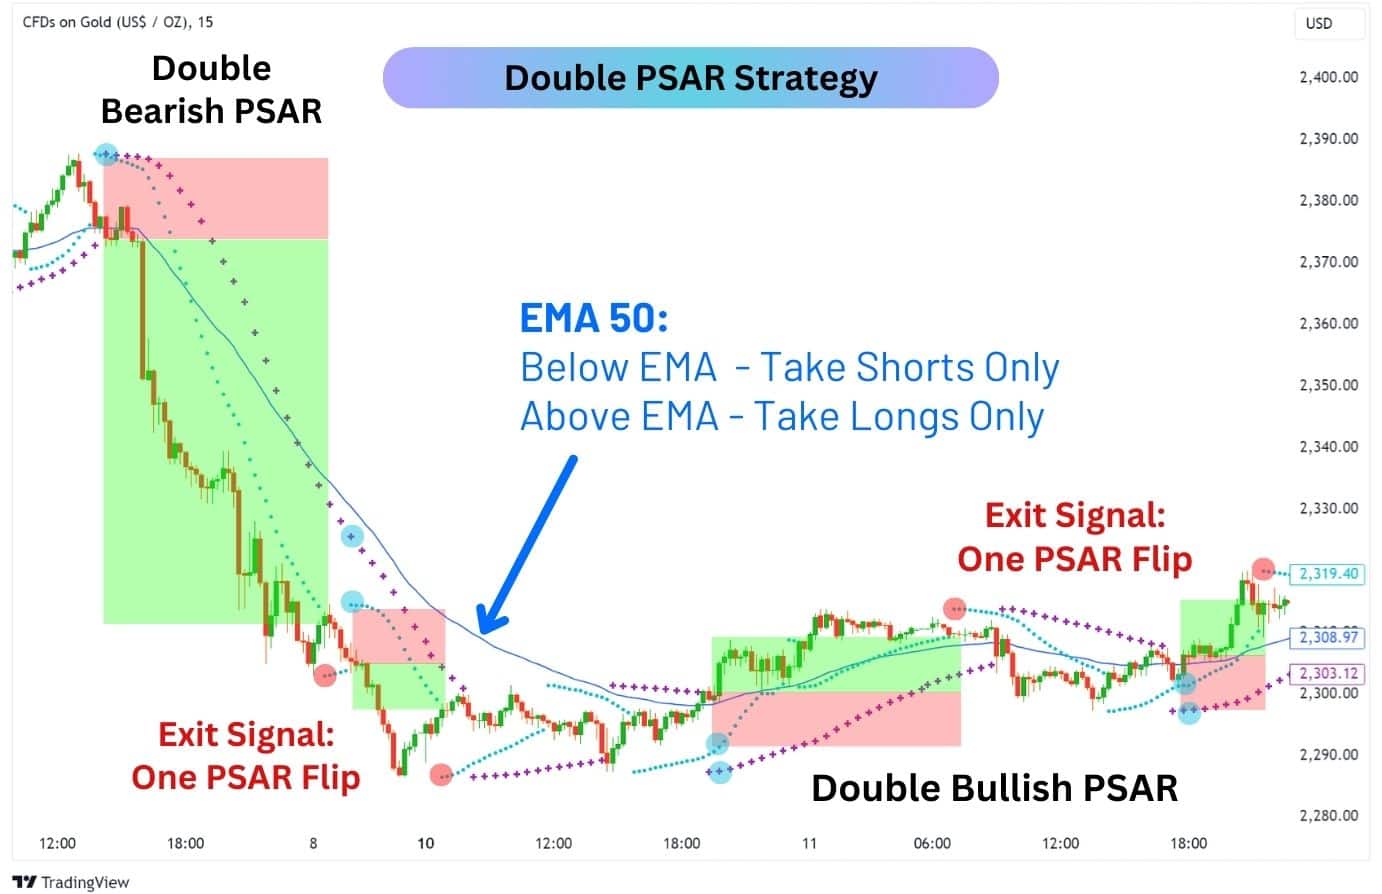
Here’s how it works:
- If price is above both PSARs and the EMA, take a long position.
- If price is below both PSARs and the EMA, take a short position.
- Exit your position if one of the PSARs flip directions.
| Strategy Settings | |
| EMA (Pick one) | 20, 50 (Recommended), 100, 200 |
| First PSAR | Based on your chart’s time frame |
| Second PSAR | Double your chart’s time frame |
| PSAR Settings | 0.01, 0.01, 0.1 |
| Take Profit / Stop Loss | When a single PSAR indicator flips direction |
EMA Crossover and Parabolic SAR Strategy
This strategy filters out the many false signals of an EMA crossover with the parabolic SAR. We will only trade an EMA crossover IF it occurs within the first 3 candles of an parabolic SAR flip (when the PSAR changes direction).
Next, we will use a less sensitive PSAR to provide a more effective exit signal than the EMA crossover, allowing us to truly capture the majority of a trending move.
Although this trend following strategy offers less signals, it is offset by effectiveness in lower timeframes such as the 15 minute and 5 minute chart.
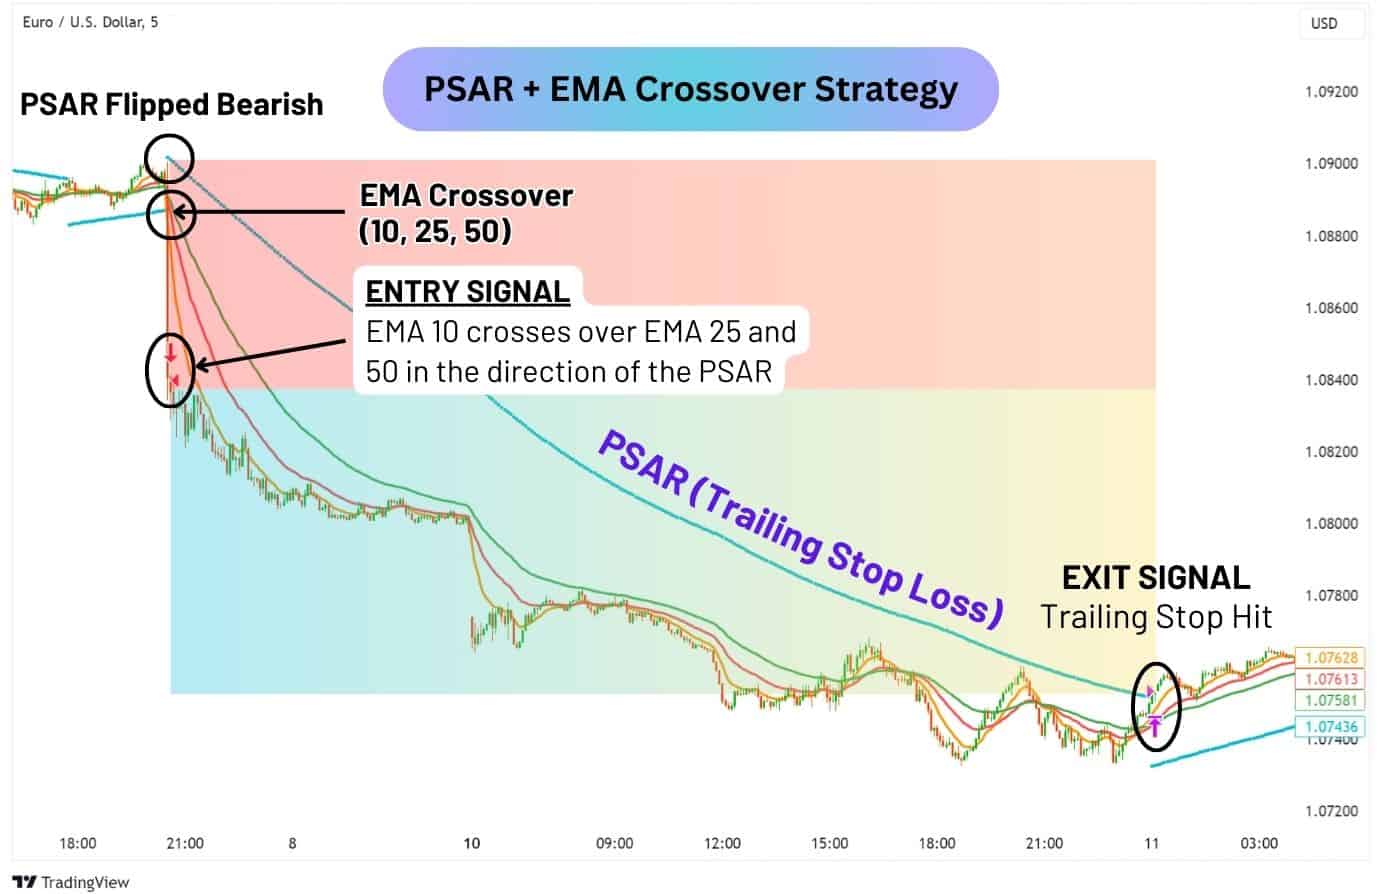
Here’s how it works:
- Go long when the price is above the PSAR, and EMA 10 crosses above EMA 25 and 50.
- Go short when the price is below the PSAR, and EMA 10 crosses below EMA 25 and 50.
- Exit the trade when the PSAR flips in direction.
| Strategy Settings | |
| Asset and Time frame | EURUSD, NZDUSD, GBPJPY 5 minute |
| EMA | 10, 25, 50 |
| PSAR Settings | 0.01, 0.01. 0.01 |
| Take Profit | Take profit when the PSAR changes directions |
| Stop Loss | Trailing stop loss based on PSAR |
This strategy seems to work for EURUSD, NZDUSD, and GBPJPY, but test it out and do your own research before committing live funds to the strategy.
Parabolic SAR and MACD Strategy on USDJPY 2H
When paired with the MACD indicator, the parabolic SAR can provide a filter for when you should take a trade using the MACD crossover. This strategy works best in trending environments, such as USDJPY and GBPJPY in 2023.
We created and tested a USDJPY 2H strategy with our Standard, Classic, Premier accounts’ trading conditions, which allows for zero commission trading on FX pairs.
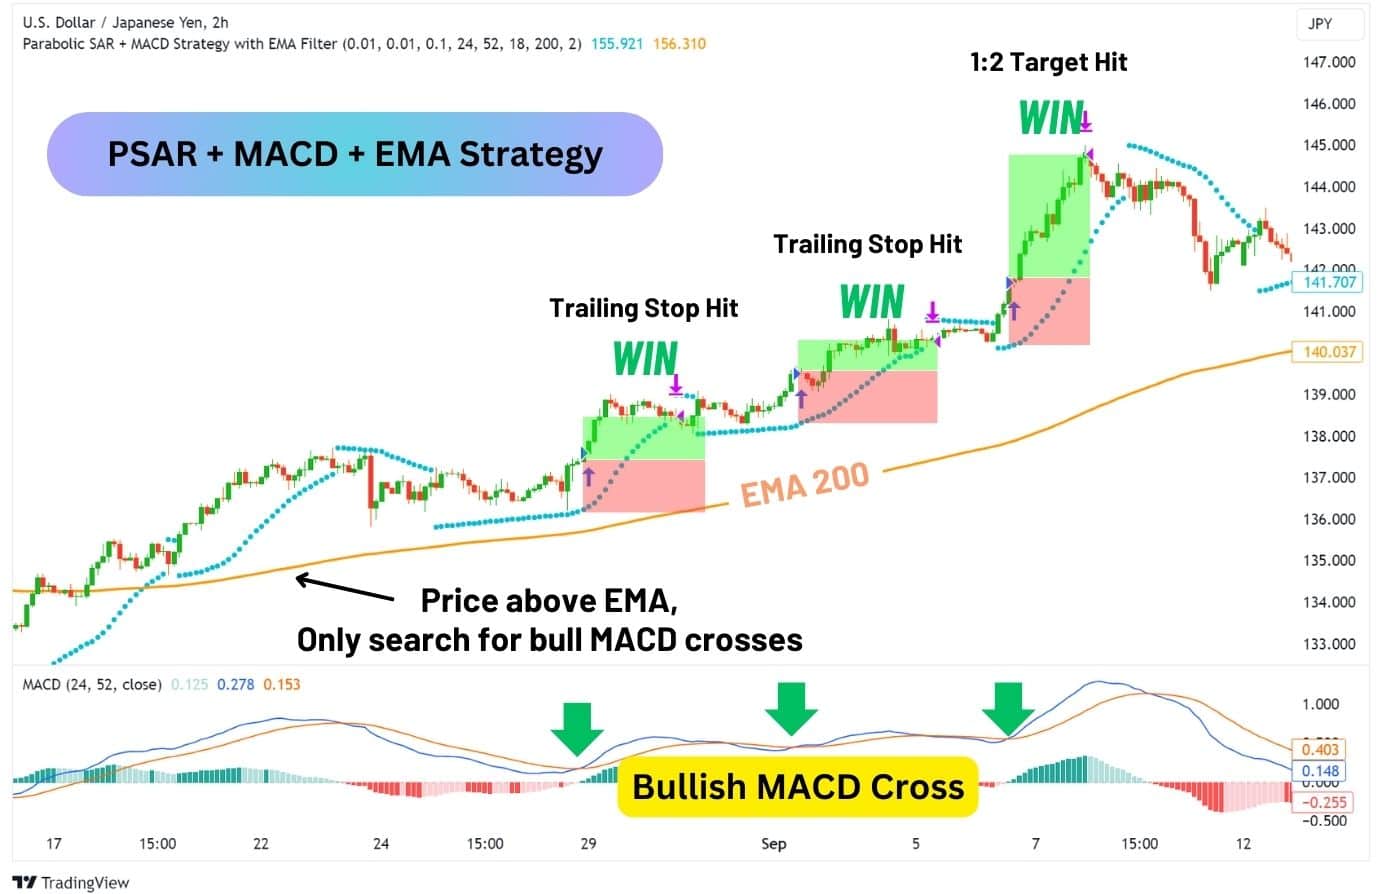
Here’s how it works:
- Go long when the price is above the PSAR and EMA 200, and a bullish MACD cross occurs.
- Go short when the price is below the PSAR and EMA 200, and a bearish MACD cross occurs.
| Strategy Settings | |
| Asset and Time frame | USDJPY 2H, GBPJPY 2H |
| MACD Settings | 24, 52, 18 |
| PSAR Settings | 0.01, 0.01. 0.1 |
| Take Profit | Take profit is set at 2 times your stop loss. |
| Stop Loss | At the PSAR at the time of entry.Or when the PSAR flips (protects your position). |
This strategy’s settings are customised to have a smoother parabolic trend, and also more refined MACD crossover signals. Do your own research and test the strategy out on a variety of markets and time frames before committing live funds.
Parabolic SAR Bollinger Bands Scalping Strategy on 1-Minute
Scalping is perfect for traders who want to get in and get out of the markets quickly. However, the challenge would be the process of filtering out false signals, especially when using an indicator on the lower time frames.
To combat the number of false signals, we will be combining the Bollinger Bands® with the Parabolic SAR on the 1-minute time frame for EURUSD.
Instead of relying on the SMA 20 to plot the Bollinger Bands, we will be using the EMA 200. We will also set the standard deviation of the Bollinger Bands to 1.
Next, the PSAR settings will be set to Start: 0.01, Increment (Step Value): 0.01, and Max: 0.2. This creates a smooth trailing stop loss that is quick to flip in the event of a reversal.
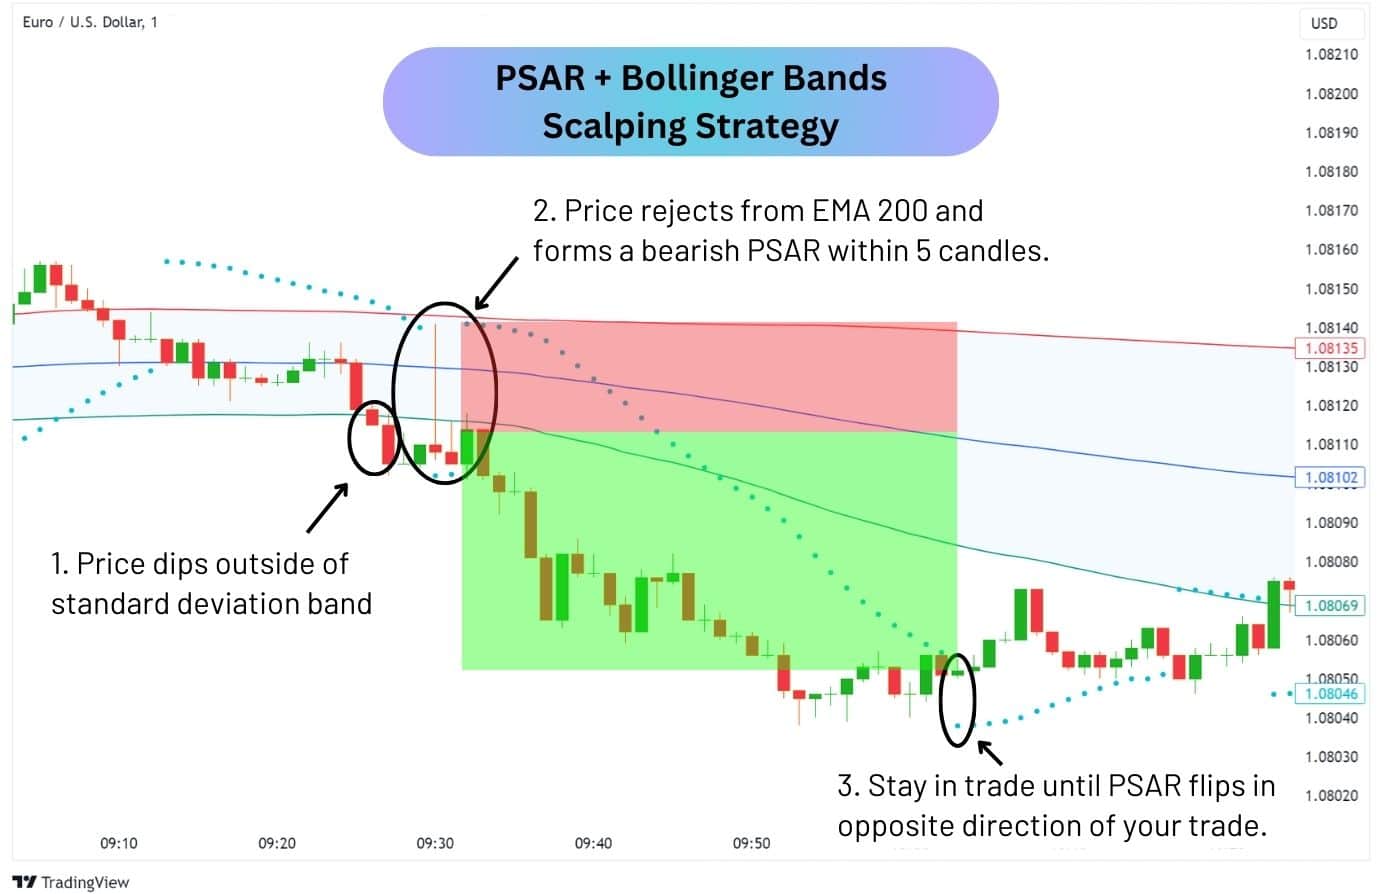
Here’s how it works:
- Wait for the price to go beyond a standard deviation band.
- Watch for a rejection when the price reenters the Bollinger Bands, and retests the EMA 200.
- If a PSAR flip occurs within 5 candles of the rejection, enter a trade in the rejection’s direction.
- The trailing stop loss is set to the PSAR’s location.
| Strategy Settings | |
| Asset and Time frame | EURUSD 1-Minute |
| Bollinger Bands | Standard Deviation: 1Middle Line: EMA 200 |
| PSAR Settings | 0.01, 0.01. 0.2 |
| Take Profit / Stop Loss | Set the PSAR as Trailing Stop Loss |
This is a simple strategy that filters out reliable rejection signals using the Bollinger Bands, and relies on the idea of a trending move occurring after a major support or resistance (EMA 200) has been hit.
If you would like to use this strategy on other assets, we recommend testing which moving average setting works best for it first; in EURUSD’s case, EMA 200 worked best.
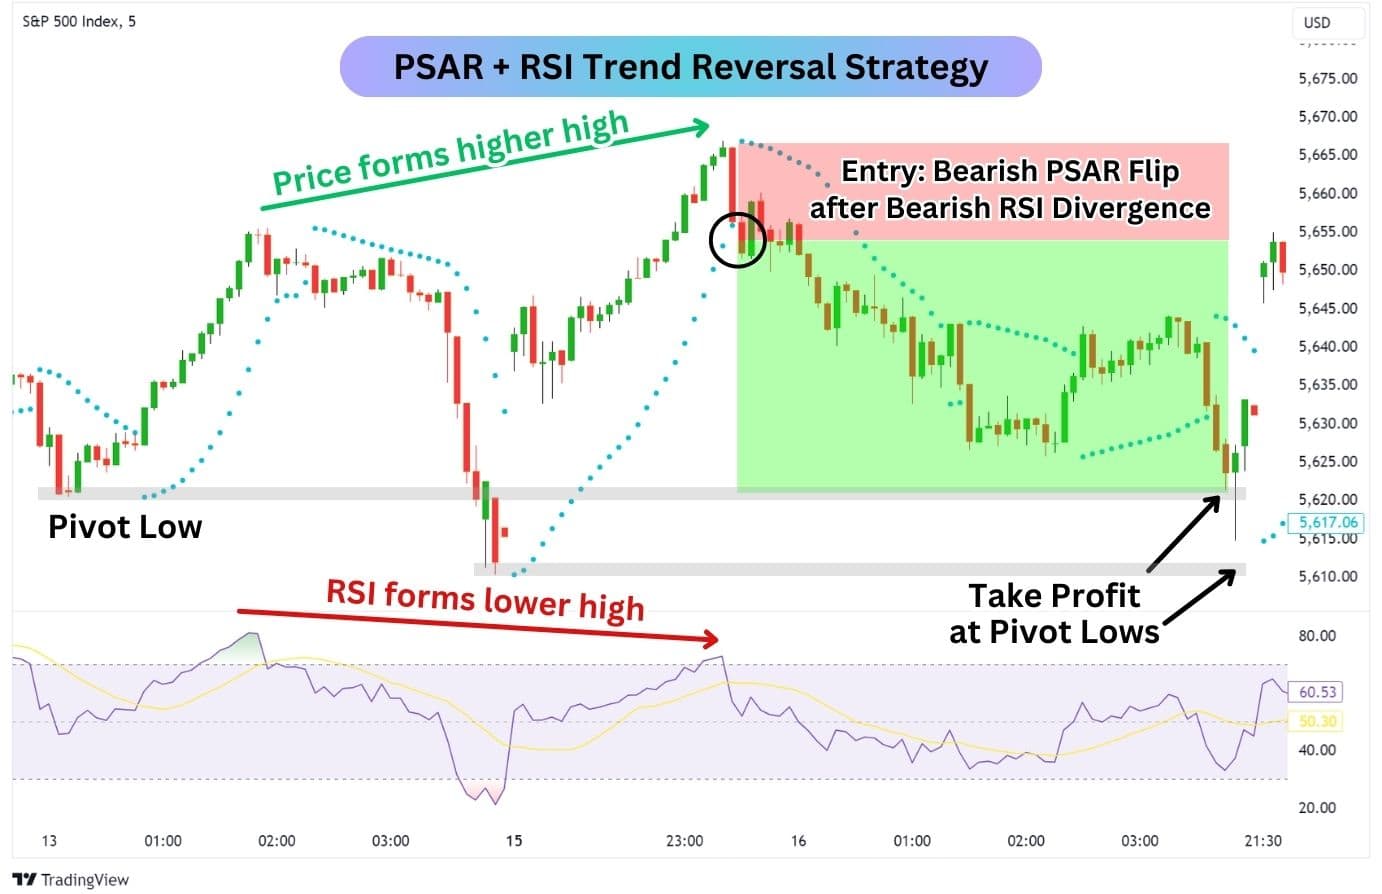
Combining Parabolic SAR and RSI to Identify Trend Reversals
By itself, the Parabolic SAR offers many reversal trade opportunities, allowing traders to trade in a direction every time a parabola flips direction. However, this is quite risky in practice due to how frequently the PSAR changes direction – taking you in and out of trades and racking up a huge sum of trading fees.
Instead, try using a less sensitive reversal indicator, such as the Relative Strength Index (RSI), for its divergence signalling capabilities. When combined together with the Parabolic SAR, traders can get a clean entry into a reversal trade back into key support or resistance levels.
Here’s how it works:
On your RSI indicator, look for a situation where the price and RSI are diverging.
- Bullish Divergence: The price forms a lower low, but the RSI forms a higher low.
- Bearish Divergence: The price forms a higher high, but the RSI forms a lower high.
Once a divergence has been formed on the RSI, it’s not uncommon for the price to stall or whipsaw. Here’s where the Parabolic SAR comes in – once you’ve established a divergence with a directional bias, only enter a reversal trade when the PSAR flips, and aligns with the reversal direction.
In our example of S&P 500 (5 minutes) above, a bearish RSI divergence has formed – indicating that a price decline may happen. When the PSAR flips bearishly, that’ll be our moment to enter a trade. Then, take profit when the price reaches a pivot point in the chart, a price zone in the past that has allowed the price to completely change directions.
Parabolic SAR with Fibonacci Retracement
The parabolic SAR can give us an early notification to start looking for Fibonacci Retracement levels to long or short from – this is because the PSAR can offer us a sneak peak of a potential reversal.
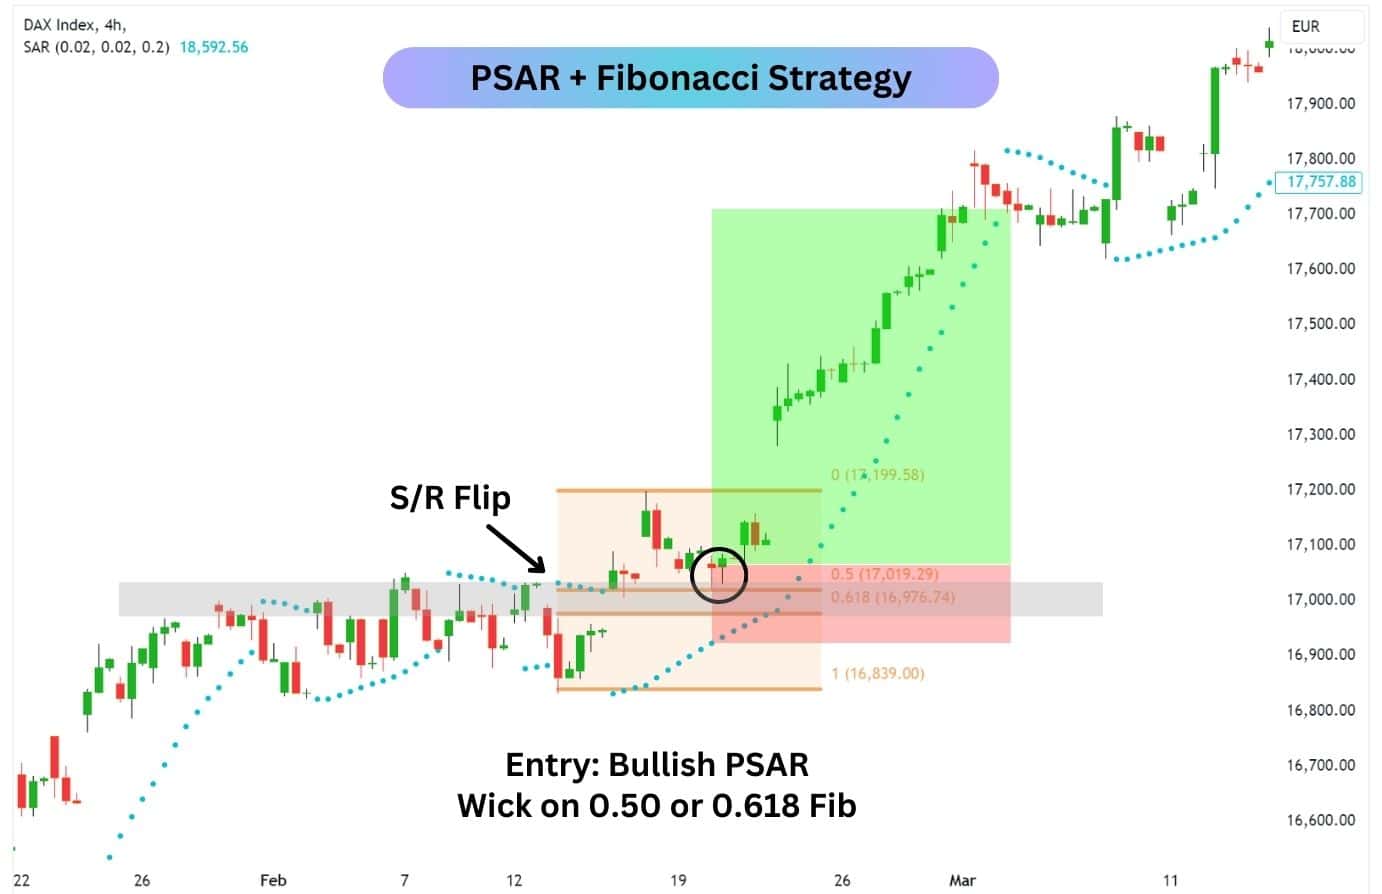
This strategy works best on higher time frames, like the 4-hour chart, as it allows the PSAR to handle corrections up to the 0.618 Fibonacci level. For this strategy, we want to look for rejections at the 0.50 and 0.618 Fibonacci levels.
How it works:
- Identify the Breakout:
- After a prolonged uptrend or downtrend, watch for price to break the PSAR with a large impulsive candle, indicating a potential macro reversal.
- Draw Fibonacci Retracement:
- For a bullish trend, draw from the latest low to the latest high.
- For a bearish trend, draw from the latest high to the latest low.
- Confirm the Retracement:
- Look for a wick at the 0.50 or 0.618 Fibonacci Levels.
- Use Market Structure:
- This strategy can be improved if you consider market structure; where price’s previous support and resistances were, and if they align with the Fibonacci levels.
- Entry Confirmation:
- Wait for a second candle to close in the direction of the rejection before entering the trade.
Target and Stop Loss:
- For swing trading, use a key support or resistance level as your fixed target. Having a fixed target can help you close trades more consistently.
- Alternatively, you can use the Parabolic SAR as a trailing stop loss, which is great for overnight trades but carries the potential for a lower RRR trade.
This approach focuses on confirming minor corrections before entering trades, enhancing the likelihood of capturing strong trends.
Trading Parabolic SAR with Stochastic RSI
The stochastic RSI indicator is great at identifying overbought and oversold conditions in the market to alert traders of an imminent reversal. When the stochastic RSI dips below 20, it is oversold and hints at a potential reversal eventually. When it goes above 80, it is overbought and is at risk of a bearish reversal eventually.
By using the Parabolic SAR and Stochastic RSI together, we can more confidently capture the times when price is reversing. Here’s how it works:
- Go long after the Stochastics RSI forms a double bottom, with the first bottom below 20, and the parabolic SAR flips bullish.
- Go short after the Stochastics RSI forms a double top, with the first peak above 80, and the parabolic SAR flips bearish.
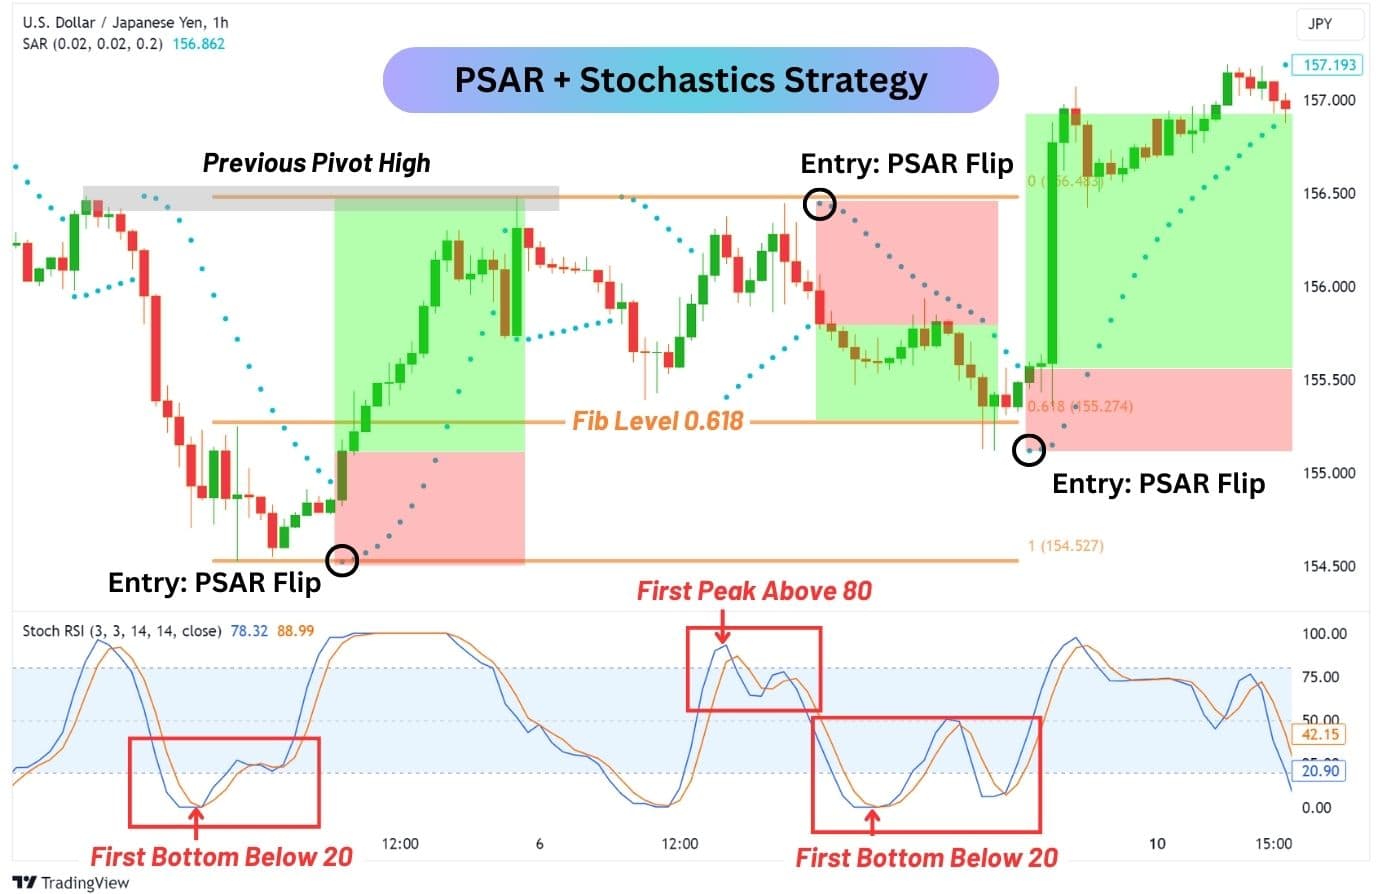
Here we see a 1H chart of USDJPY applying the strategy successfully. We can also further enhance the strategy by having a good understanding of market structure, and using Fibonaccis to find hidden support and resistances.
As you can see from the example above for trades 1 and 2, we gain a better risk-to-reward ratio by taking profit at the key levels and at the Fibonacci retracement.
| Strategy Settings | |
| Stochastics (Default) | K: 3D: 3RSI: 14Stochastic: 14 |
| PSAR (Default) | 0.02, 0.02. 0.2 |
| Take Profit | At key levels, or when the PSAR flips directions |
| Stop Loss | Set the PSAR as Trailing Stop Loss |
Breakout Strategy: Studying Price Action Using Parabolic SAR and ATR
The ATR (Average True Range) is an amazing tool that provides insights into how much an asset is expected to move, based on the average volatility of the past 14 bars.
Traders tend to use the ATR value times two to set a stop loss. By setting the stop loss larger than the typical ATR value, traders can avoid getting prematurely stopped out by typical and average market movements.
Since the Parabolic SAR can be prone to switching directional bias quickly, the combination of the ATR with the PSAR can help reduce the number of premature exits.
A strategy to consider using with ATR is to identify breakouts from a trendline, then wait for the Parabolic SAR to flip in the direction of the breakout before entering a trade. This approach uses a 1:2 risk-reward ratio (RRR), with the ATR guiding the stop loss placement.
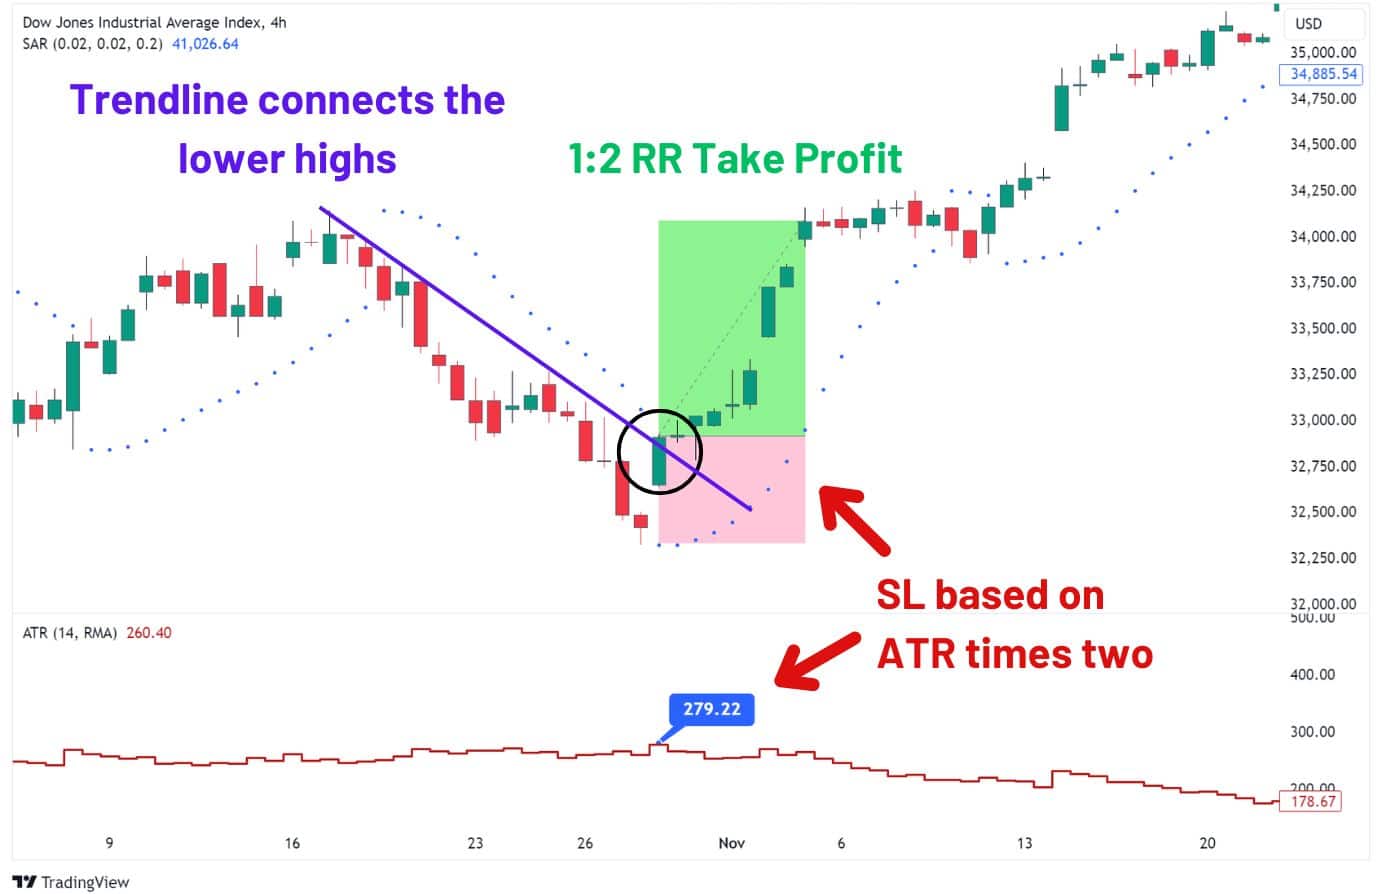
Here’s how it works:
- Draw a trendline connecting lower highs or higher lows.
- Wait for a candlestick to close above the resistance trendline or below the support trendline.
- Wait for the Parabolic SAR to flip in the direction of the candlestick’s breakout, then enter a trade.
- Enter a trade with a 1:2 risk-reward ratio, setting your stop loss at ATR times two pips away.
This strategy is ideal for traders who prefer the flexibility to set a trade, walk away, and wait for the outcome. Unlike using the Parabolic SAR as a trailing stop, which requires frequent monitoring to determine exit points, this approach allows for more hands-off trading.
| Strategy Settings | |
| ATR Length | 14 |
| ATR Multiplier | 2 |
| PSAR (Default) | 0.02, 0.02. 0.2 |
| Take Profit | 1:2 RR |
| Stop Loss | ATR times two pips away from your entry |
Parabolic SAR Forex Strategies

In forex trading, the Parabolic SAR can be effectively used for short term trades. Traders should set the Parabolic SAR with a lower settings, such as step value of 0.01 and a maximum value of 0.1 for smoother trend following and reduction in false signals.
Some strategies suitable for day trading in Forex include:
- Parabolic SAR and Bollinger Bands Strategy
- Parabolic SAR and MACD Strategy
- Double PSAR Strategy
We’ve covered them all above in the article.
What other trading strategy works well with Parabolic SAR Trading?
In addition to the strategies discussed above, the Parabolic SAR can also be effectively combined with other trend-following indicators, such as Ichimoku Kinko Hyo.
By using the Parabolic SAR in conjunction with these other indicators, traders can further enhance their trading strategies and improve their ability to identify profitable trading opportunities.
Advantages of The Parabolic SAR
Here are some advantages of trading with the Parabolic SAR:
- Offers simple entry and exit signals, which makes the PSAR attractive to beginner traders.
- Highly adaptable and customisable to various timeframes, and strategies.
- Doubles as a trailing stop loss indicator, which can sometimes protect profitable trade positions.
Disadvantages of The Parabolic SAR
Despite its advantages, the Parabolic SAR has several limitations:
- Tends to generate false signals in ranging markets.
- Newer traders may not like the PSAR as a trailing stop as it may start off wider than they’d like.
- Settings need to be adjusted based on specific market conditions and strategies.
Parabolic SAR vs Moving Average (MA)
Even though both the Parabolic SAR and Moving Average (MA) are trend-following indicators utilised to identify price movement direction, their calculation methods and the way they represent trends on a price chart differ.
The Parabolic SAR uses an intricate formula involving the highest and lowest price and an acceleration factor to plot points that follow a parabolic curve. These points are then used to identify trend direction and potential reversals.
On the other hand, the Moving Average is calculated by averaging the prices over a certain period and is often used to smooth out price fluctuations and identify the underlying trend.
Both indicators are fantastic tools, and are not replacements for each other. In fact, many of the strategies introduced above use both the PSAR and MA together.
How Can a Trader Prevent False Signals from Parabolic SAR?
To reduce the number of false signals from the Parabolic SAR, consider using lower step value and max value settings. While this will reduce the number of signals generated by the Parabolic SAR, it will prioritise the discovery of strong trends.
This approach generates Parabolic SAR signals that follow trends longer, resulting in less signals and less trading fees (commissions and spreads).
As a reminder, the lower the step value and max value are, the less sensitive the indicator is. That is exactly what we are looking for when we’re trying to refine our PSAR signals.
To go one step further, you can apply other indicators with the Parabolic SAR, as we have demonstrated above, to reduce false signals.
Frequently Asked Questions
What are the best Parabolic SAR settings?
Most traders utilise the default settings of 0.02, 0.02, 0.2. For a less sensitive PSAR, traders will reduce those factors depending on the market conditions.
| Default Settings | 0.02, 0.02, 0.2 |
| Less Sensitive(Smoother Line) | 0.01, 0.01, 0.1 |
Which timeframe is best for Parabolic SAR?
Many traders enjoy using this indicator for day trading and scalping, which prioritise smaller time frames such as 5, 15, 30, or 60-minute charts. The Parabolic SAR is extremely versatile in that it can be effective on any time frame. However, it’s important to pair the PSAR with other indicators to enhance the signals’ accuracy.
What does the Parabolic SAR tell us about market trends?
The Parabolic SAR can provide an early indication of a trend reversal, and also provide insights into whether a trend is likely to continue. Armed with the unique insights from the Parabolic SAR, traders can make educated decisions about staying in, or exiting the market.
What is the function of the Acceleration Factor (AF) in the Parabolic SAR calculation?
The Acceleration Factor (AF) determines the rate at which the indicator moves in response to price changes – which directly affects the location of the parabolas (dots). The AF starts at a specified value (commonly 0.02) and can increase each time the trend extends, usually by 0.02.
By adjusting the AF, traders can control the sensitivity of the Parabolic SAR, making it more or less responsive to price changes depending on their trading strategy.
What does the term ‘Step Increment’ mean in the context of Parabolic SAR?
In the context of the Parabolic SAR, the ‘Step Increment’ refers to how quickly the acceleration factor increases as the trend continues. This increment is crucial for determining the sensitivity of the Parabolic SAR to price changes. By adjusting the Step Increment, traders can control how responsive the Parabolic SAR is to price fluctuations, making it more or less sensitive to changes in price.
How reliable is Parabolic SAR?
The trader’s overall approach, the input parameters used, and the market conditions largely determine the reliability of the Parabolic SAR. When used correctly, the Parabolic SAR can provide valuable insights into market trends and potential reversals. However, like all indicators, it is not infallible and can produce false signals, especially in choppy or sideways markets.
Is Parabolic SAR a Leading or Lagging Indicator?
It is classified as a lagging indicator as its formula relies on past data. This means some reversal signals can be generated slightly late, causing some profits to be missed. However, the PSAR is generally more reactive than moving averages in signalling reversals, making it a valuable tool for technical analysis.
What is the origin of Parabolic SAR
J. Welles Wilder is the creator of the Parabolic SAR “Stop-and-Reverse” system in the late 1970s. He designed this indicator to help traders identify potential turning points in price, and also serve as a trend filter. Since then, the Parabolic SAR has become a popular tool amongst technical traders, and is beloved for its versatility and ease of use.
Is Parabolic SAR good for scalping?
The Parabolic SAR can be an effective tool for scalping strategies provided the trader can manage risk effectively and execute trades quickly. Since the PSAR can provide frequent signals on lower time frames, it is important to include additional conditions to narrow down your entry signals. By doing so, you can optimise your scalping strategy with the PSAR to take trades with a higher risk-to-reward ratio, which will offset the cumulative spreads and commissions incurred from scalping.
Is Parabolic SAR profitable?
When traded standalone, the parabolic SAR can be iffy in producing consistently winning results – leading to lower profitability. However, when paired with other indicators to create a strategy, the PSAR can generate profitable entry signals over a series of trades.
Which timeframe is best for Parabolic SAR?
The trader’s strategy and market conditions determine the best timeframe for Parabolic SAR trading. Some common time frames used by traders include:
- 1-minute charts
- 5-minute charts
- 15-minute charts
- 30-minute charts
- 1-hour charts
- 4-hour charts
- Daily charts
The Parabolic SAR works effectively across different timeframes, and its effectiveness varies based on a trader’s strategy.
How effective is the Parabolic SAR in different market conditions?
The Parabolic SAR performs exceptionally well in volatile markets due to its ability to secure profits for the majority of the trending move. However, in ranging markets, the price movement and volatility may be too small for any kind of significant gain. Therefore, traders often pair the PSAR with other indicators such as ADX, Stochastics, and the MACD to find trending conditions to trade in.


