Written by:

Reviewed by:


Bearish
Bullish
- May 29, 2026
- 29 min read
Turtle Soup Trading Strategy Explained with Examples
There are many traders who use breakout strategies, entering positions when price breaks a key level in expectation of continuation. However, not all breakouts hold. Some fail and reverse, trapping traders on the wrong side.
But what if you could take advantage of that behaviour?
This is where the turtle soup trading strategy comes in. Rather than following breakouts, it focuses on failed breakouts, allowing traders to position against them.
In this guide, you will learn the origins of this strategy, how it works, and how to combine it with other approaches to identify high-probability setups.
What is Turtle Soup Trading?
The turtle soup trading strategy is an approach that focuses on failed breakouts and liquidity sweeps. Instead of following price when it breaks a key level, traders wait for the breakout to fail and then trade in the opposite direction.
The concept was originally developed by Linda Bradford Raschke as a contrarian alternative to breakout trading. It focuses on situations where price breaks a key level, particularly a recent 20-day high or low, and then fails to continue, creating opportunities for reversals as trapped breakout traders are forced to exit.
In more recent years, many retail traders have come to associate similar failed breakout and liquidity sweep behaviour with ICT-style trading, popularised by Michael J. Huddleston.
While the terminology and framework may differ, the core idea remains the same: a breakout does not always lead to continuation. In many cases, price moves beyond a key level, fails to hold, and then reverses in the opposite direction.
This is why the strategy is considered contrarian. It focuses on moments where the market traps participants and shifts direction.
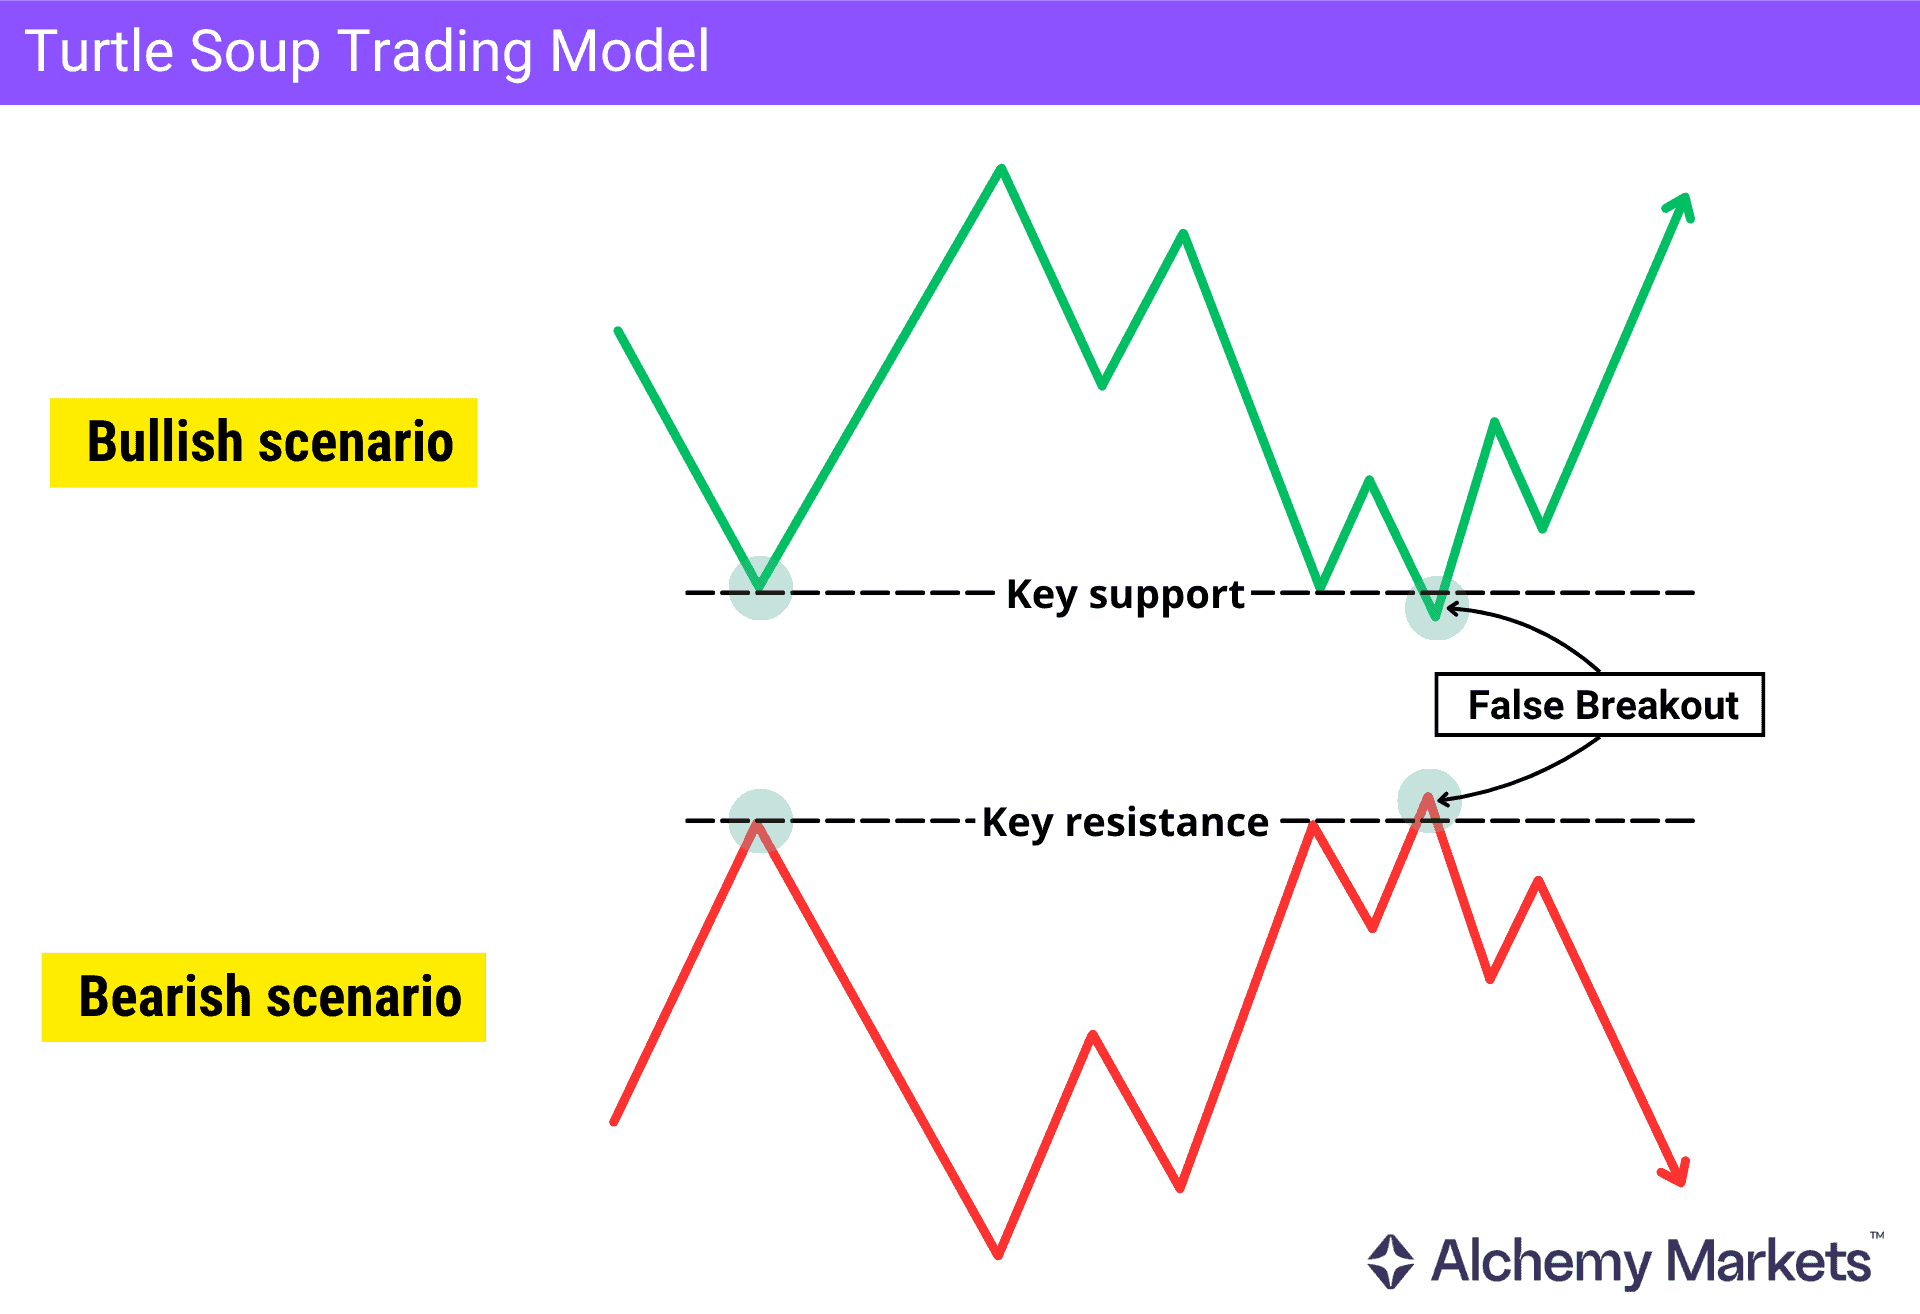
At its core, the turtle soup strategy relies on three elements:
- Liquidity above highs and below lows
- False breakouts (liquidity sweeps)
- Taking trades after confirmations and targeting opposite levels
Unlike traditional breakout strategies, this method works when the breakout fails. This signals that the market is not ready to continue and may move toward the opposite side of liquidity.
Logic Behind the Name of Turtle Soup Trading
The name Turtle Soup starts with the original Turtle Trading system created by Richard Dennis and Bill Eckhardt in the 1980s. Their method was built around breakouts. Using an indicator (Donchian Channels) to track the highest high or lowest low over a 20-day or 50-day period, turtle traders would enter a trade when a new high or low was detected.
The catch was that many of those breakout trades did not work. Losses were common, but the system was designed so that a few large winning trends could outweigh all the smaller failed trades.
Then came another trader, Linda Bradford Raschke, into the mix. She noticed that since turtles were losing their trades frequently, there was something exploitable about their setup — hence the Turtle Soup strategy was born.
Instead of asking how to follow a breakout, she asked what happens when that breakout fails. Her answer became the foundation of Turtle Soup: when price breaks a key level, traps traders into thinking the move will continue, then snaps back into the range, that failed breakout can become the real opportunity.
So while Turtle Trading was built to chase breakouts, Turtle Soup was built to fade them when they fail.
Nowadays, most traders take on the ICT variant of the Turtle Soup approach. Instead of focusing rigidly on 20-day or 50-day highs and lows, you’d place more emphasis on liquidity sweeps, market structure shifts (MSS), and lower timeframe confirmation.
What are the Key Components of Turtle Soup Trading
Understanding the key elements of the turtle soup trading strategy is essential before applying it in markets. These components explain how price behaves, how structure forms, and how shifts in behaviour create trading opportunities.
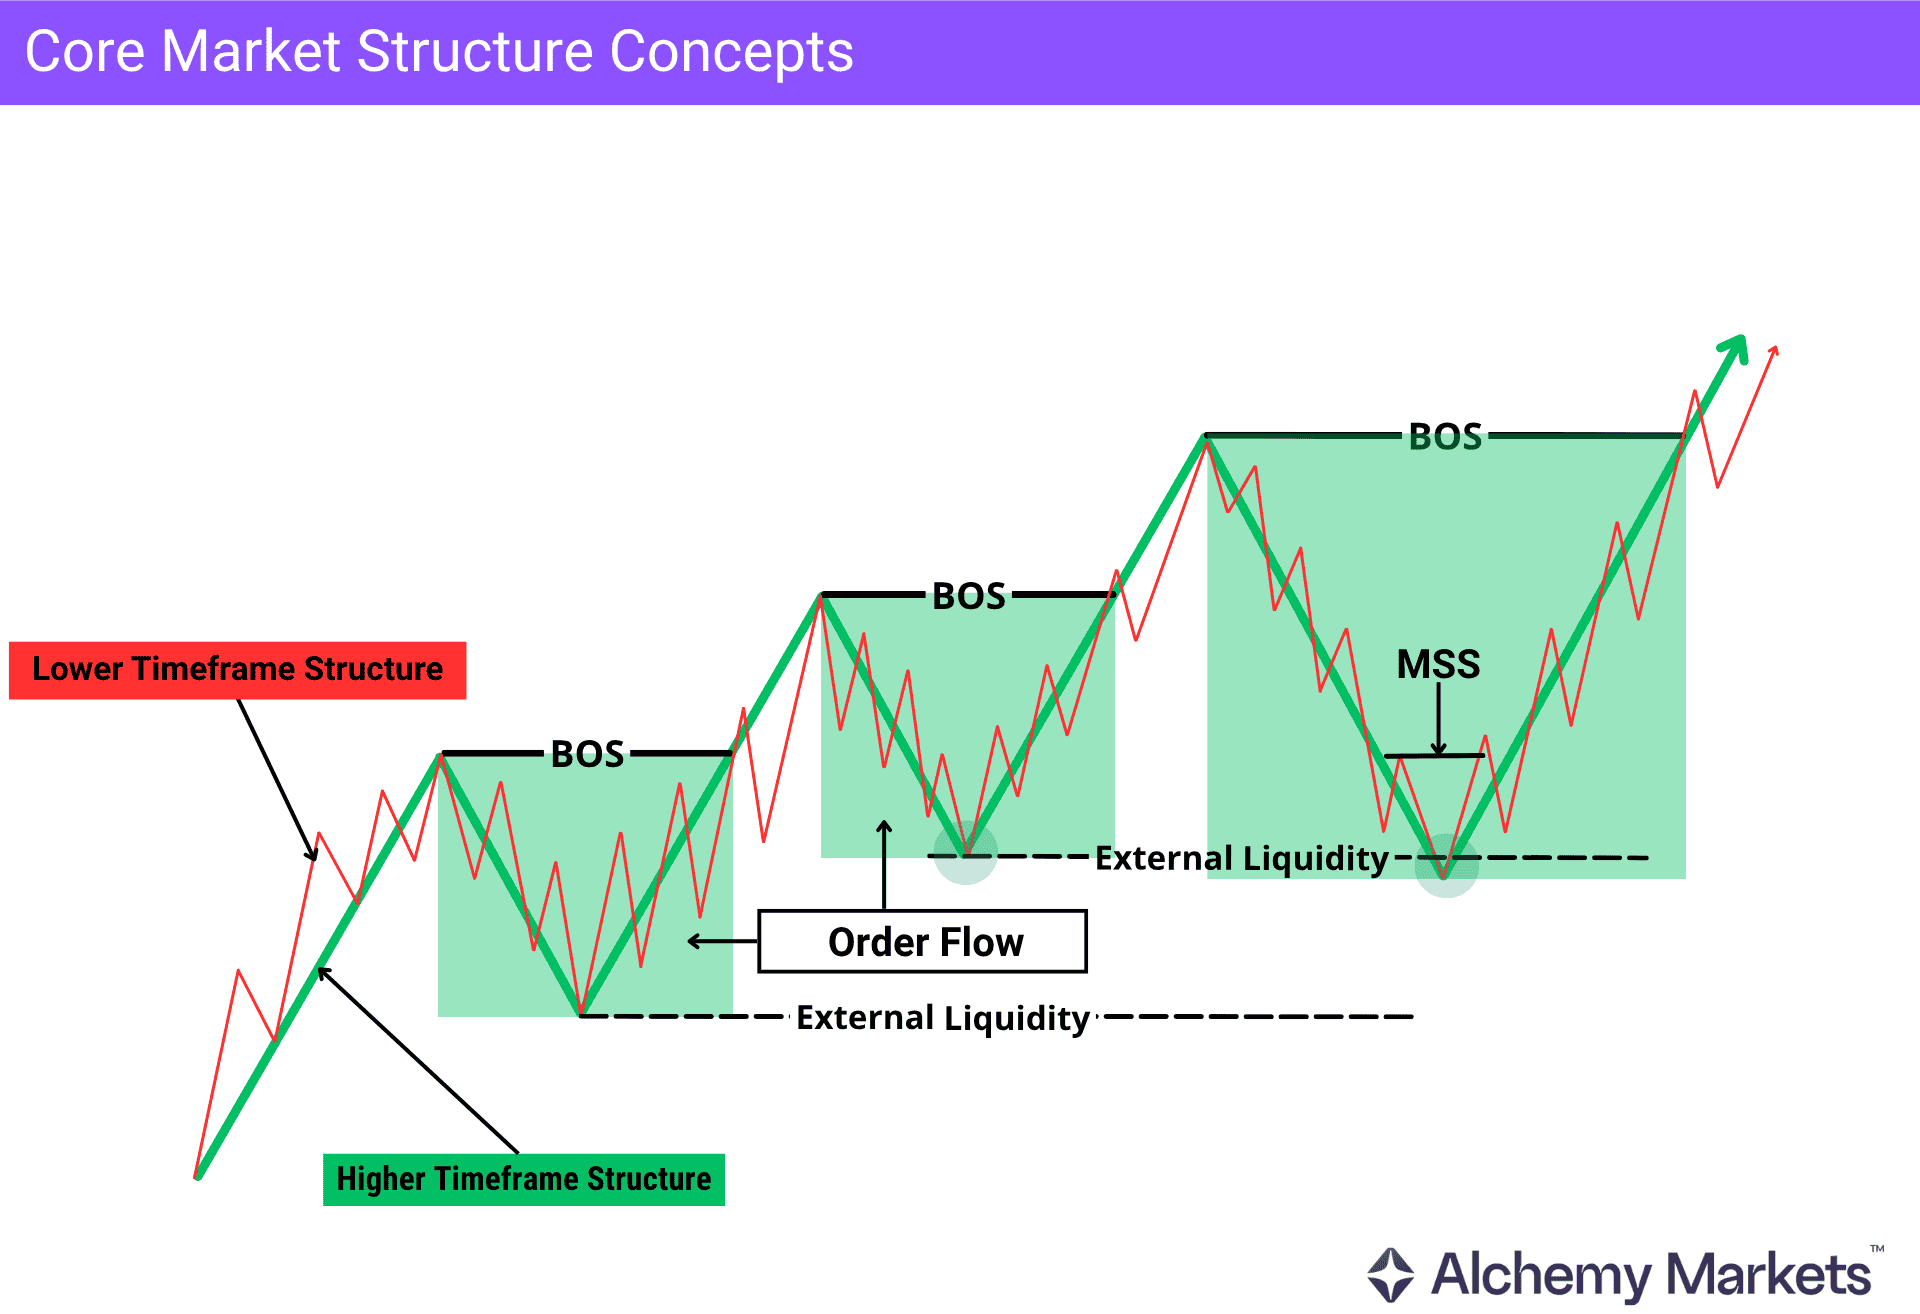
Order Flow
Order flow generally refers to the analysis of buying and selling activity in the market to understand how price moves and anticipate potential future direction.
In Smart Money and ICT concepts, order flow is viewed differently. It is not just about orders, but about how price moves from one swing point to another, forming a clear directional move.
In a bullish structure, order flow forms from a swing low to a swing high. In a bearish structure, it forms from a swing high to a swing low.
These movements define areas where price may retrace, react, and continue in the original direction. In a reversal scenario, a new order flow begins to form in the opposite direction.
In Turtle Soup setups, this helps identify external levels where breakouts are more likely to fail, typically at the boundaries of order flow, while internal levels form inside it.
Order flow can also act as an area of interest itself, where price may react to an old order flow after sweeping a level, adding confluence to the Turtle Soup setup.
Break of Structure (BOS)
In Turtle Soup setups, BOS is used to define the trend and align trades with the overall direction.
A break of structure (BOS) is a market structure concept used to confirm the current trend direction. It reflects continuation within an existing structure.
- In a bullish structure, price forms a series of higher highs (HH) and higher lows (HL). When price breaks a previous high, it confirms a BOS, supporting the continuation of the uptrend.
- In a bearish structure, price forms a series of lower highs (LH) and lower lows (LL). When price breaks a previous low, it confirms a BOS, supporting the continuation of the downtrend.
BOS can also act as additional confirmation after a liquidity sweep, where price forms an MSS in the opposite direction followed by a BOS, confirming the new direction aligned with the Turtle Soup setup.
Market Structure Shift (MSS)
In Turtle Soup setups, MSS is used to confirm the failed breakout after price sweeps a key level, as entering immediately can be risky.
A market structure shift (MSS) represents a change in directional behaviour, not continuation. It occurs when price, after moving in one direction, breaks structure in the opposite direction, signalling a potential shift in momentum.
This concept is closely related to Change of Character (CHoCH), which also reflects an early shift in price behaviour.
For example:
- In a bullish structure, an MSS occurs when price breaks a previous higher low.
- In a bearish structure, an MSS occurs when price breaks a previous lower high.
By waiting for price to break in the opposite direction, it signals that the breakout has failed and that the current trend may be weakening. Overall, improving the odds that price could begin to reverse in the opposite direction.
Higher Timeframe Structure
In Turtle Soup trading, the higher timeframe is used to find the higher-probability zones where a setup is more likely to form.
These are usually key swing highs and lows, where liquidity is resting and where failed breakouts tend to matter more. Common higher timeframes include the weekly, daily, and 4-hour charts.
Lower Timeframe Structure
Once price reaches a higher timeframe liquidity zone, the lower timeframe is used to confirm whether the sweep is actually failing.
This is where traders look for signs such as an MSS, a reclaim of the swept level, or a cleaner reaction from an order block or fair value gap. Lower timeframes such as the 1-hour, 15-minute, and 5-minute charts are mainly used to refine entry, stop placement, and near-term targets.
Liquidity Concepts in Turtle Soup Trading
With that structure in place, the next step is understanding the liquidity concepts that make Turtle Soup setups work. These help explain how price interacts with key levels, sweeps liquidity, and creates reversal opportunities.
These concepts describe how price interacts with liquidity and how those interactions create trading opportunities:
- Stop Hunt
- External and internal liquidity
- Liquidity sweep and grab
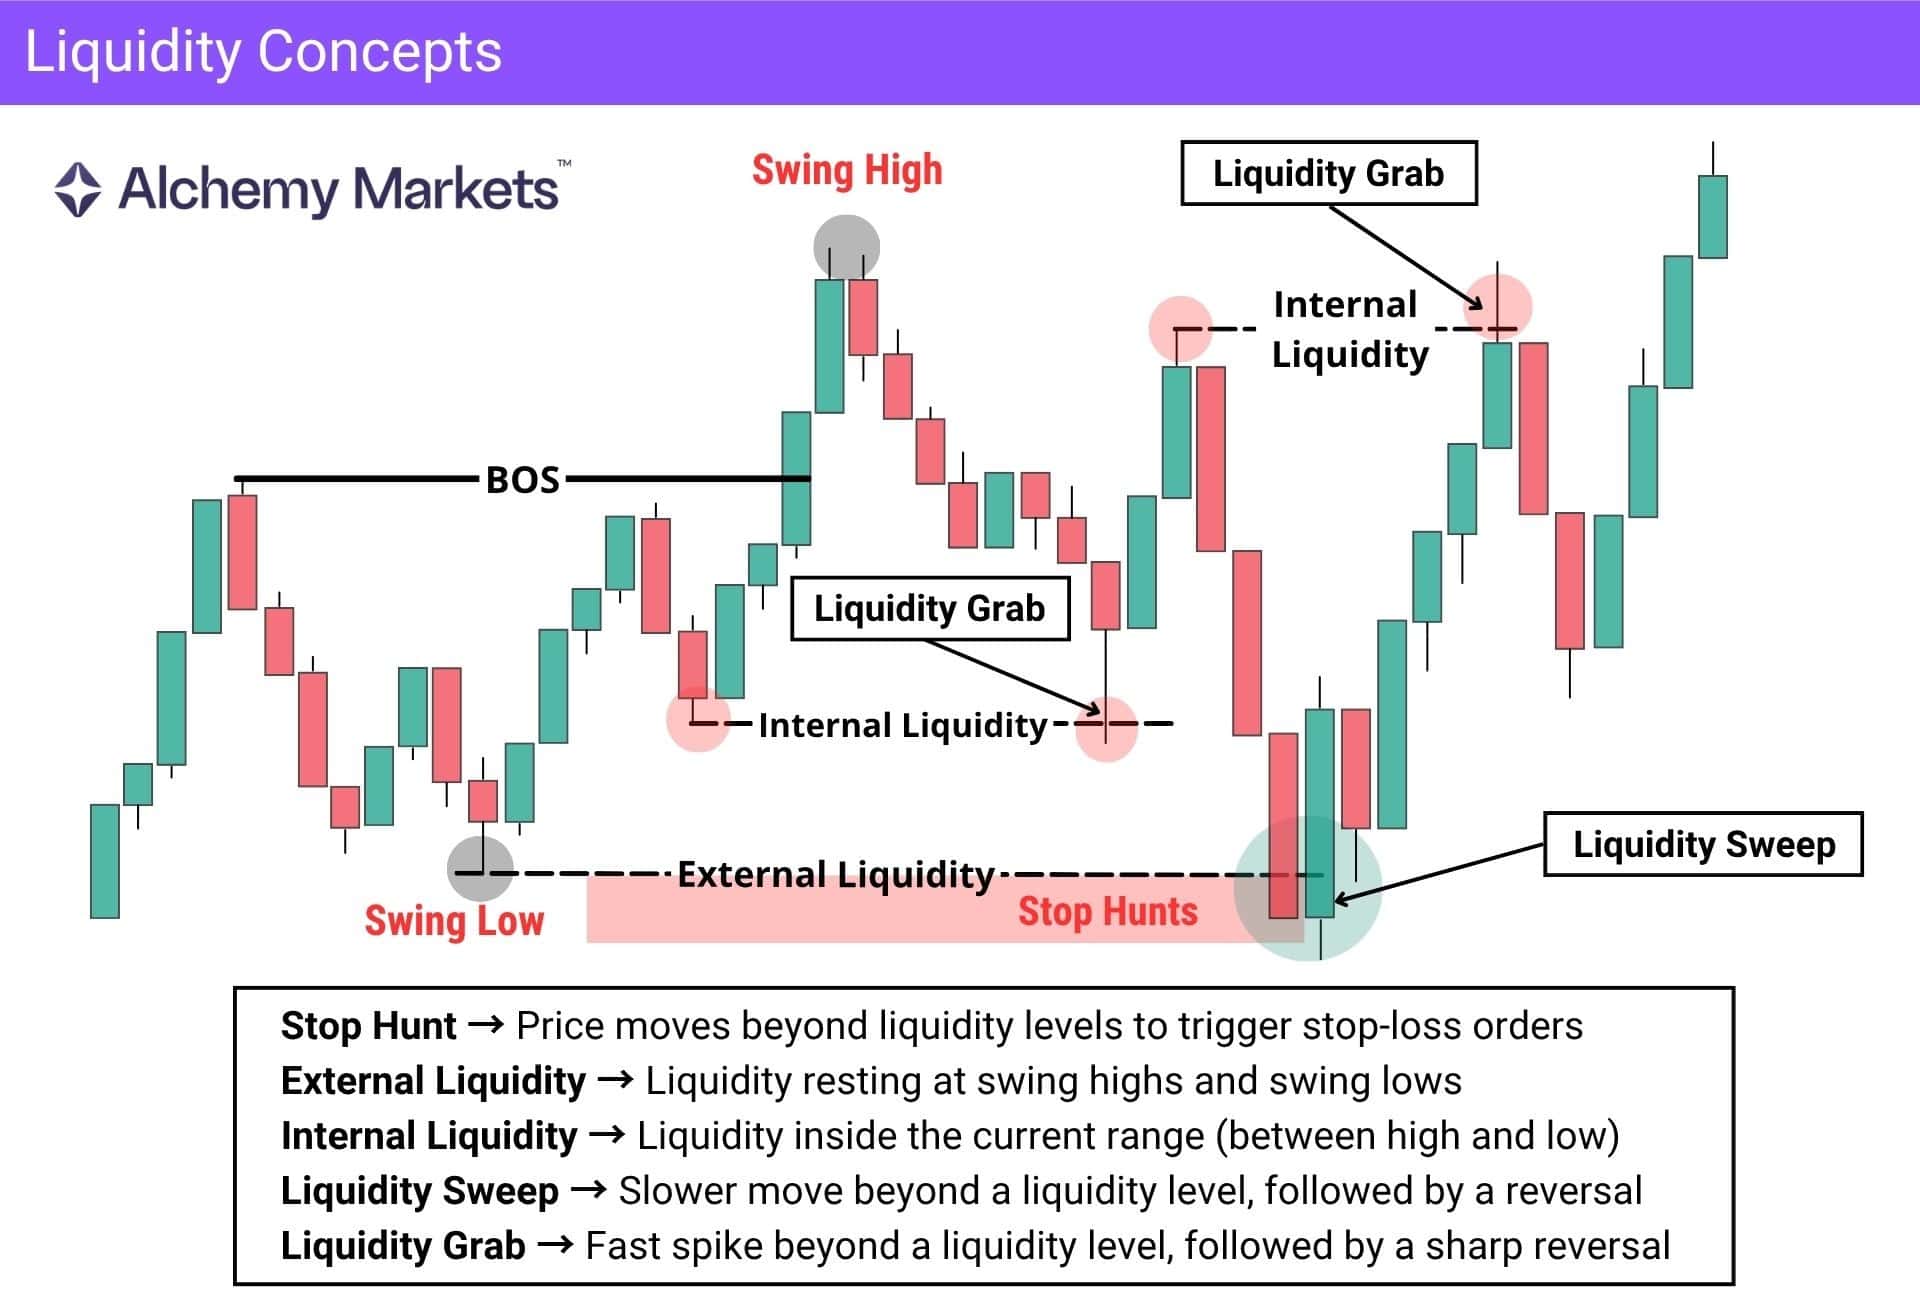
Stop Hunts
A stop hunt occurs when price moves beyond a key level to trigger stop-loss orders. These moves typically occur around:
- Swing highs
- Swing lows
- Key support and resistance levels
In the Turtle Soup strategy, stop hunts are the main driving force behind the setup. They are liquidity events where the market clears orders beyond key levels before a potential reversal.
Liquidity Grab
A liquidity grab occurs when price moves beyond a level, triggers stop-loss orders as part of a stop hunt, and fails to continue in that direction. It usually happens very quickly, appearing as a sharp spike followed by immediate rejection.
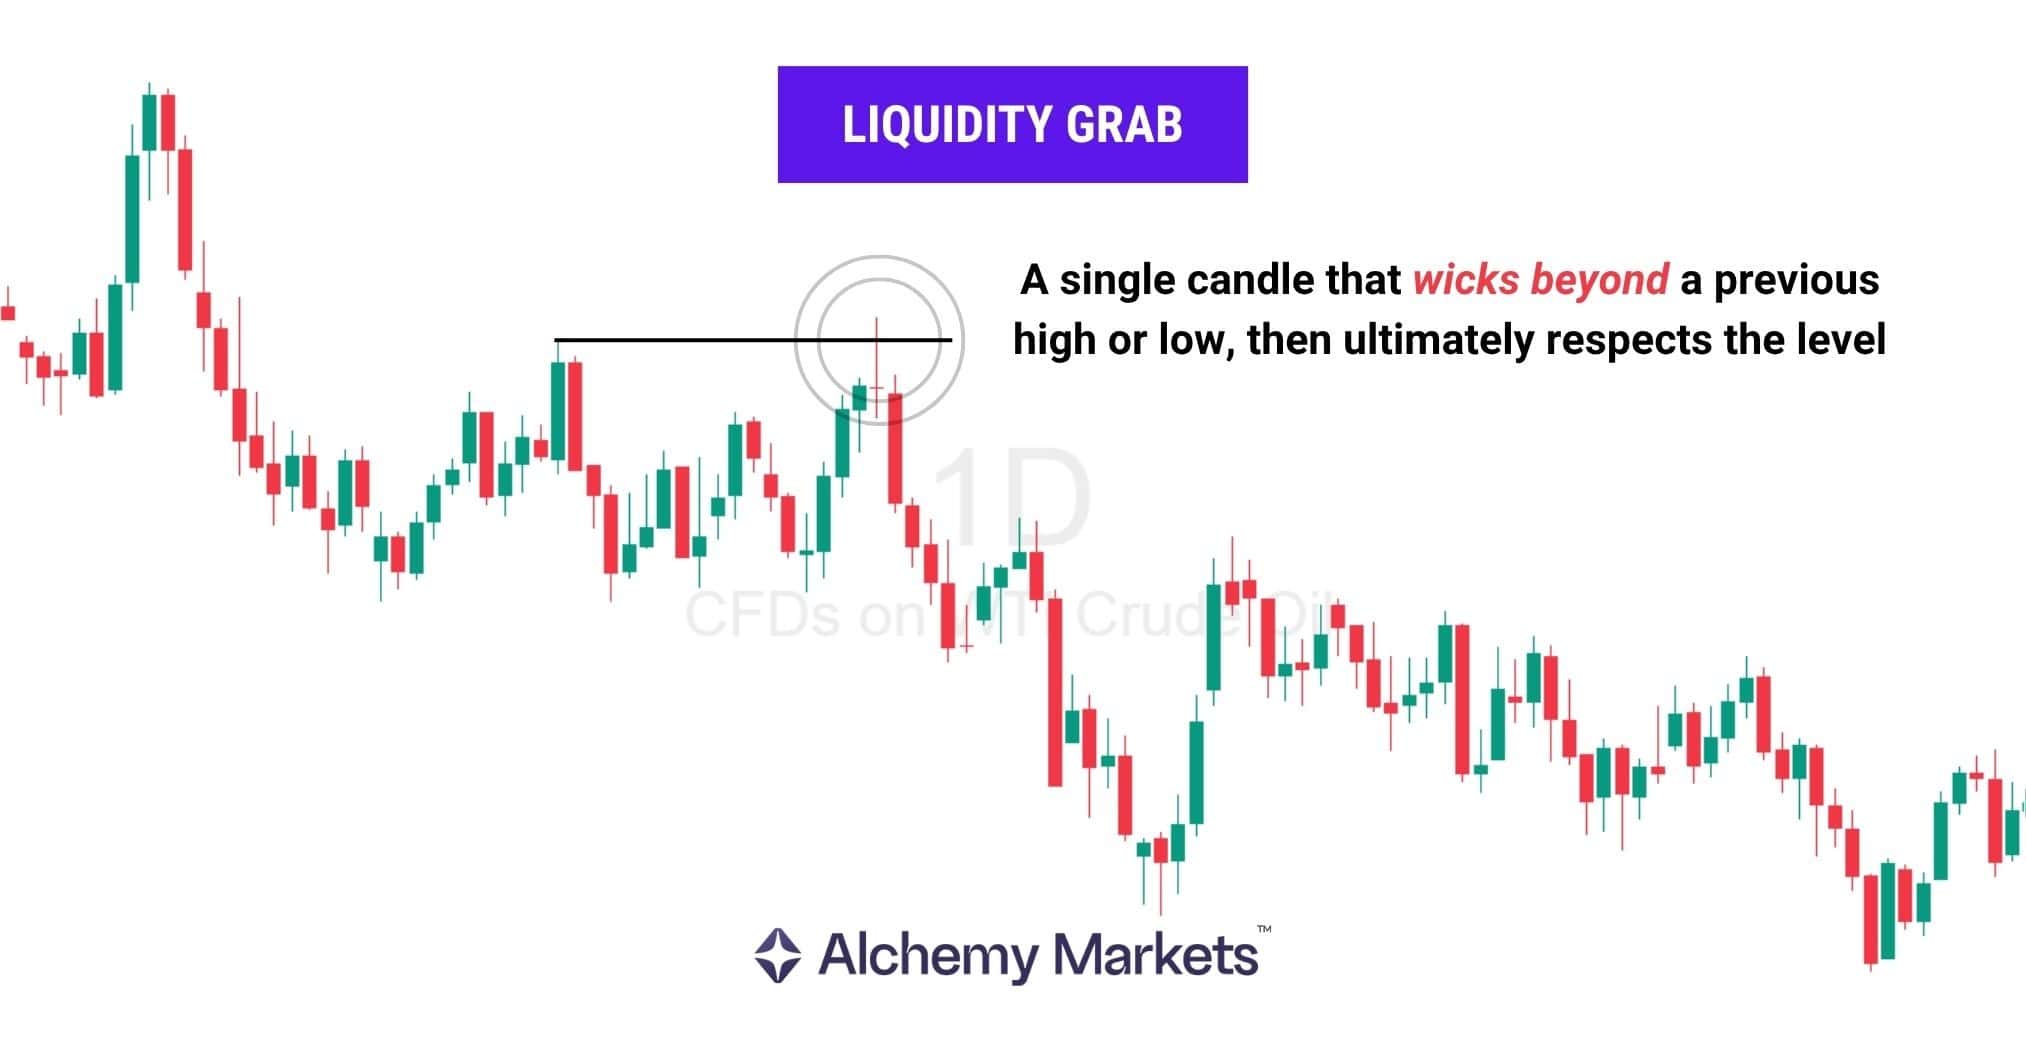
Liquidity Sweep
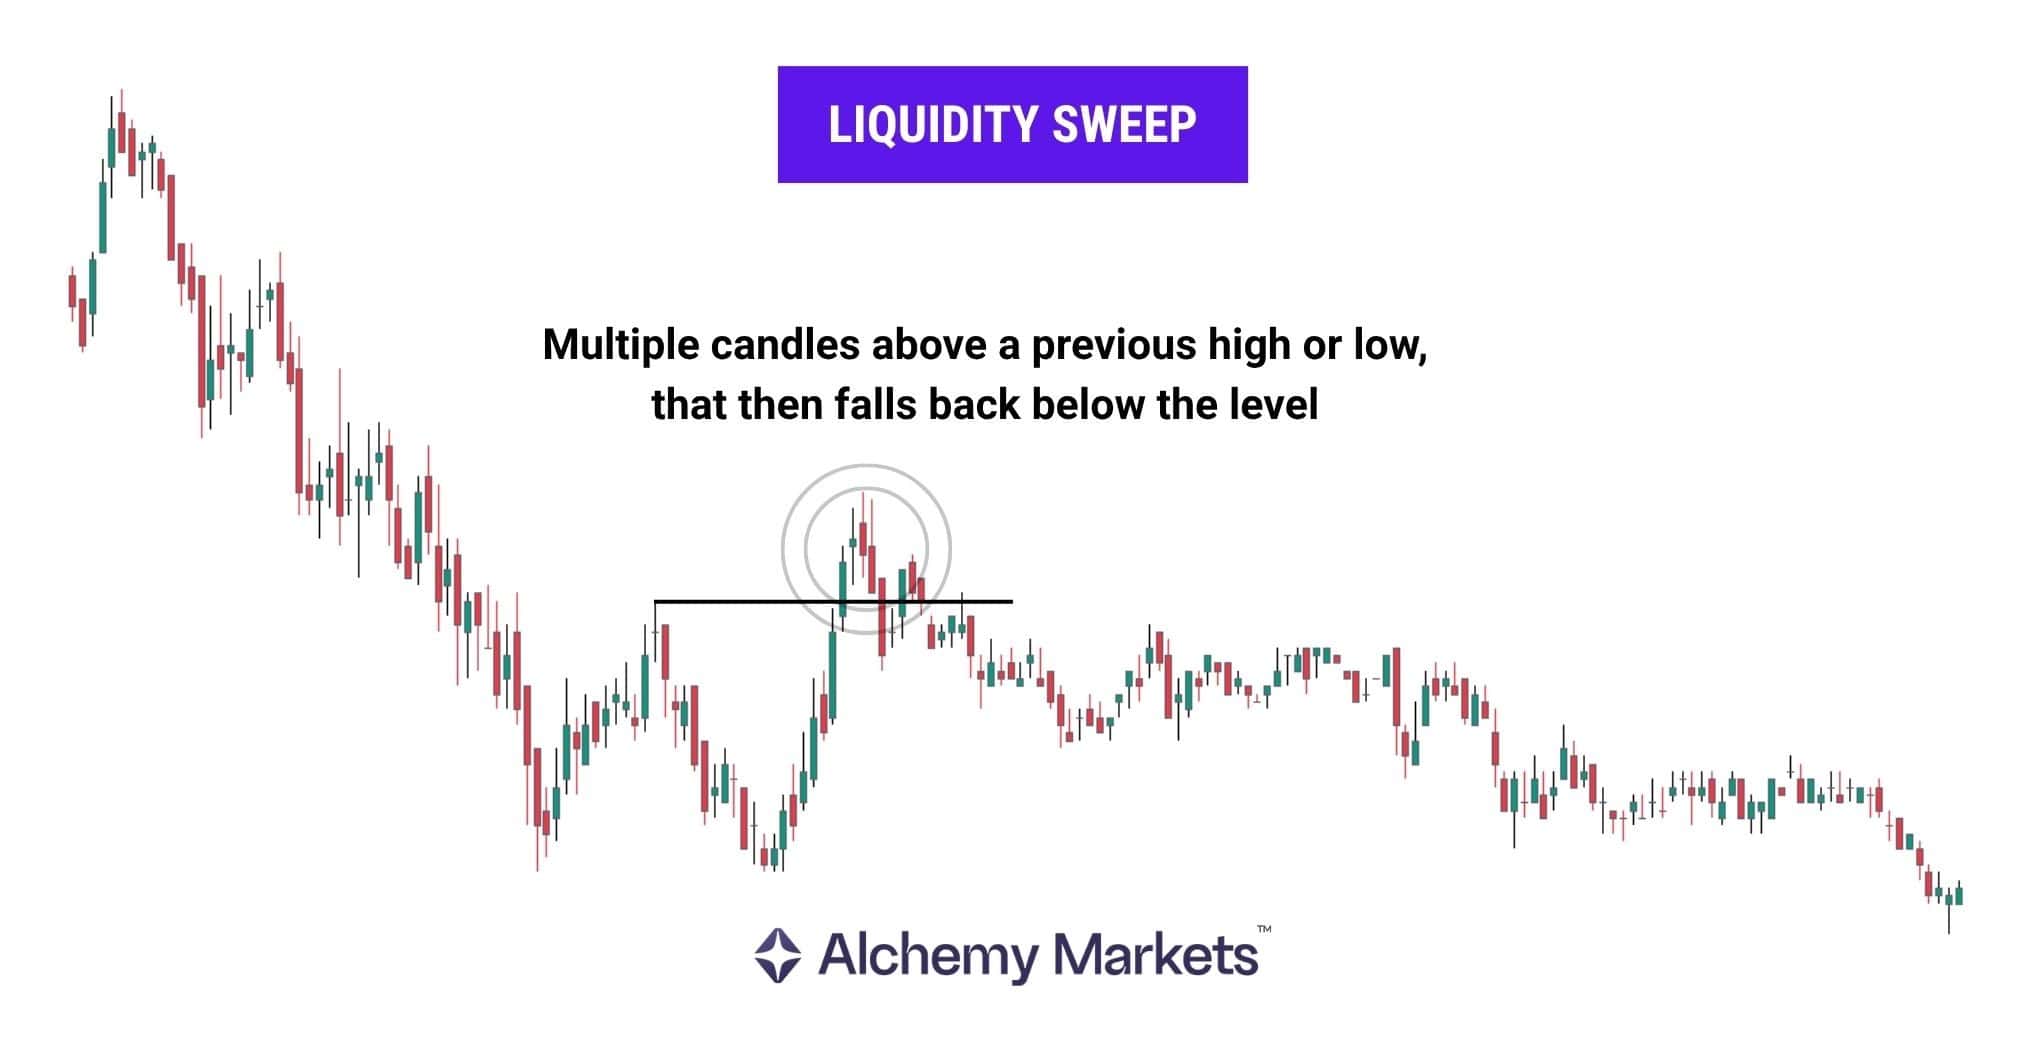
A liquidity sweep occurs when price moves beyond a level, triggers stop-loss orders as part of a stop hunt, and fails to continue in that direction. Unlike a grab, the move develops more gradually, often forming multiple candles.
This provides more time to observe behaviour and wait for confirmation.
Internal Liquidity
Internal liquidity refers to the smaller pools of stops and resting orders that form within the current swing range, between the swing high and swing low. These highs and lows sit inside the broader structure and are often swept before price reaches the range boundary. Because of that, internal liquidity helps explain how price moves within the range, but it is usually less important than external liquidity when identifying the main reversal point in a Turtle Soup setup.
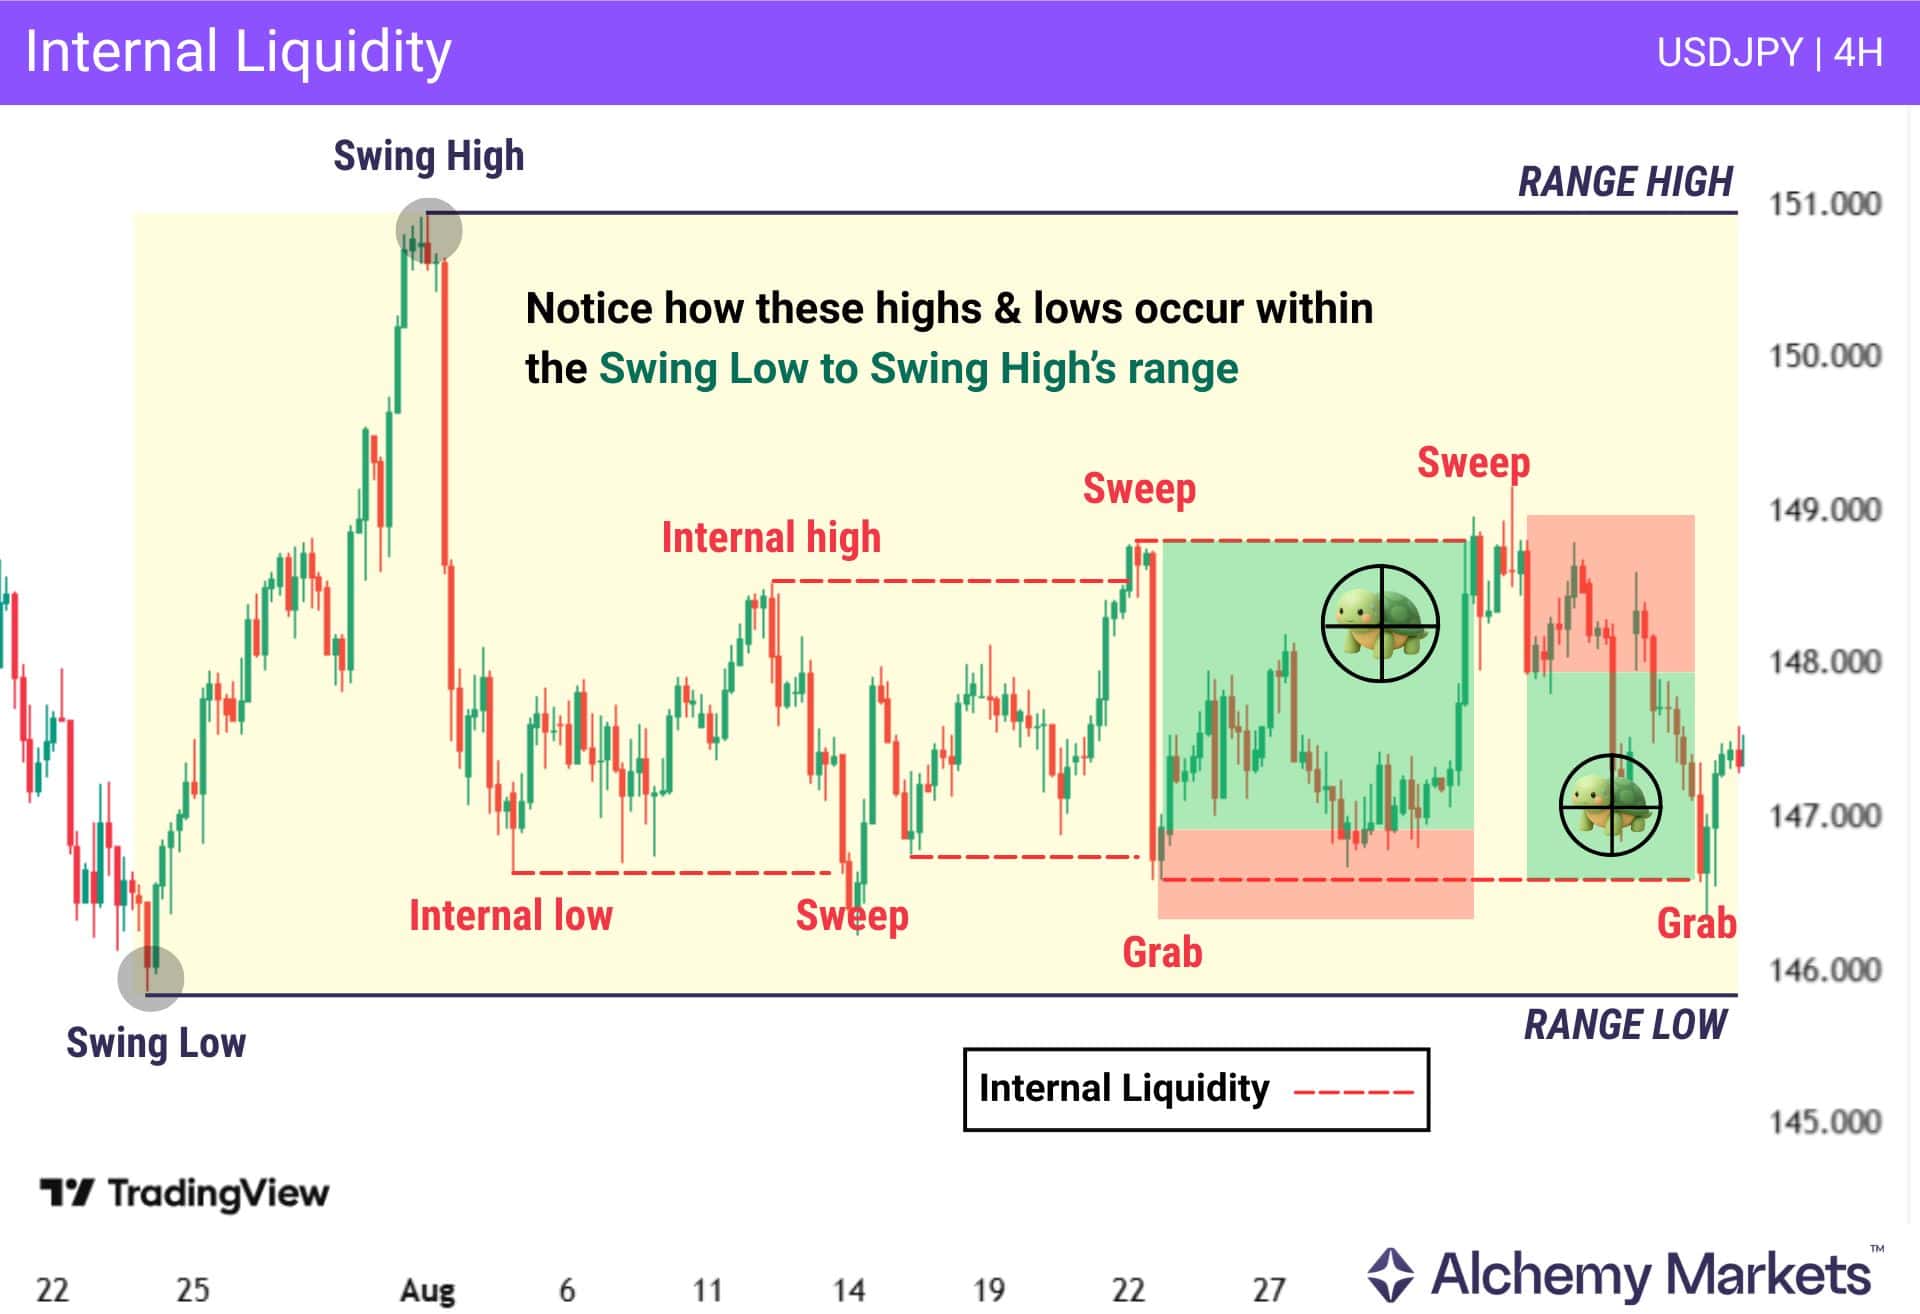
In practice, internal liquidity is more useful for refining entries and identifying first targets after the main liquidity event has already taken place. It can still produce smaller reactions, especially when it lines up with the higher timeframe structure and lower timeframe confirmation such as a market structure shift (MSS), order block, or fair value gap (FVG).
As shown in the chart above, price repeatedly sweeps and grabs these smaller internal highs and lows while still trading inside the broader swing range. That is why internal liquidity is best treated as a supporting tool for execution and short-term targeting, rather than the main source of the reversal itself.
External Liquidity
External liquidity refers to the larger pools of stops and resting orders that sit at the boundaries of the current range, typically at the swing high and swing low. These levels are more important because they form at the edge of the structure, where price is more likely to trigger stop-loss orders, create a false breakout, and then reverse. In Turtle Soup trading, this is where the main setup usually begins.
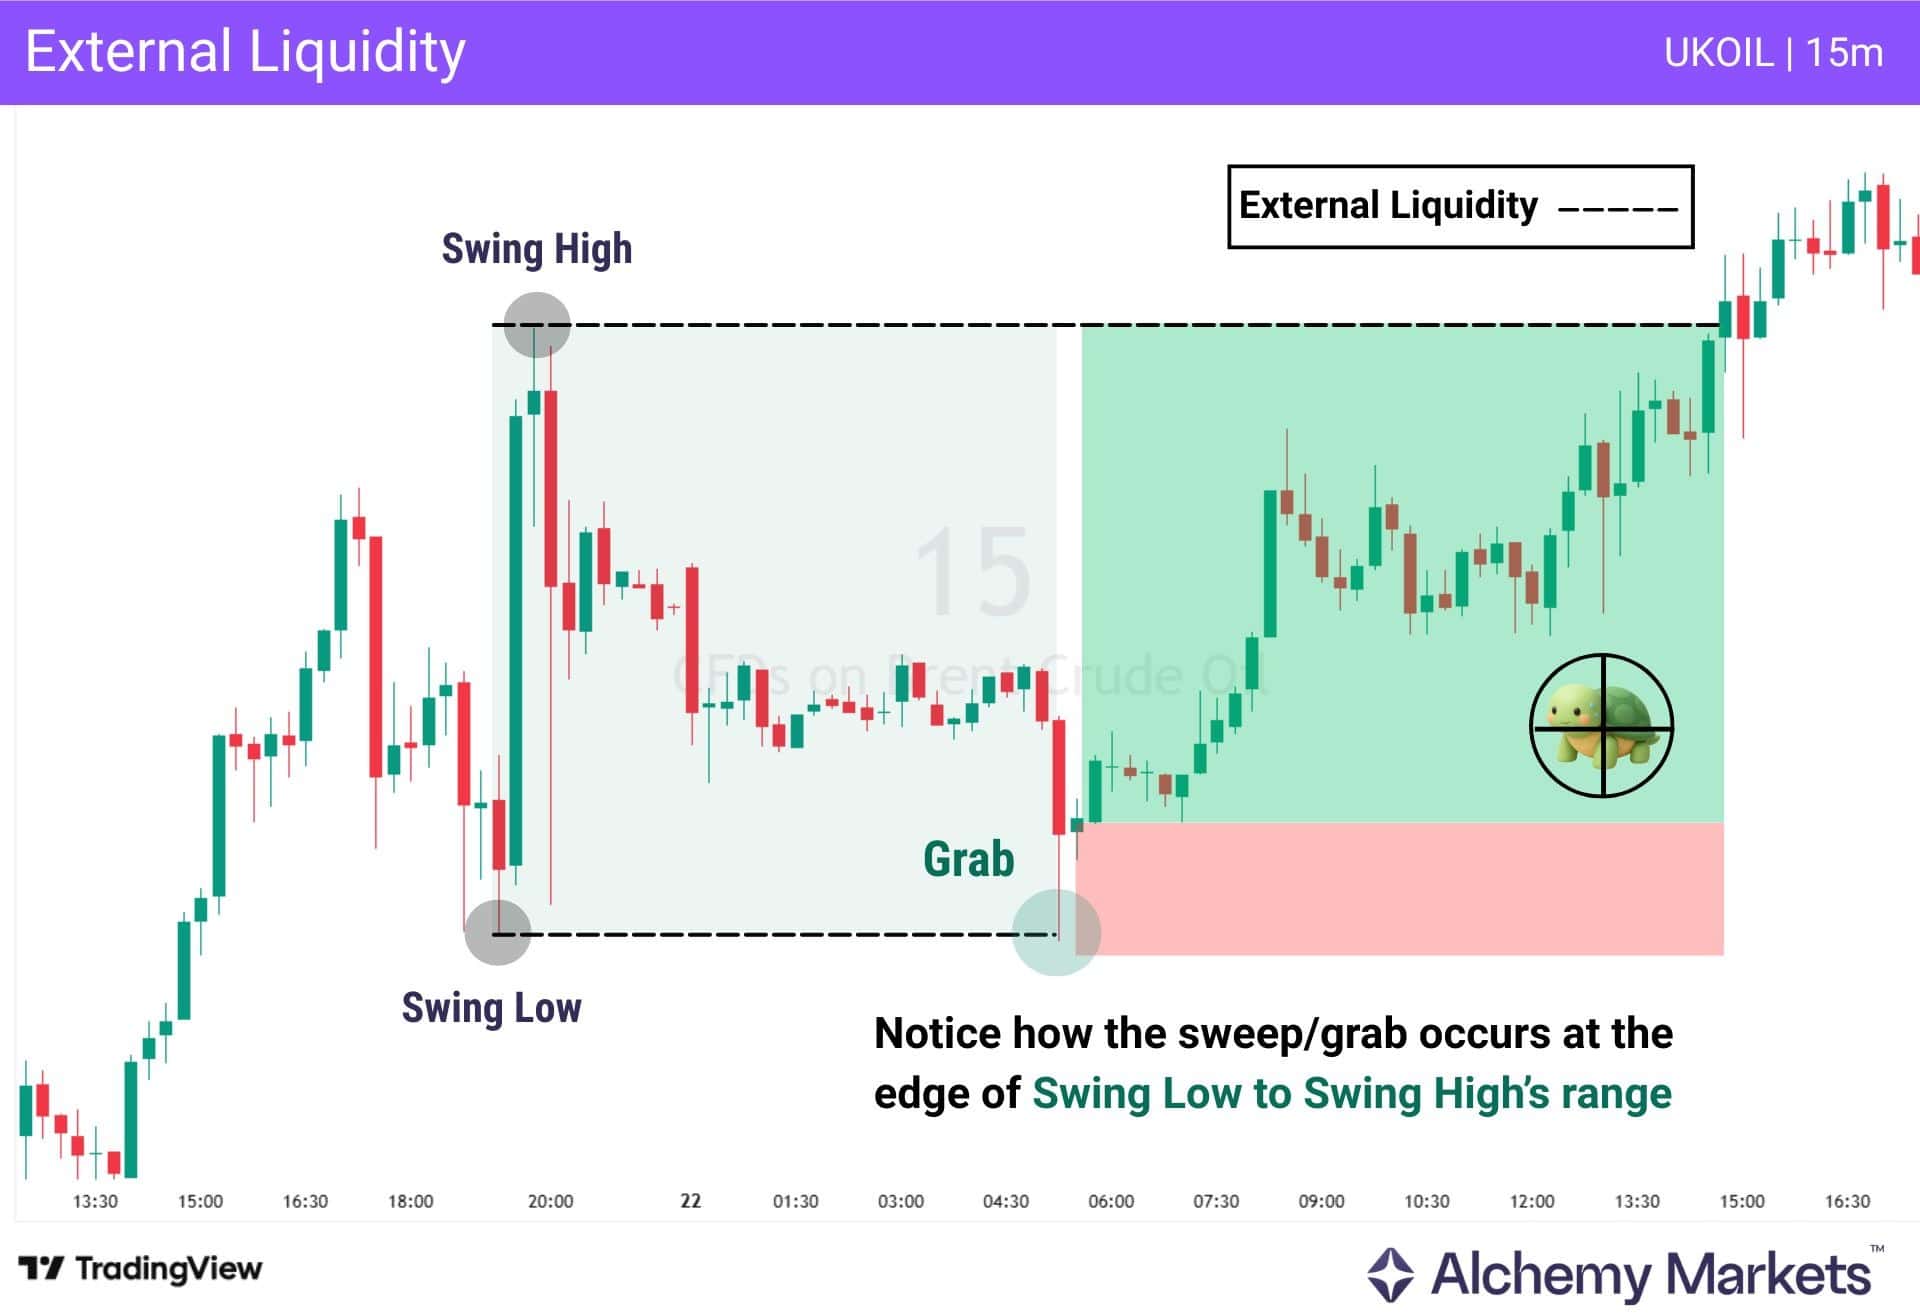
Unlike internal liquidity, which sits inside the range, external liquidity forms at the outer edges of the move and is therefore more effective for identifying major reaction points. When price sweeps or grabs liquidity at one of these boundaries and fails to continue, it can signal that the breakout has been rejected. This creates the basis for a Turtle Soup setup, especially when followed by confirmation on a lower timeframe.
As shown in the chart above, the sweep and grab occur at the edge of the broader swing range rather than inside it. That is what makes external liquidity the key area of interest for failed breakouts, reversals, and main trade targets, while internal liquidity can then be used as an intermediate target on the way to the opposite side of the range.
Order Blocks and Imbalances
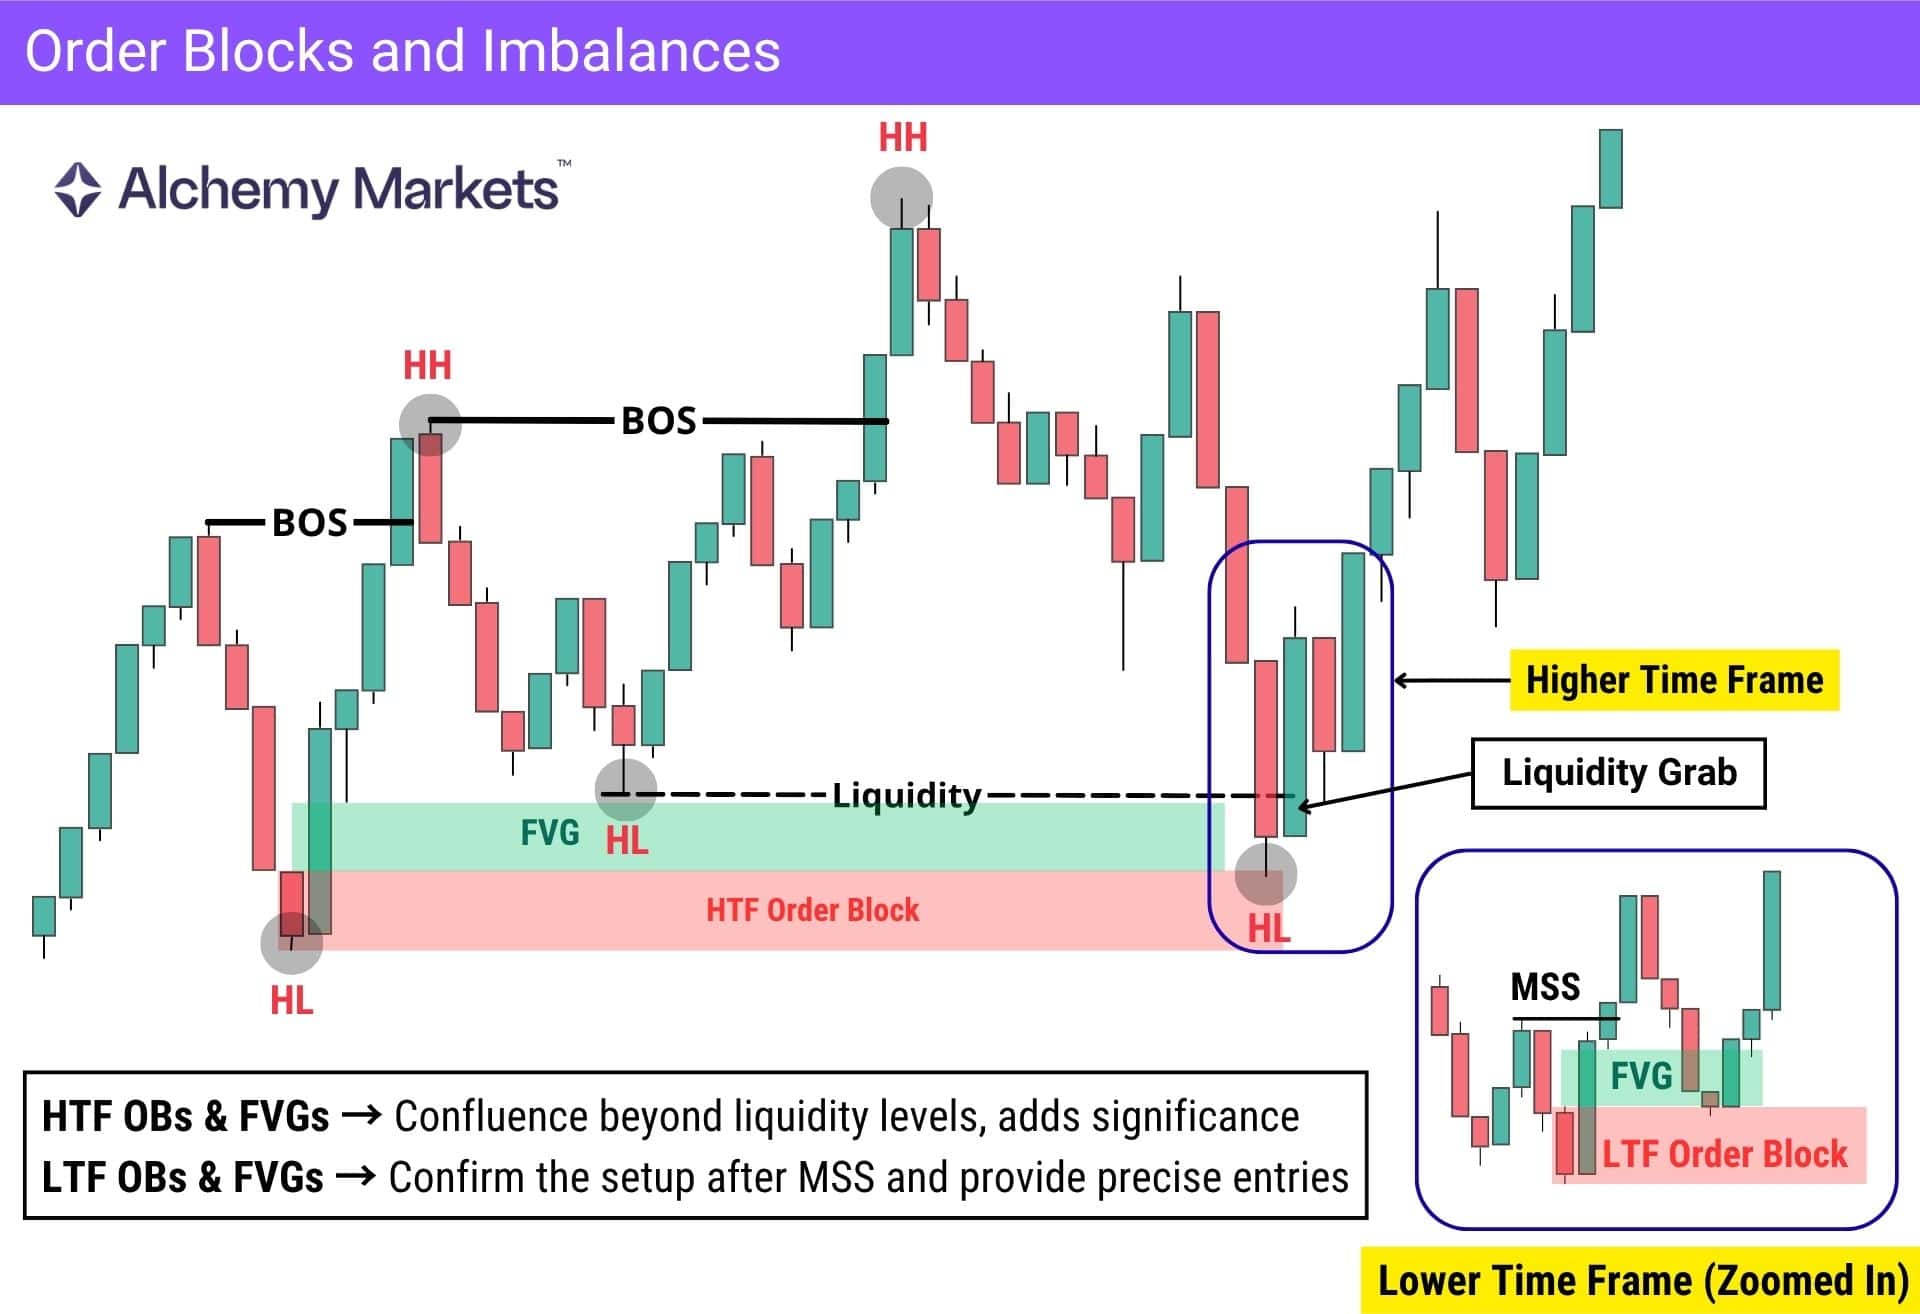
Order blocks and imbalances act as optional areas of confluence in Turtle Soup setups. They are higher timeframe points of interest where price previously moved with strong intent.
When these zones form beyond a swing high or low and price returns to them after a liquidity grab or sweep, they can increase the probability of a reversal. They are not required but can help confirm where price is more likely to react.
Bullish Order Blocks
A bullish order block forms before a strong upward move and represents the last selling pressure before buyers take control. It can add confluence to Turtle Soup setups.
It is most useful in a macro bullish trend. After price sweeps liquidity below a swing low, traders can look for long opportunities if price reacts from a bullish order block located beyond the level.
On lower timeframes, it can be used to refine entries after an MSS.
Bearish Order Blocks
A bearish order block works opposite to a bullish order block. It forms from the last bullish candle before a strong downward move.
When combined with Turtle Soup, it can add confluence to the setup by waiting for price to sweep liquidity above a swing high and react to a bearish order block located beyond it.
On lower timeframes, it can be used for entries after an MSS.
Fair Value Gaps (FVGs) / Imbalances
A fair value gap (FVG) forms during strong displacement, where price moves quickly and leaves an imbalance between buyers and sellers. This ‘gap’ usually acts as a ‘hidden’ area of interest, so when price revisits these zones, it has the potential to pivot sharply away.
In Turtle Soup setups, FVGs can act as optional areas of confluence when they form beyond a liquidity level. When price returns to these areas after a liquidity sweep, they increase the probability of a reaction.
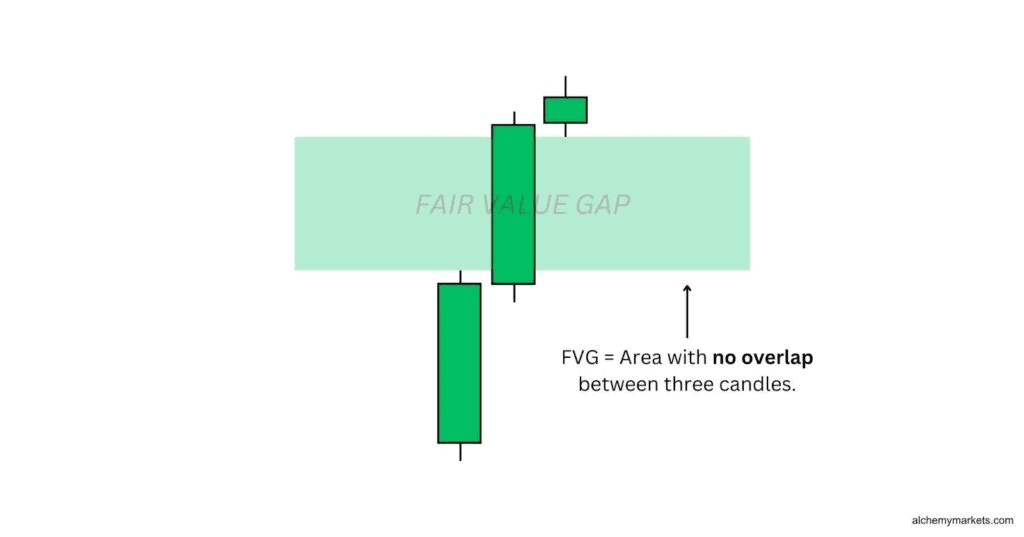
FVGs serve two roles in Turtle Soup setups:
- On higher timeframes, they reinforce the setup where price may react
- On lower timeframes, they help refine precise entries after confirmation
As shown in the chart below, FVGs can be used as confluence for considering trade opportunities after price sweeps liquidity (1), and as entry areas (2):
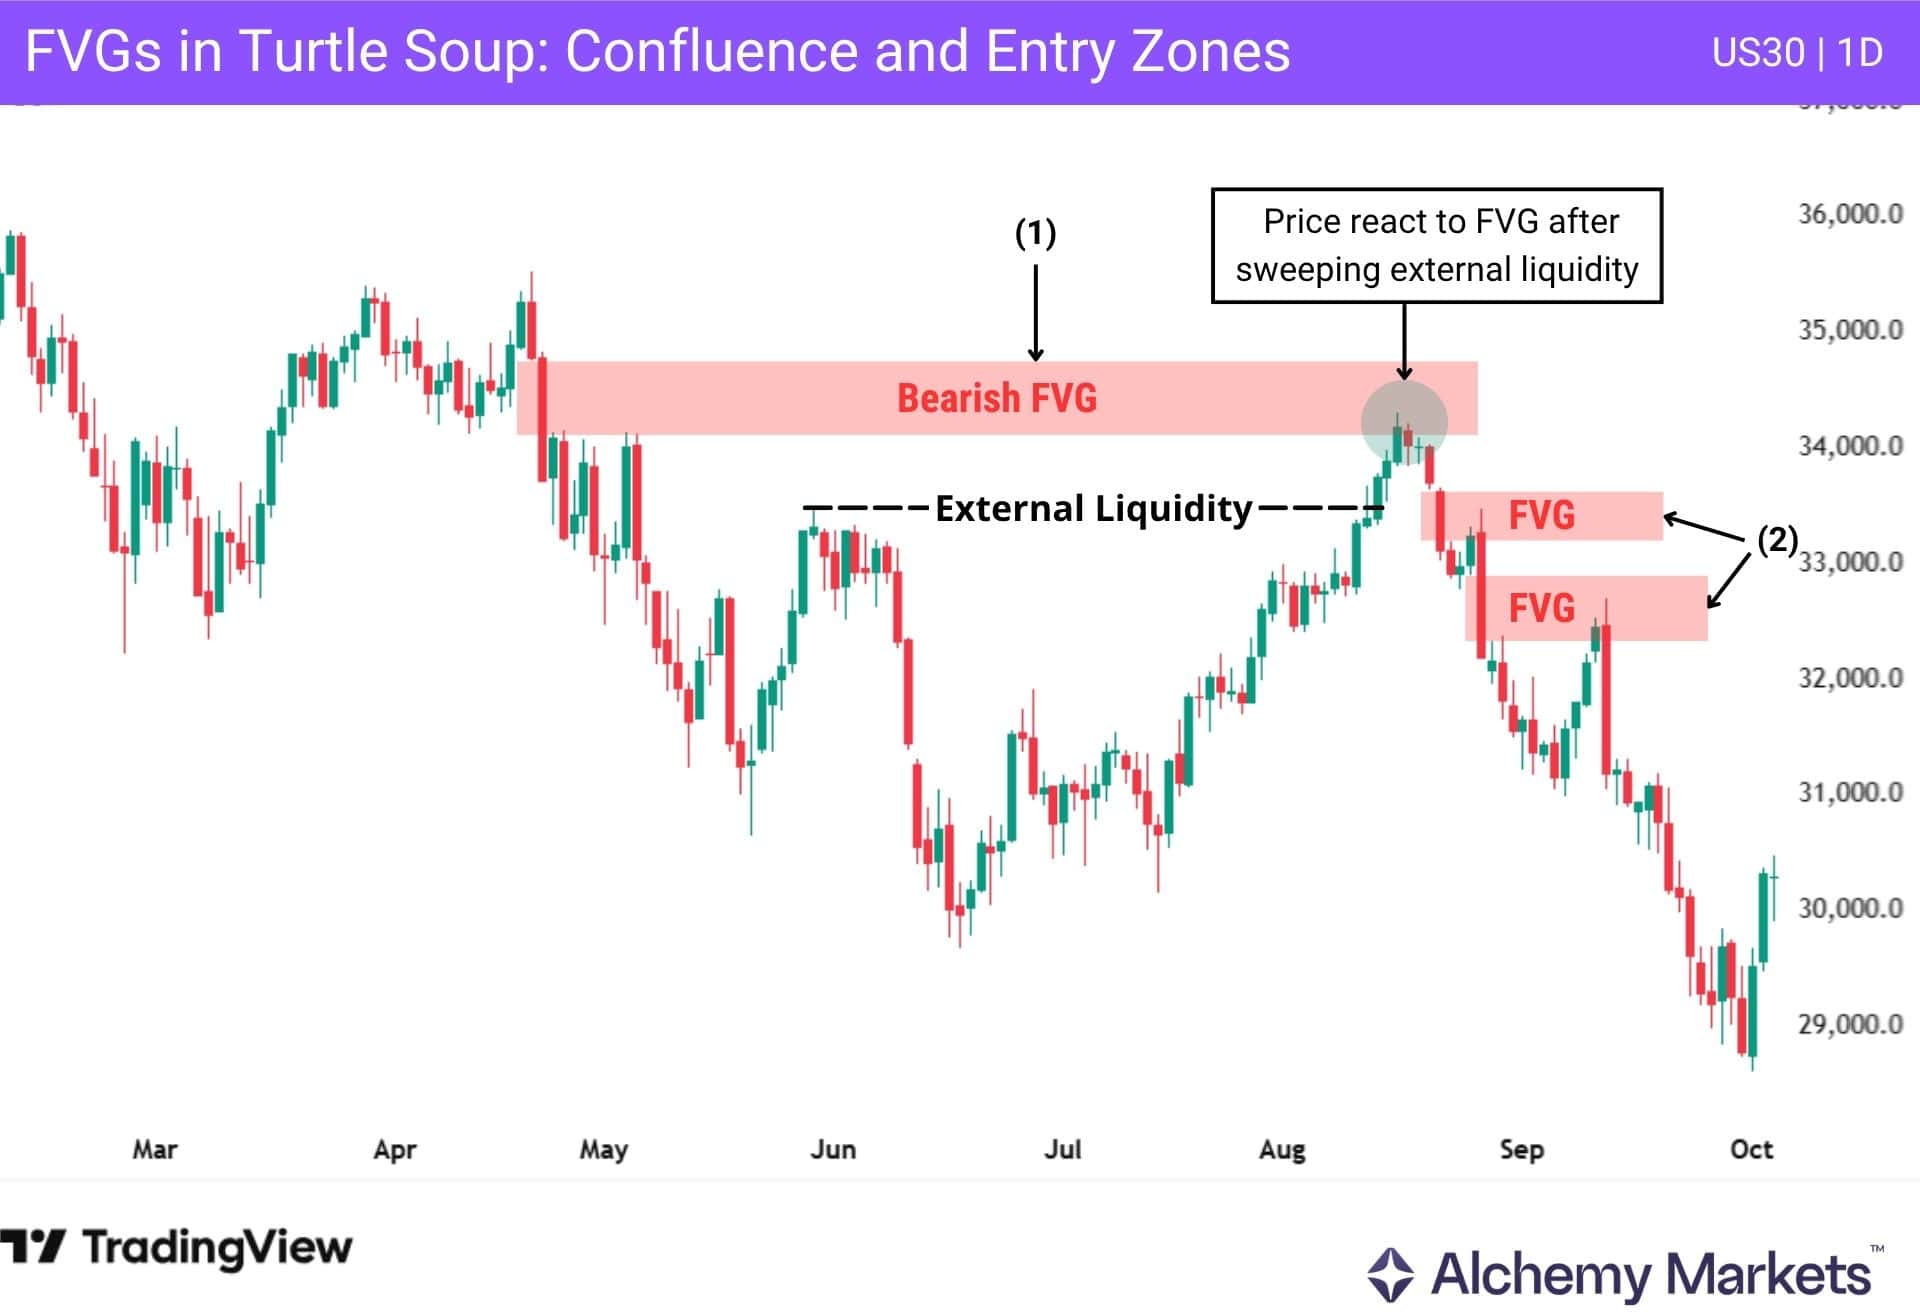
At this stage, the setup comes together: price sweeps liquidity, reacts at a higher timeframe order block (OB) or fair value gap (FVG), and the lower timeframe provides confirmation for entry.
How Does Turtle Soup Trading Work?
The turtle soup trading strategy follows a structured process based on liquidity, behaviour, and confirmation. Instead of predicting direction, it focuses on how price reacts around key levels and what that reaction reveals.
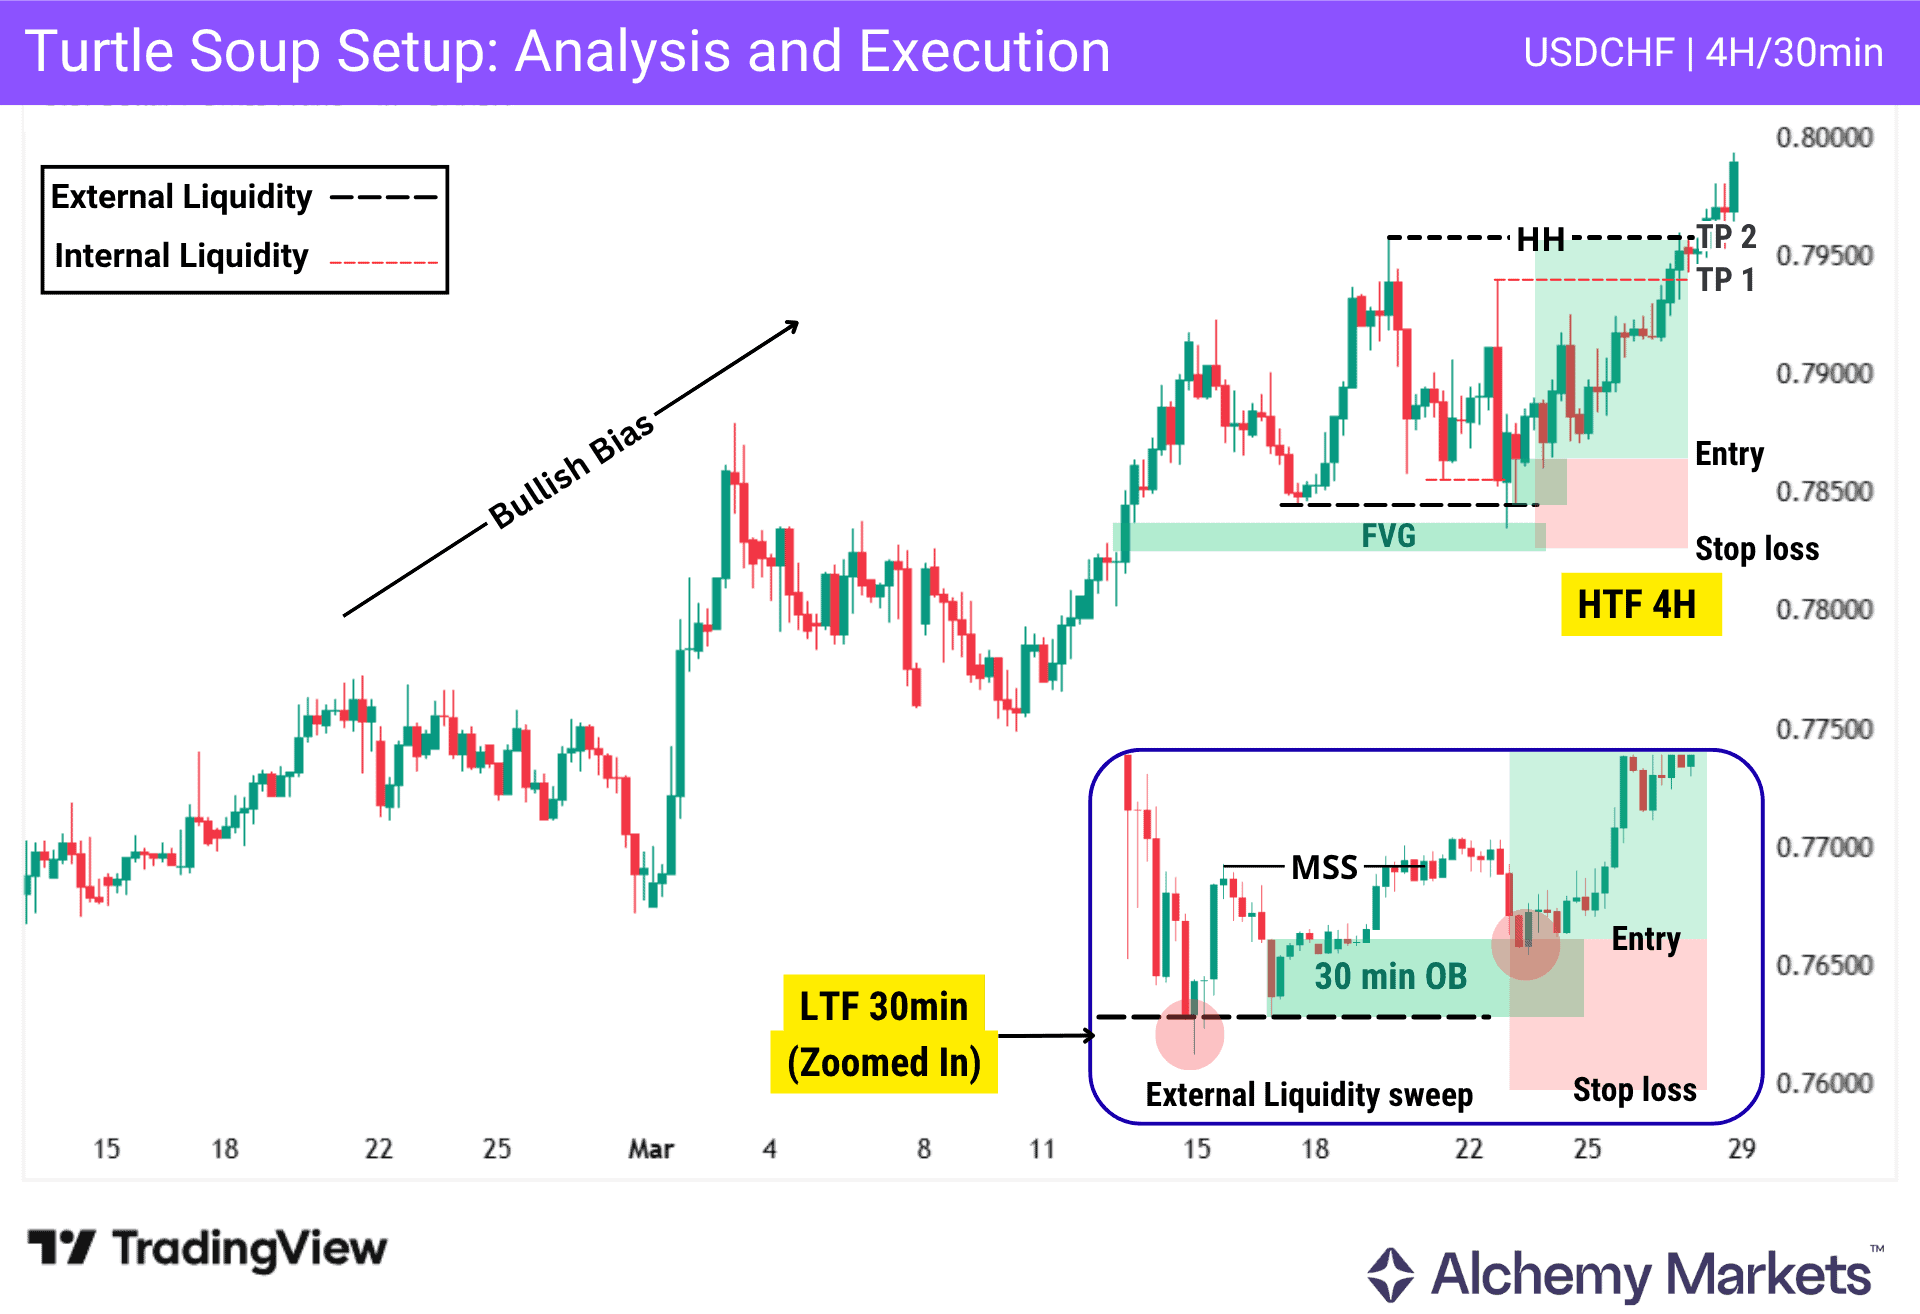
Let’s take a look at this USDCHF example to show how turtle soup works in real market conditions:
Establishing a Bias
The first step is to define the higher timeframe structure.
In a bullish structure, price forms higher highs (HH) and higher lows (HL), confirmed by breaks of structure (BOS). In a bearish structure, price forms lower highs (LH) and lower lows (LL).
This defines directional intent:
- Bullish → look for buying opportunities at sell-side liquidity
- Bearish → look for selling opportunities at buy-side liquidity
In this chart above price is bullish, making sell-side liquidity below the lows the key area of interest.
Identifying Internal Liquidity
Once the bias is established, the next step is to identify external liquidity, which acts as the main area of interest. Next, wait for price to sweep external liquidity, then look for internal liquidity.
Internal liquidity consists of smaller highs and lows within the structure and helps explain how price moves in more detail. It can be useful for identifying MSS and targets.
Looking for Liquidity Taps
The core of the setup begins when price interacts with external liquidity.
A liquidity sweep occurs when price moves beyond a key level, triggering stop-loss orders and appearing as a breakout.
In a valid Turtle Soup setup:
- Price breaks the level
- Liquidity is taken
- The move fails to continue
In this example, price sweeps sell-side liquidity below the low, setting the conditions for a potential reversal.
Lower Timeframe Confirmation
After the sweep, confirmation is required on a lower timeframe.
This occurs when price forms a market structure shift (MSS), signalling a change in momentum.
In this example, after the sweep on the 4H timeframe, price forms a clear MSS on the 30-minute chart, confirming the setup.
Executing the Trade
Once confirmation is in place, execution focuses on entry, stop loss, and targets.
Entry approaches include:
- Immediate entry after MSS
- Entry from a lower timeframe FVG or order block
- Using Fibonacci retracement
For stop losses:
- Placed below/above recent swing points
- Or beyond key structural levels for added safety
For targets:
- Internal liquidity → intermediate targets
- External liquidity → final target
In this example:
- Entry is taken after MSS from a lower timeframe zone (FVG or OB)
- Stop loss is placed below the recent low
- Targets are set at internal and external liquidity
What Does a Turtle Soup Trading Tell You
The turtle soup trading strategy reveals how the market behaves around liquidity and how traders are positioned.
When a breakout occurs, it creates the expectation of continuation. This attracts breakout traders while triggering stop-loss orders from those on the opposite side.
This behaviour is directly linked to two key types of liquidity:
- Buy-side liquidity → resting above highs, where breakout buyers enter and sellers place stop losses
- Sell-side liquidity → resting below lows, where breakout sellers enter and buyers place stop losses
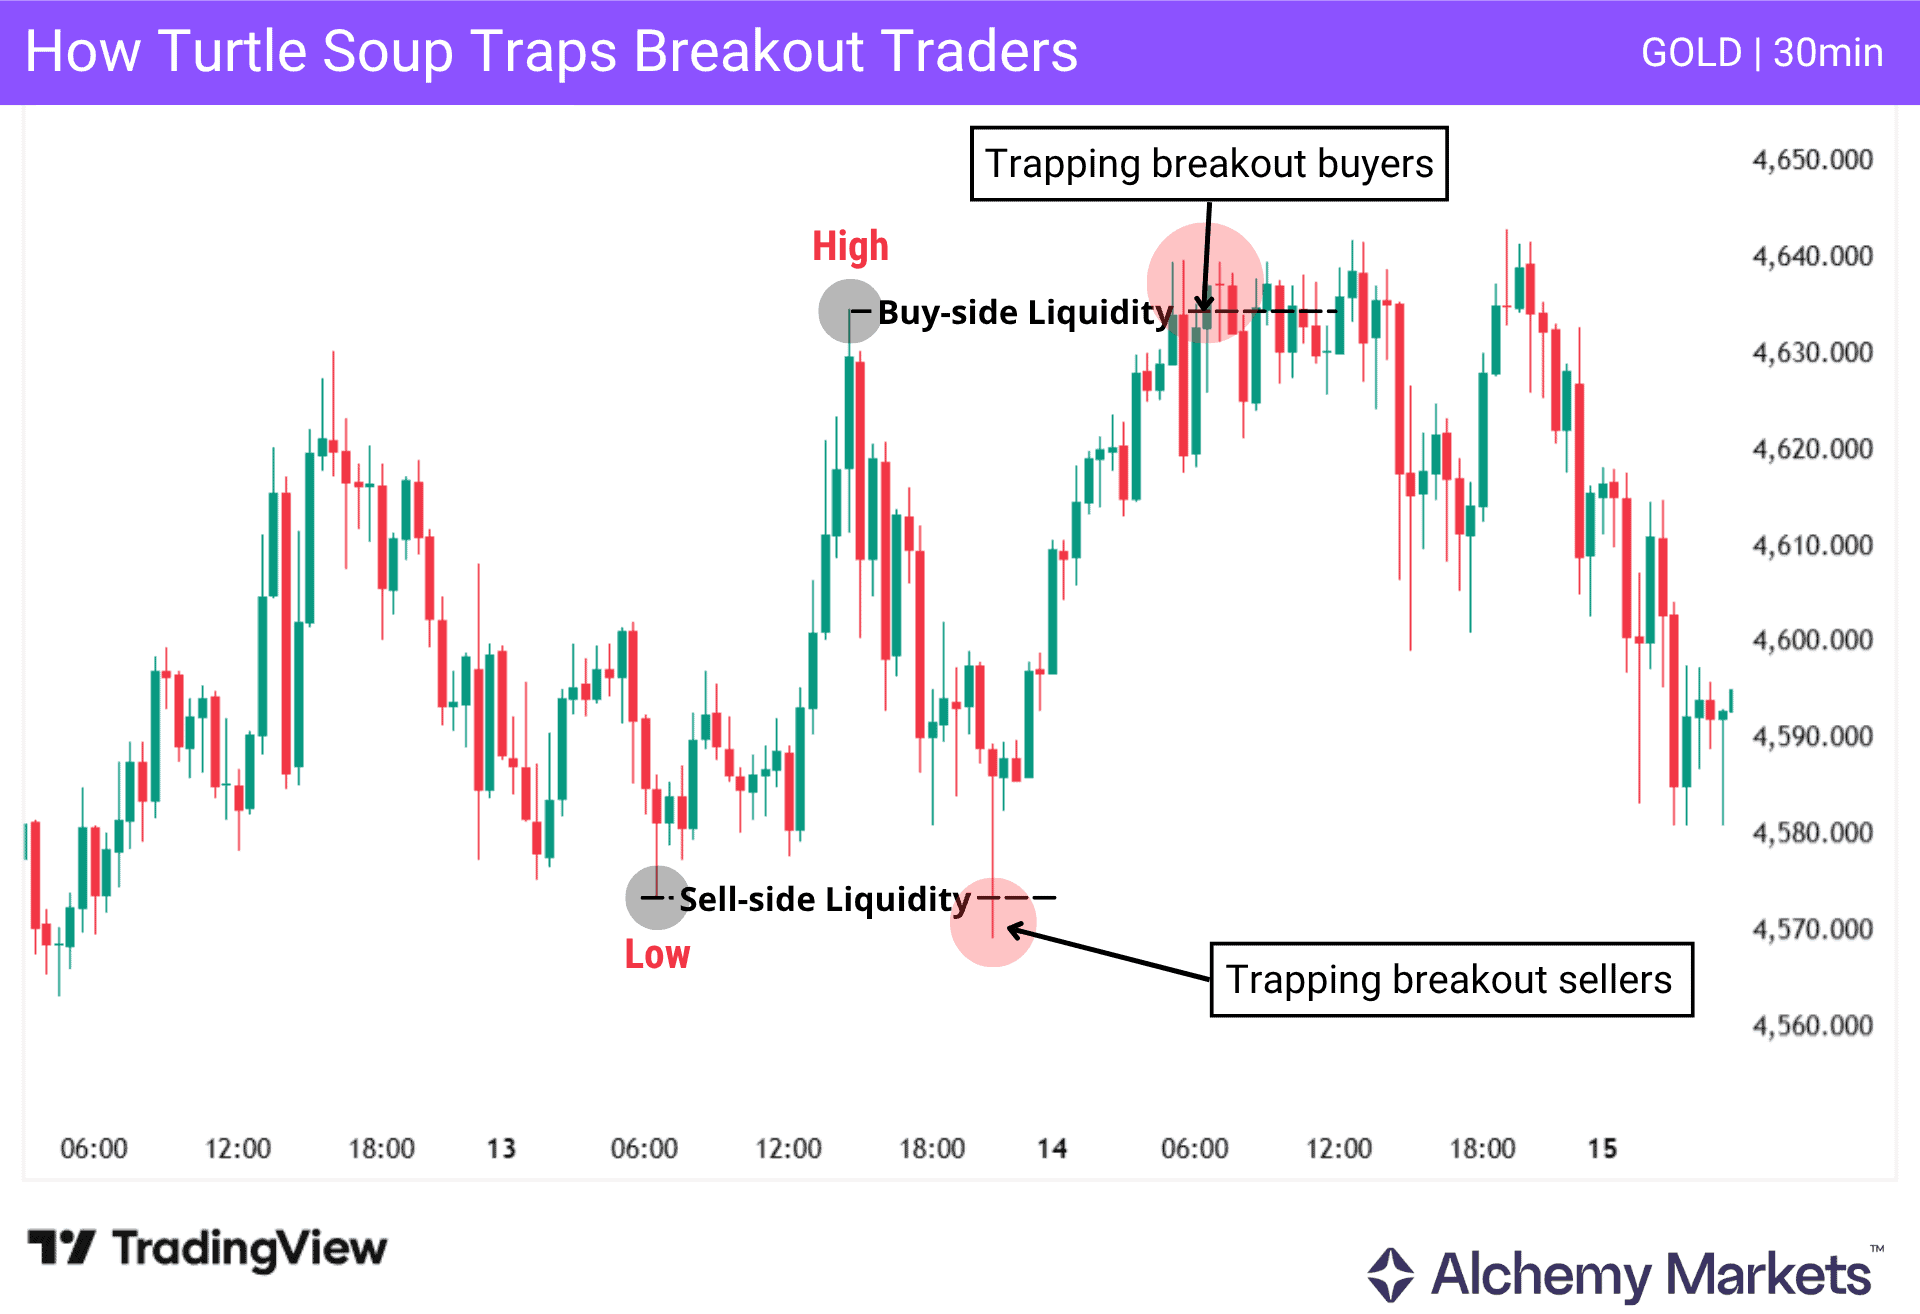
When the breakout fails, it shows that liquidity has been taken, the move lacks continuation, and price may reverse. This reflects a key principle: price moves to target liquidity and rebalance positions between buyers and sellers.
A failed breakout is not simply a mistake by traders, but part of how the market operates. Instead of following the breakout, traders can position against it, using liquidity as a guide.
At higher timeframe levels, reactions around external liquidity provide context. When price reaches these levels and reacts, it may suggest the pullback is complete.
However, this behaviour is not guaranteed. Price may still break through the level, leading to a deeper move or a change in structure. For this reason, reactions at external liquidity should be viewed as potential, not confirmation. Confirmation still requires clear structural behaviour, especially on lower timeframes.
Key takeaways:
- Failed breakouts often signal liquidity-driven reversals
- External liquidity acts as a key reference point
- Lower timeframe confirmation is required before entry
- Stop loss placement and proper risk management are essential to protect against losses
How ICT Refines Turtle Soup
The original Turtle Soup strategy, developed by Linda Raschke, focuses on failed breakouts and reversals around specific levels, particularly new 20-day highs and lows. It uses price action for confirmation and execution around these levels.
The ICT framework approaches the same concept through a liquidity-based perspective, using different types of confirmation to refine execution.
Key elements include:
- The use of market structure swing points
- The use of market structure shift (MSS) as confirmation
- Multi-timeframe analysis for context
- Entry refinement using order blocks and fair value gaps
These elements do not replace the original concept, but provide an additional way to refine Turtle Soup setups
One key difference is the emphasis on confirmation. Instead of entering immediately after a failed breakout, this approach focuses on waiting for clear structural signals.
It also highlights timeframe alignment, where the higher timeframe provides context and the lower timeframe is used for confirmation and precision.
Additionally, not all liquidity sweeps lead to reversals. In some cases, price may continue in the same direction, reinforcing the need for confirmation rather than relying on the sweep alone.
Turtle Soup Trading Example
Now let’s look at how turtle soup setups form in real market conditions:
Bullish Example
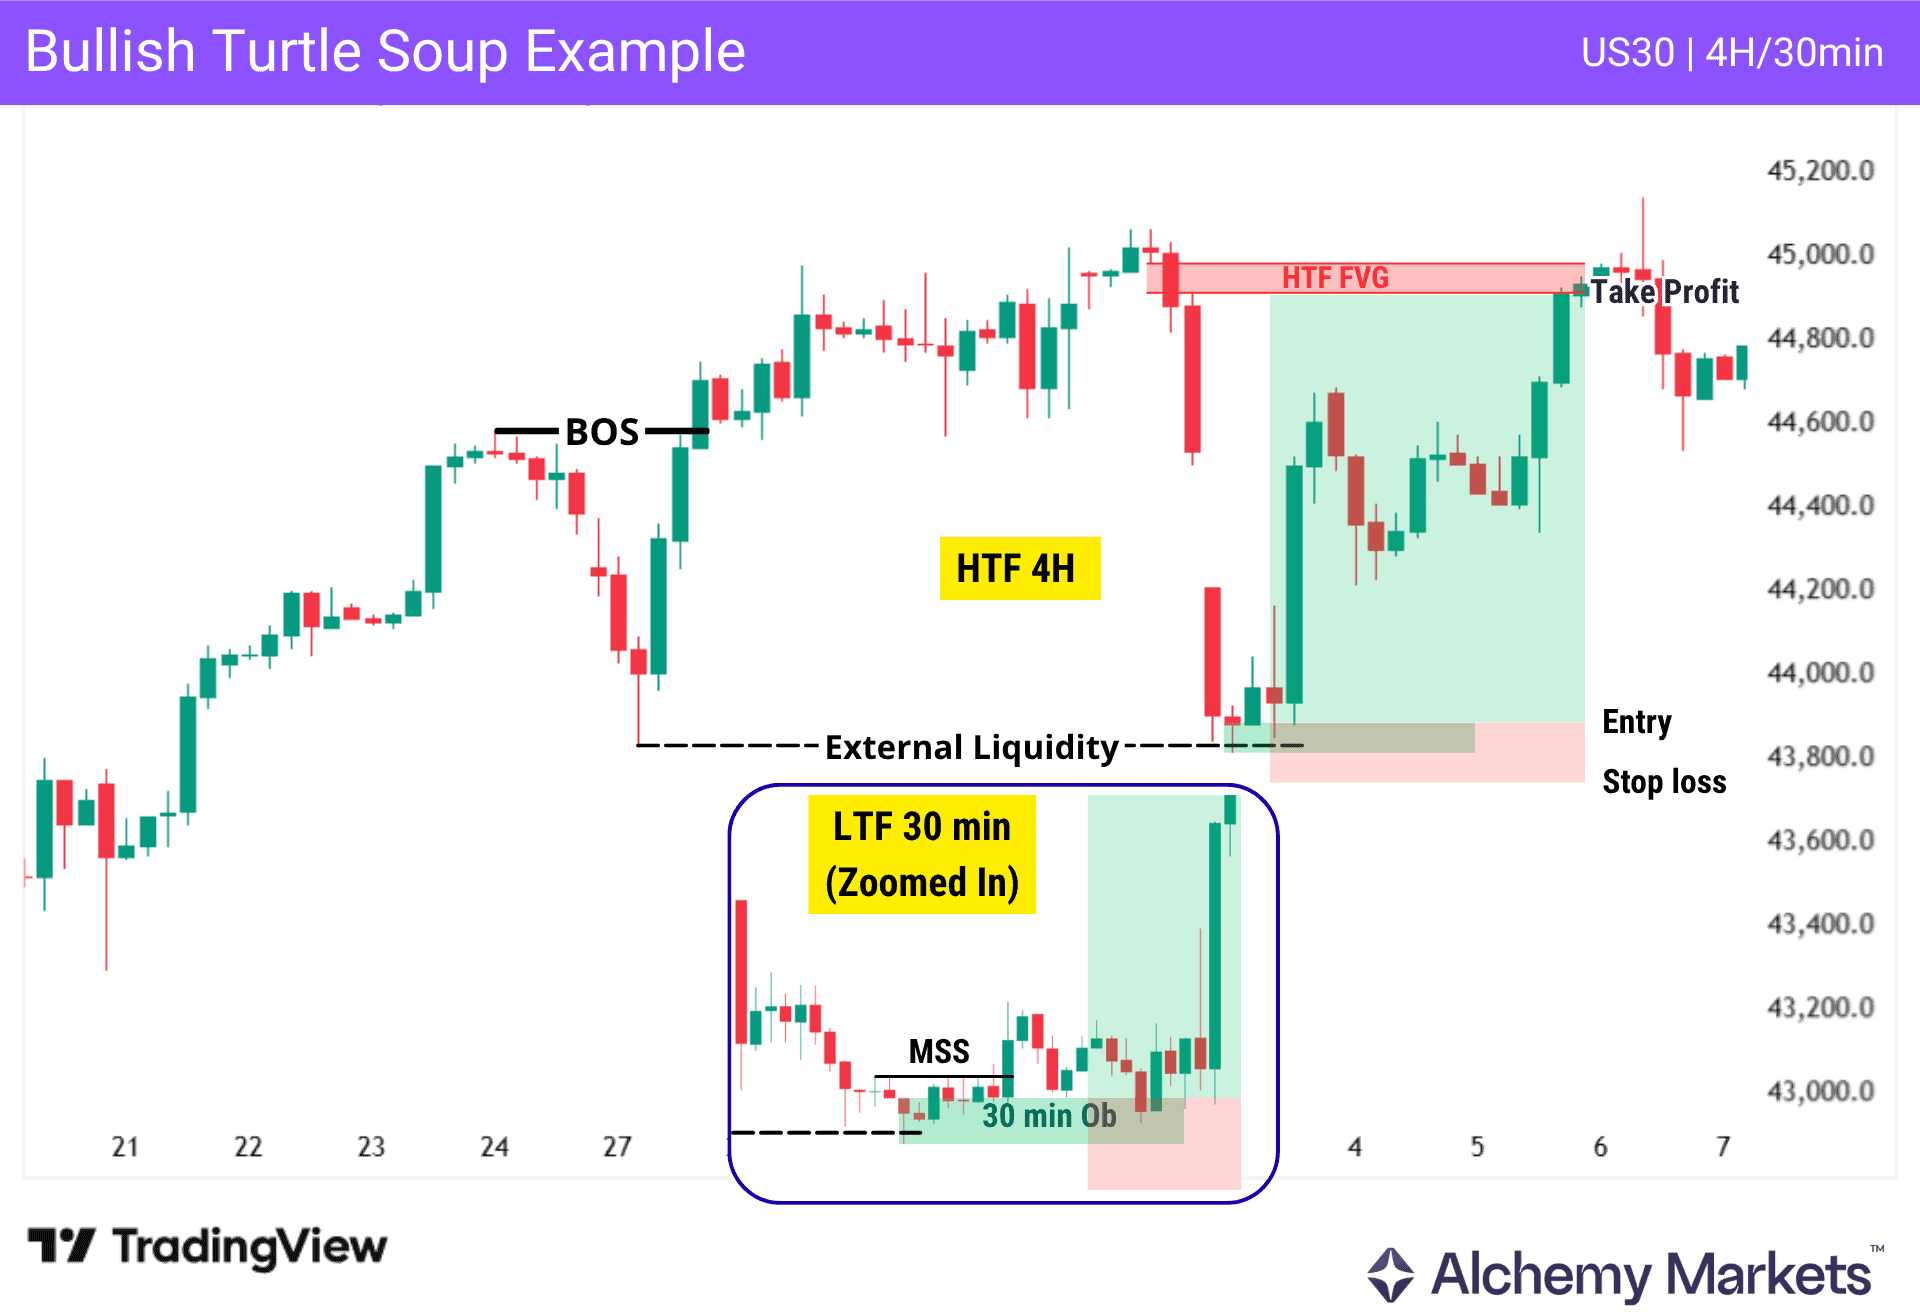
In this US30 4-hour chart, price breaks structure to the upside, leaving a swing low that acts as external liquidity. Price later moves below this level, sweeps the liquidity, and rejects, forming a strong bullish reaction.
However, the reaction alone is not enough to confirm the setup or define a precise entry.
To refine execution, we move to the lower timeframe.
On the 30-minute chart, price forms a market structure shift (MSS) to the upside and creates a bullish order block, providing a clear execution zone.
Entry is taken within the order block, with risk placed below it, and targets aligned with the higher timeframe fair value gap.
Note: Multi-timeframe analysis improves clarity. The higher timeframe defines the level, while the lower timeframe confirms the shift and refines execution.
Tip (Stop Loss Placement): Use the full range of your entry zone (order block or FVG). Place the stop loss beyond the structure that validates the setup, not inside the zone.
Bearish Example
Now let’s look at EURUSD on the 2-hour timeframe.
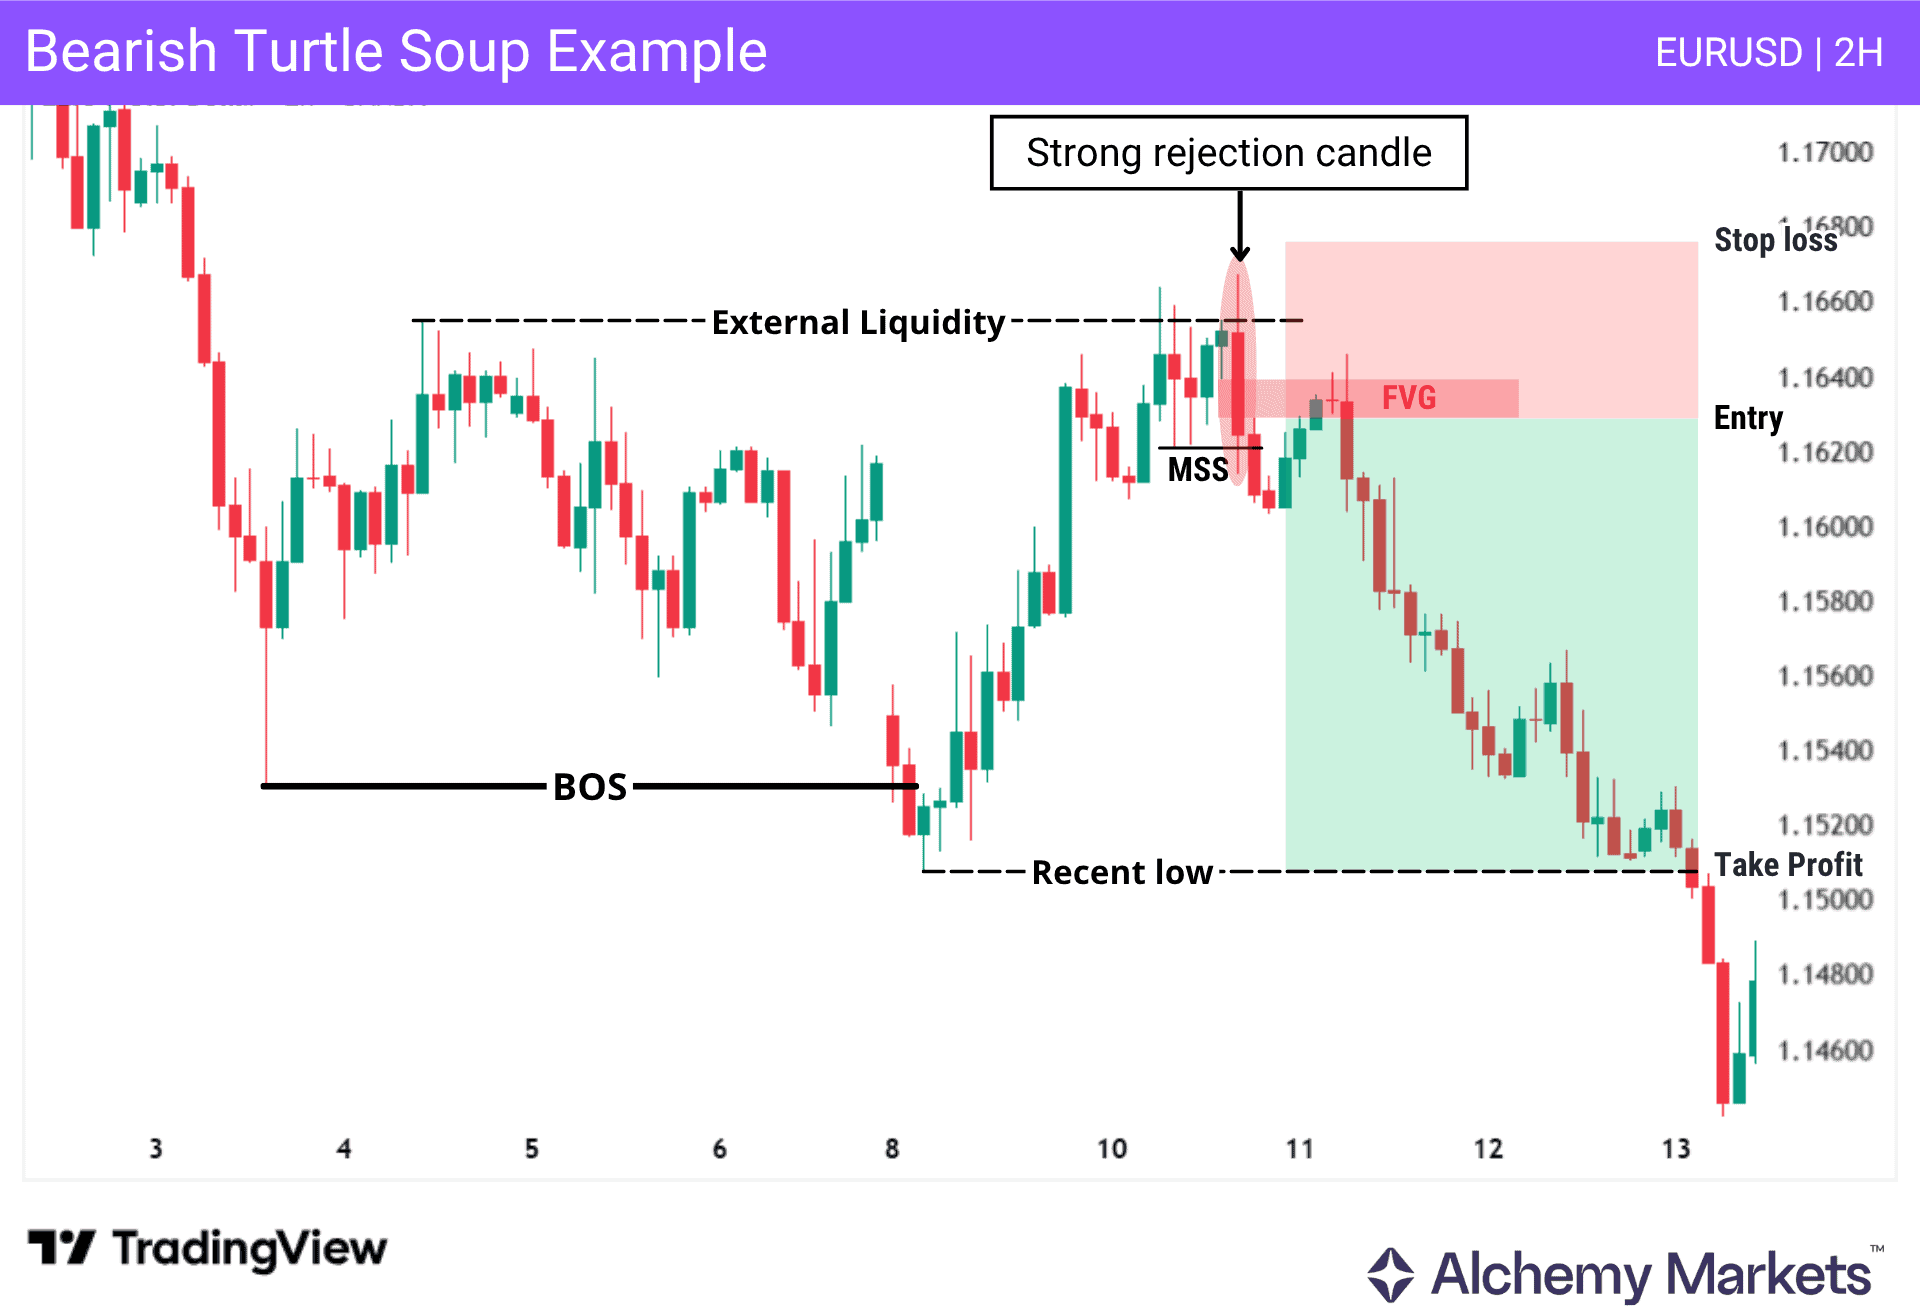
Price breaks structure to the downside, confirming a bearish environment and leaving external liquidity above the highs. Price then retraces into this level, sweeps the liquidity, and shows a strong rejection.
Following this move, a market structure shift (MSS) forms to the downside, confirming that the upward move has failed.
A bearish fair value gap forms during the displacement, providing a refined entry area. Short positions are taken from this zone, with targets aligned at the previous low.
Note: In some cases, confirmation and entry can occur on the same timeframe, especially when rejection is clear, displacement is strong, and price breaks a nearby internal liquidity level, forming an MSS. Lower timeframe refinement is not always required.
Internal liquidity Example
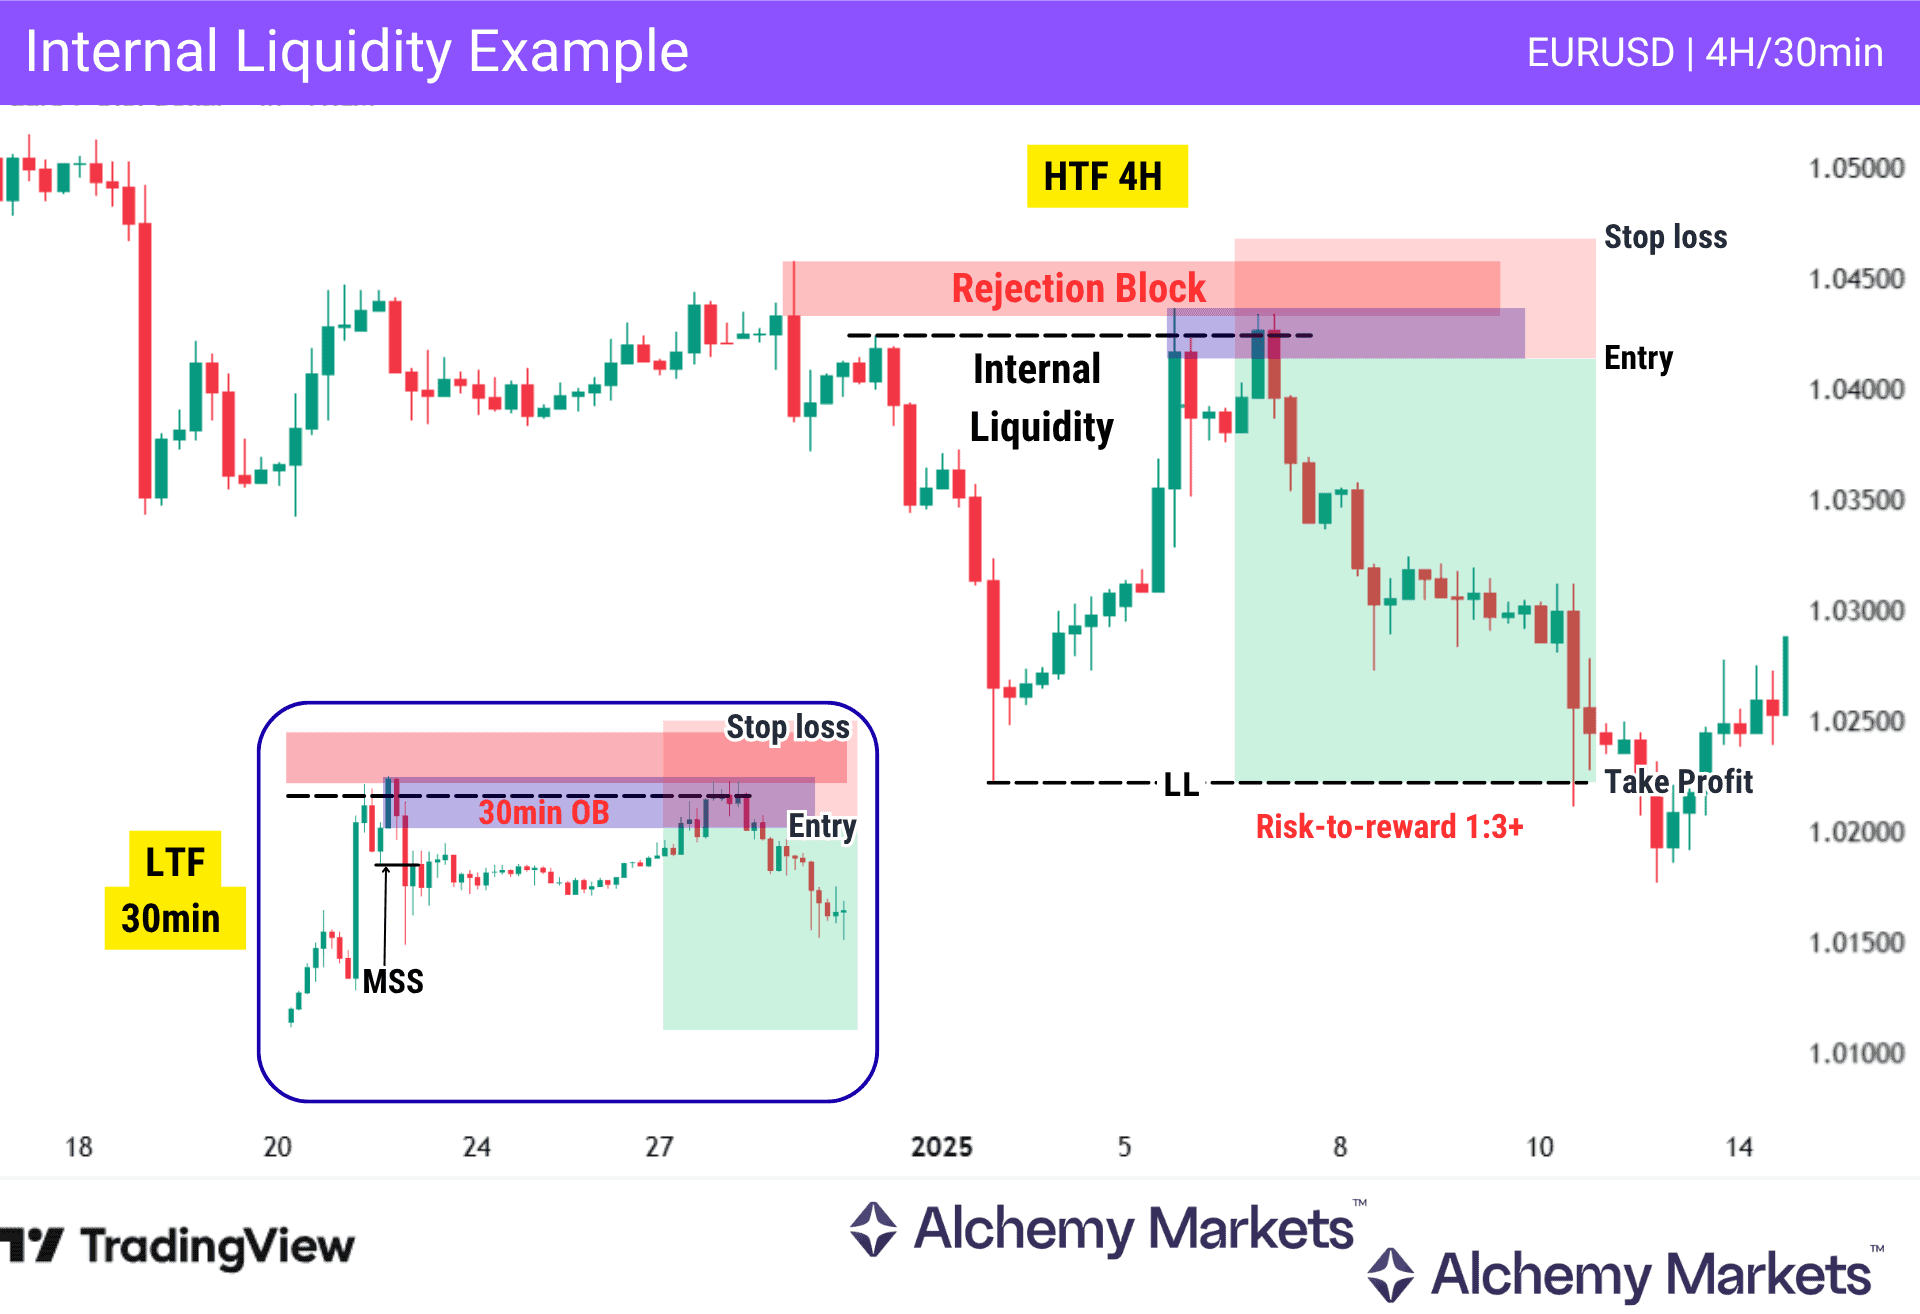
As shown in the chart above, price forms a bearish rejection block, with internal liquidity resting below it. Price later pulls back, sweeps the internal liquidity, and reacts from the bearish rejection block, which acts as confluence for the setup.
For entry, on the 30-minute lower timeframe, price forms a market structure shift (MSS) and a bearish order block that acts as the entry area.
Turtle Soup Trading Trading Strategies
Turtle Soup Strategy Rules
The Turtle Soup strategy follows a structured process built around liquidity, market behaviour, and confirmation.
Rather than predicting direction, it focuses on how price reacts at key liquidity levels and what that reaction reveals.
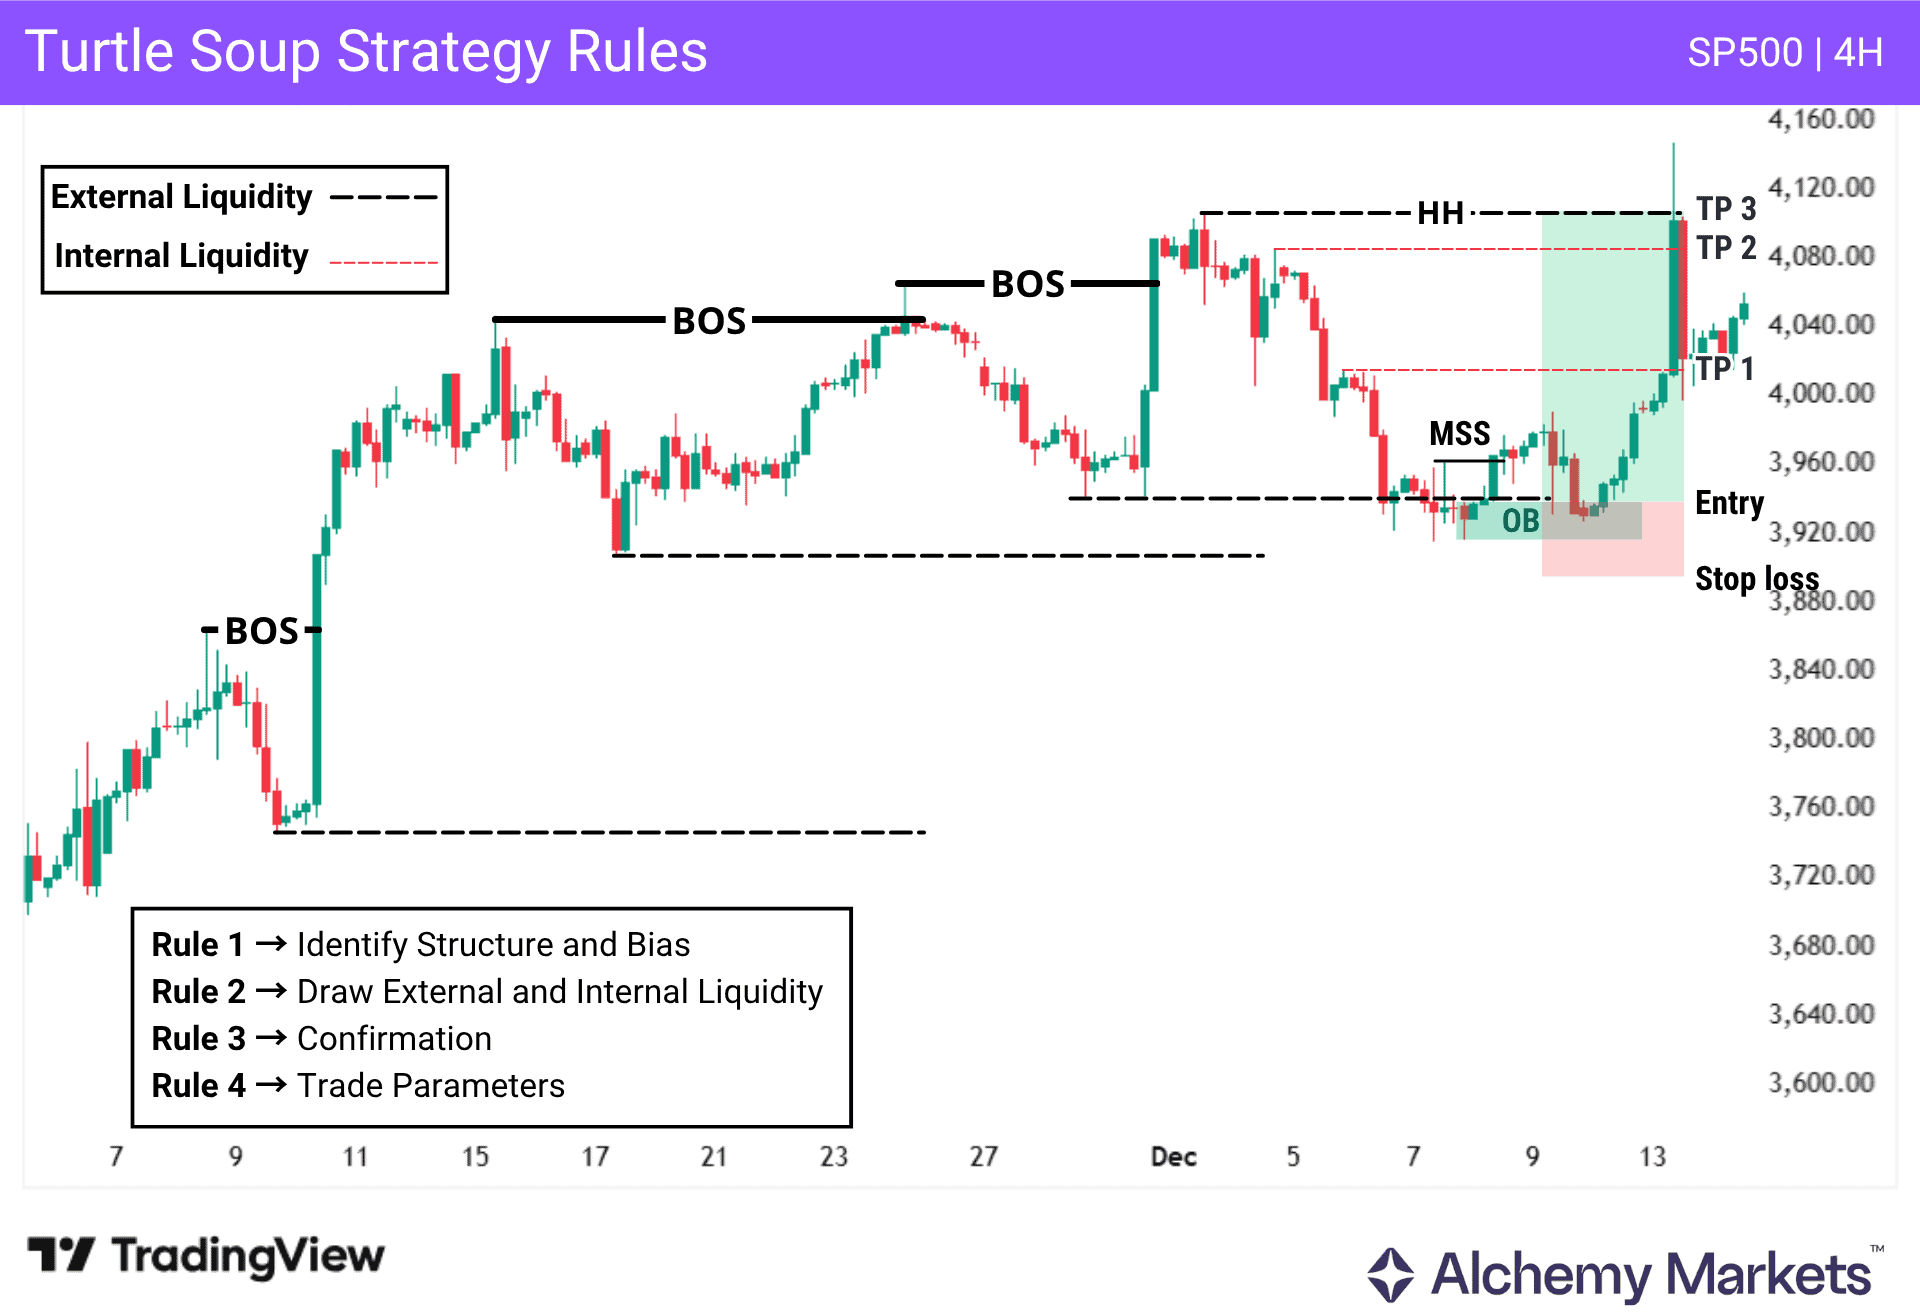
Rule 1: Identify Structure and Bias
Start by identifying the current market structure.
- Higher highs and higher lows indicate a bullish bias
- Lower highs and lower lows indicate a bearish bias
Align your setup direction with the prevailing trend.
Rule 2: Draw External and Internal Liquidity
Mark key swing highs and lows as liquidity levels.
These act as primary points of interest, as price often moves toward them to take liquidity.
Once identified, align liquidity with the current structure:
- Bullish structure → focus on buy setups at sell-side liquidity
- Bearish structure → focus on sell setups at buy-side liquidity
After liquidity is taken, internal levels within the structure can act as intermediate targets.
Rule 3: Confirmation and Entry
Wait for price to sweep liquidity and show rejection.
A valid Turtle Soup setup requires a market structure shift (MSS) in the opposite direction.
After confirmation, look for entries on a pullback into areas such as:
- Order block
- Fair value gap
- Other points of interest formed after the shift
Lower timeframes can be used to refine confirmation and improve precision.
Rule 4: Trade Parameters
Once confirmation is established, execution becomes clear.
- Enter from the refined zone after the MSS
- Place the stop loss beyond the high or low formed by the liquidity sweep
- Use internal liquidity as initial targets
- Use the most recent high or low as the final target
Turtle Soup Trading with Bullish Reversals
A Turtle Soup bullish reversal forms when price sweeps sell-side liquidity below a key level and fails to continue lower. Instead, it reverses to the upside.
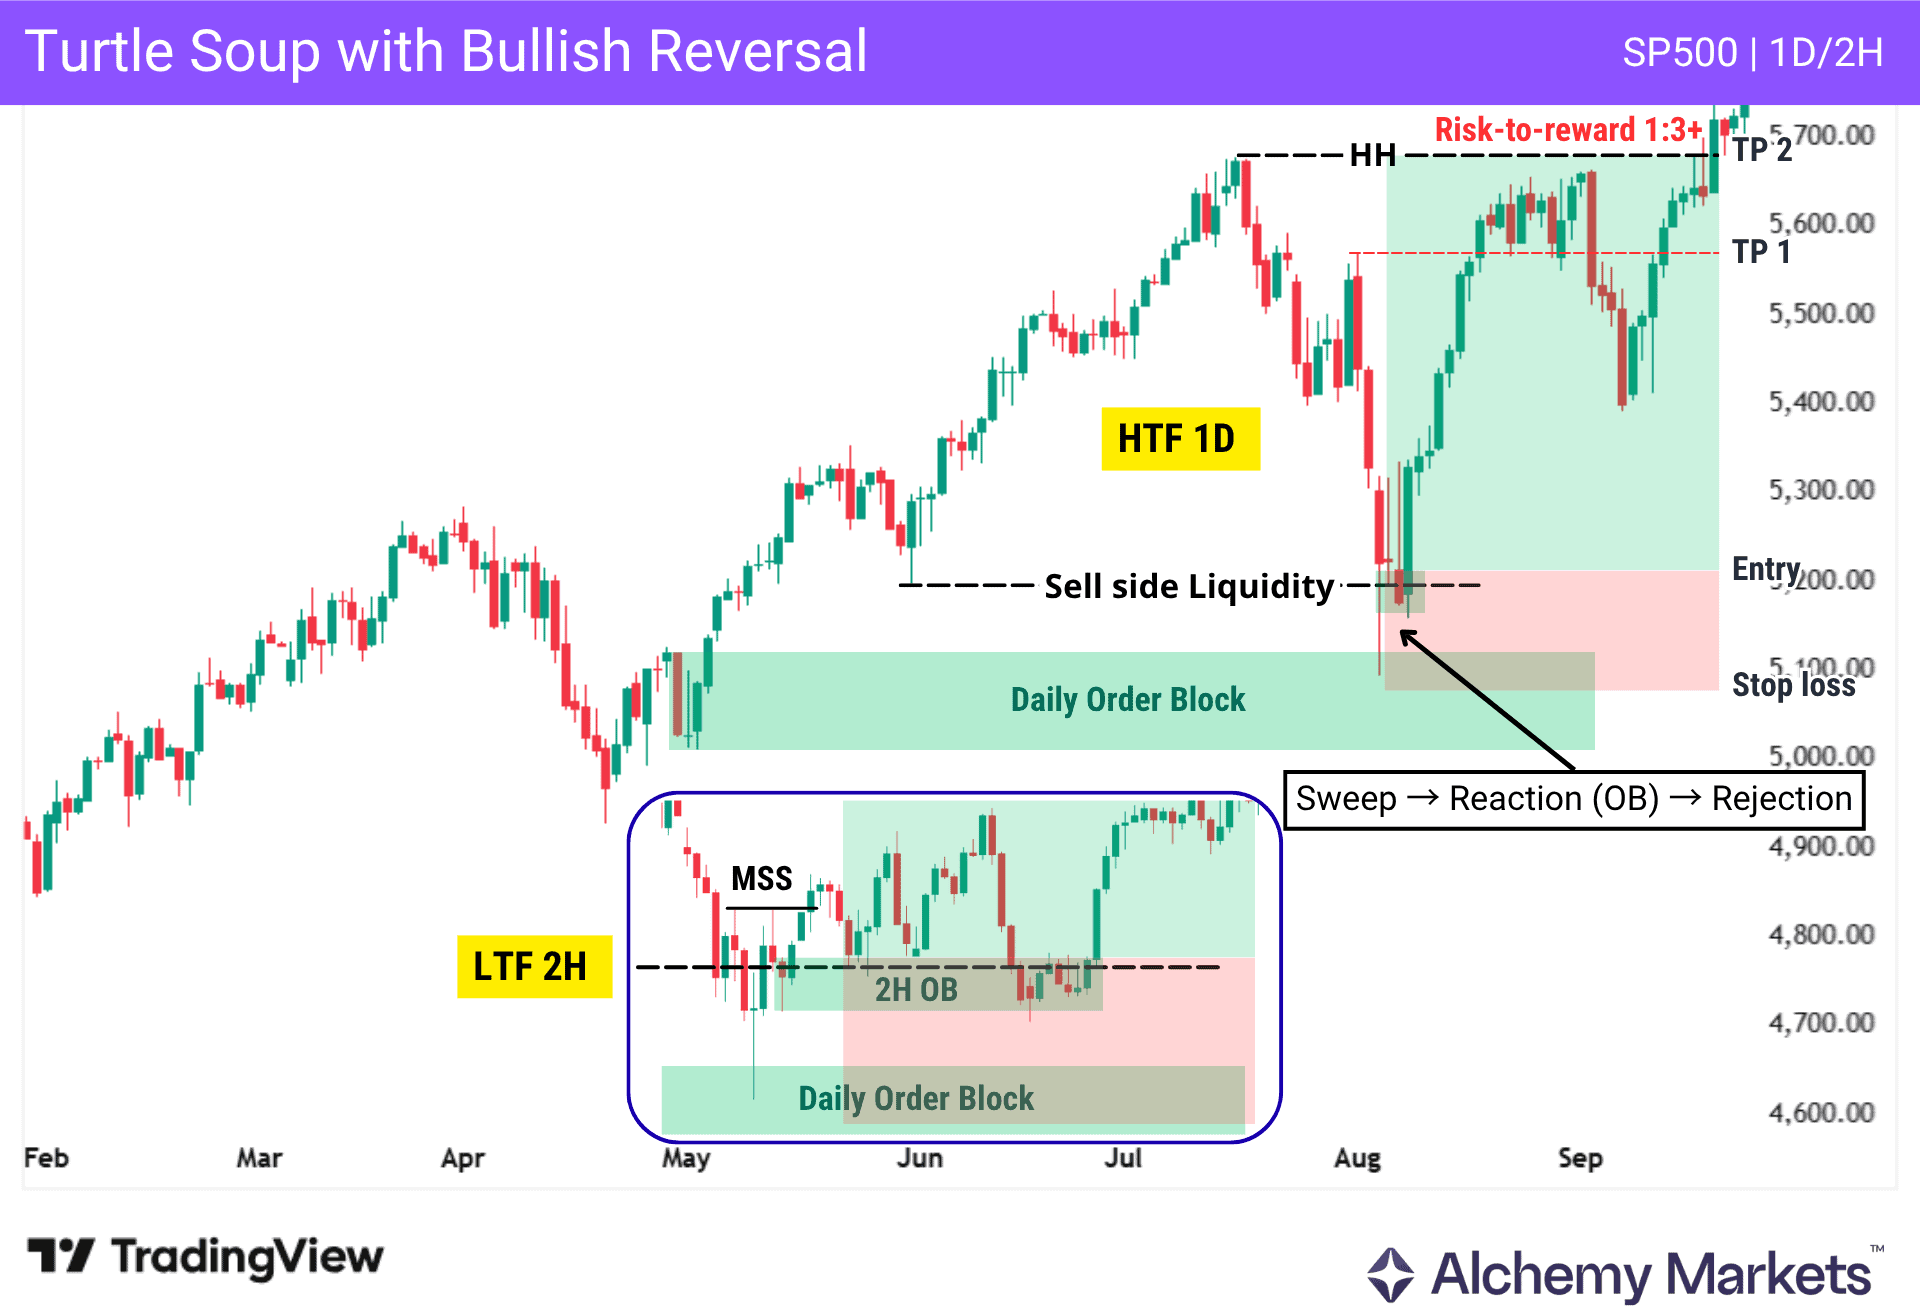
In this chart, the S&P 500 on the daily timeframe is in a bullish structure, forming higher highs and higher lows. The swing lows act as liquidity levels. Price drops below one of these levels, sweeps external liquidity, and reacts from a daily order block, adding confluence.
However, this alone does not provide a precise entry.
On the 2-hour timeframe, price forms a market structure shift (MSS) after the sweep, along with a clear order block. This creates a defined entry, with internal liquidity as the first target and the previous high as the final target.
Turtle Soup Trading with Bearish Reversals
A bearish Turtle Soup setup forms when price sweeps buy-side liquidity above a key high, fails to hold above it, and then reverses lower.
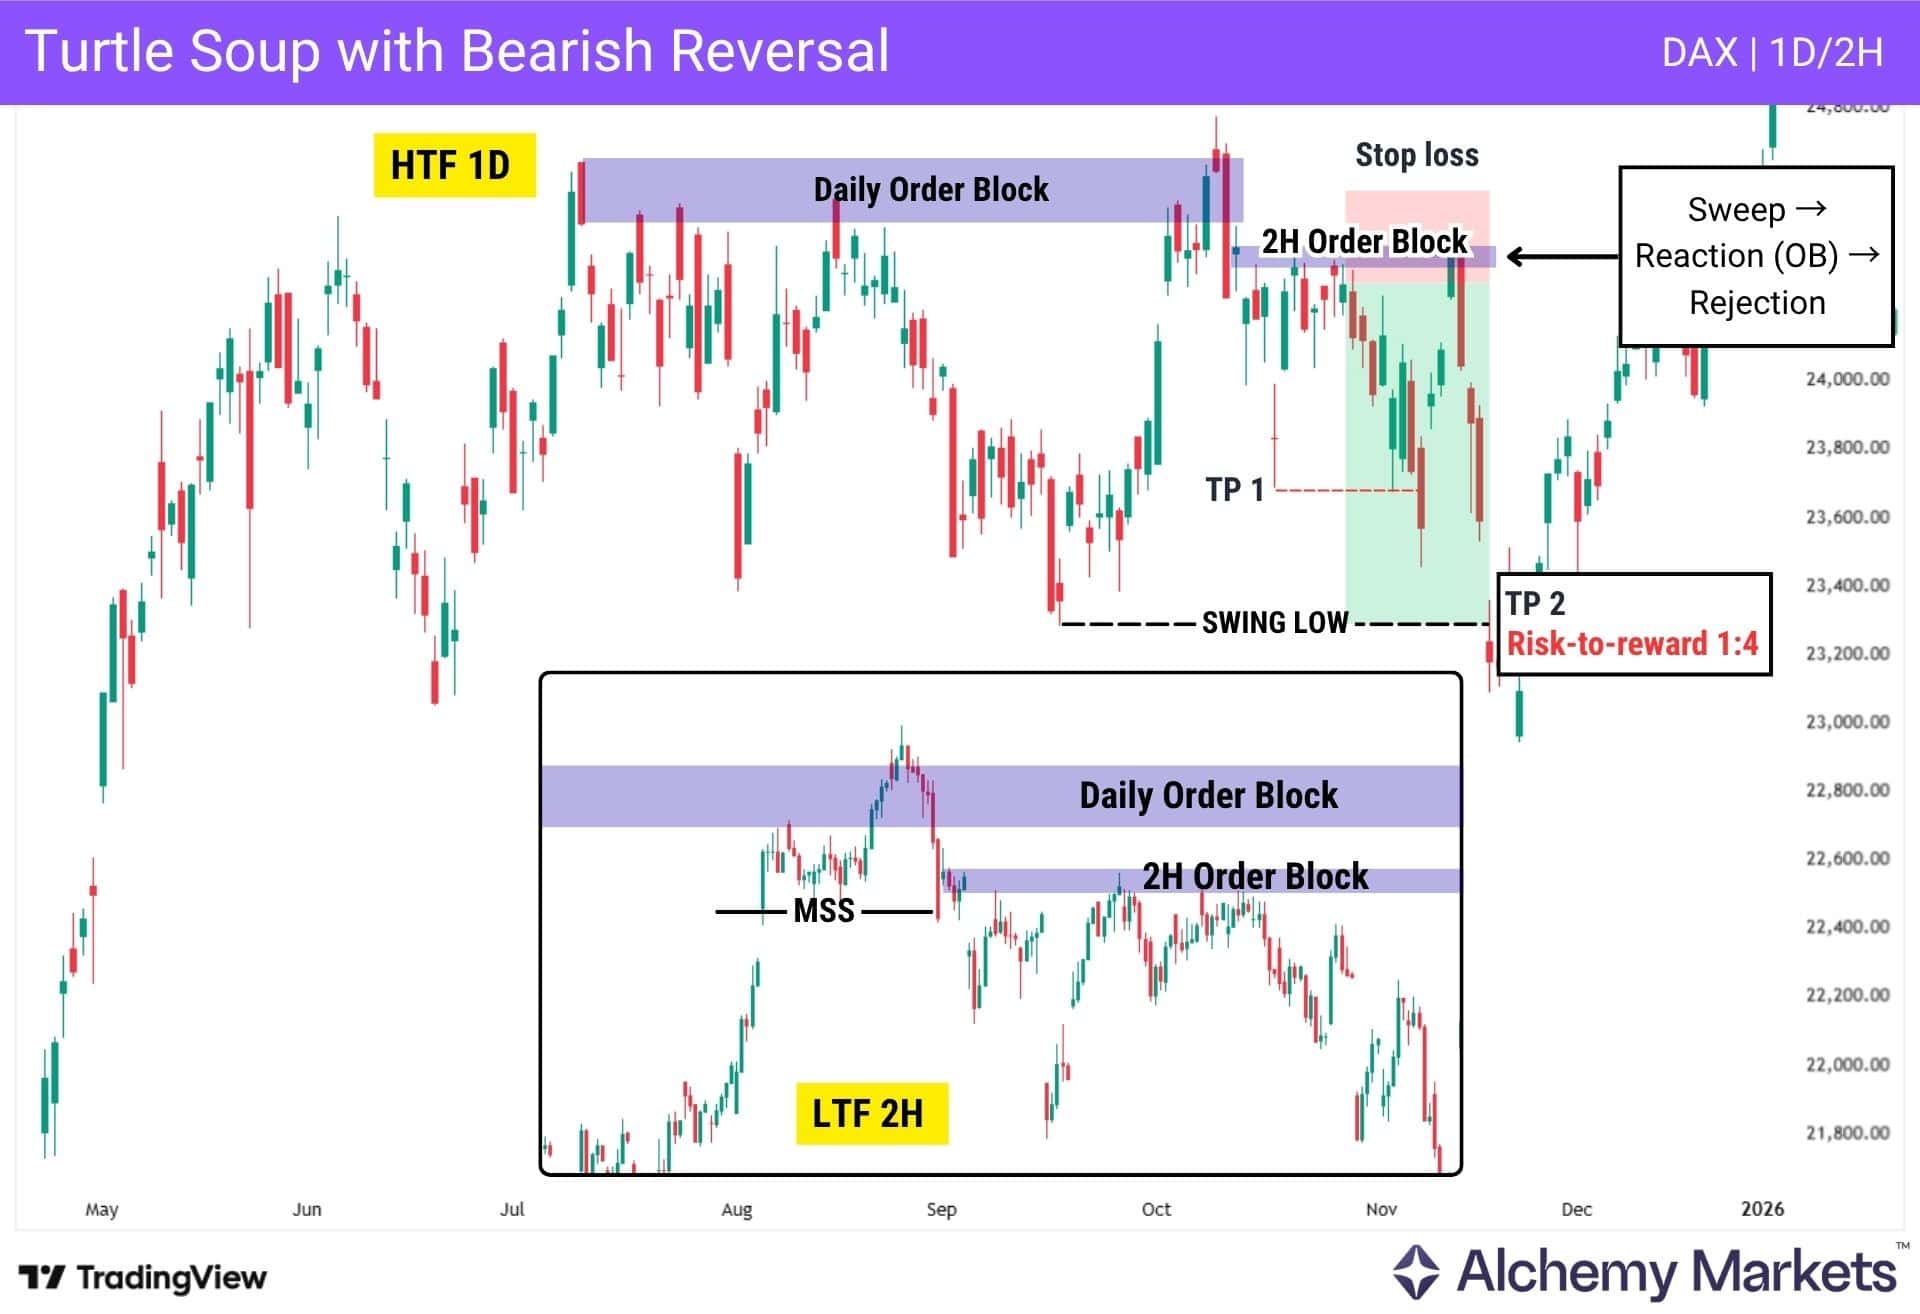
In this DAX example, price trades into a daily order block and pushes above the prior high, taking buy-side liquidity in the process. The move then fails, with price rejecting the area and closing back lower.
From there, the lower timeframe starts to confirm the shift. On the 2-hour chart, price forms a bearish MSS, then retests a 2-hour order block before continuing lower. This gives traders a cleaner way to frame the setup, with the stop loss above the sweep high and the swing low acting as the main downside target.
Higher Timeframe Analysis
Higher timeframe analysis provides the overall context, helping identify where price is likely to react and the prevailing direction.
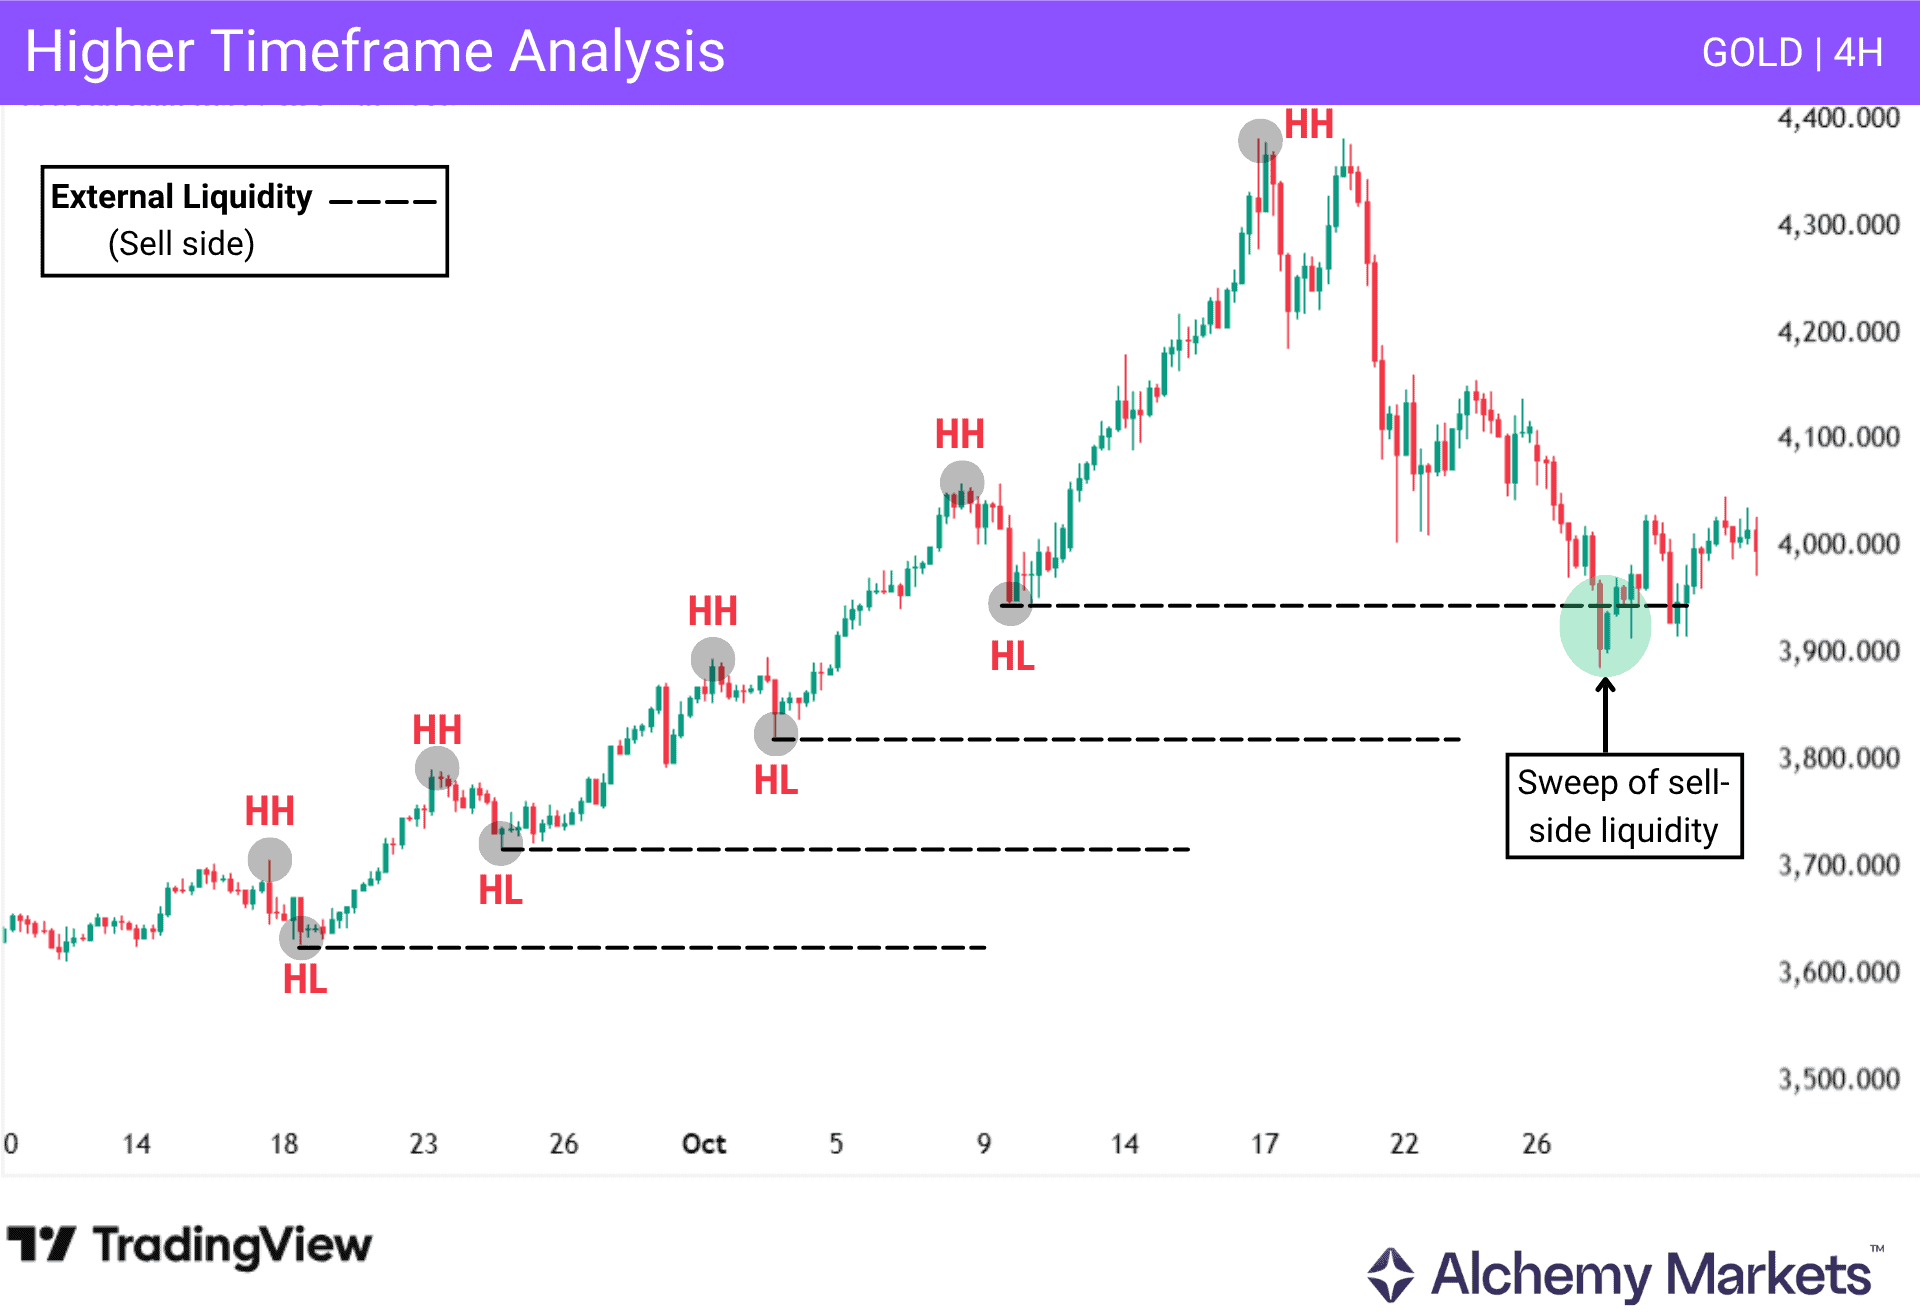
As shown in this GOLD 4H chart, price is in a bullish structure, with previous lows acting as sell-side liquidity. Once these levels are identified, the focus shifts to waiting for price to sweep them before zooming into lower time frames.
Lower Timeframe Confirmation
Now, as we previously discussed. Lower timeframes can help confirm, and refine turtle soup setups.
In this chart below, we’re looking at a 1H chart at a location where a previous low is noticeable on the 4H timeframe. That price level is now being swept – with 1H candles closing below the price and stalling.
As this is happening, notice how order blocks (or support levels) are forming at the lows. When price retests these OB’s, they are bouncing and refusing to close even lower. Additionally, price has reclaimed the 4h-low, which adds another sign of strength.
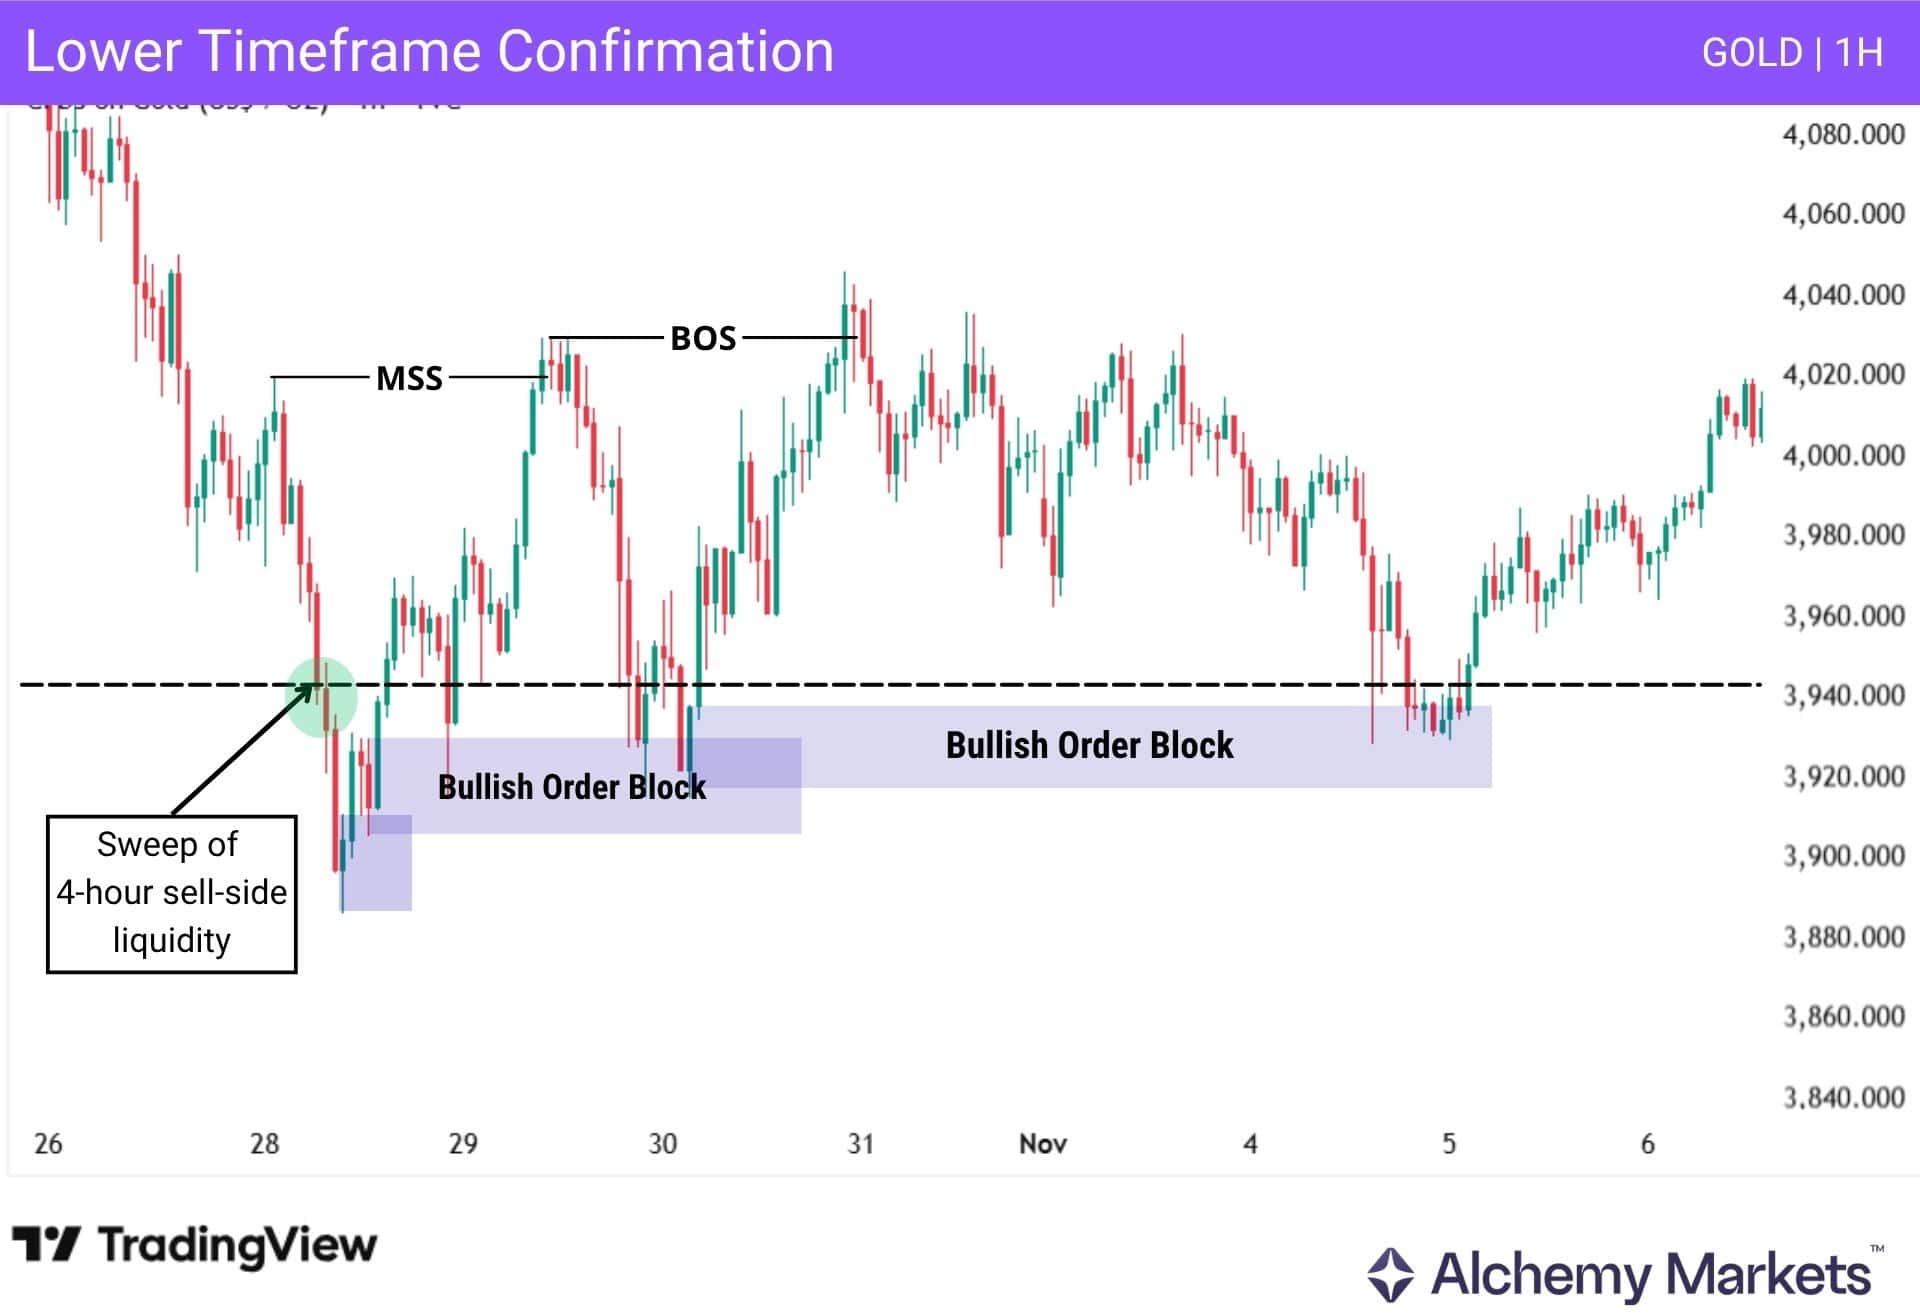
With multiple confirmation factors, traders can use this LTF to enter a long-turtle soup trade, using the following principles:
- Waiting for a LTF Market Structure Shift to confirm potential strength for a trend change.
- Waiting for a bounce at a LTF Order Block as a place of entry.
Now let’s zoom out to the 4H chart to see the result of this trade.
This is assuming that we entered a trade from the second order block after confirmation on the lower timeframe:
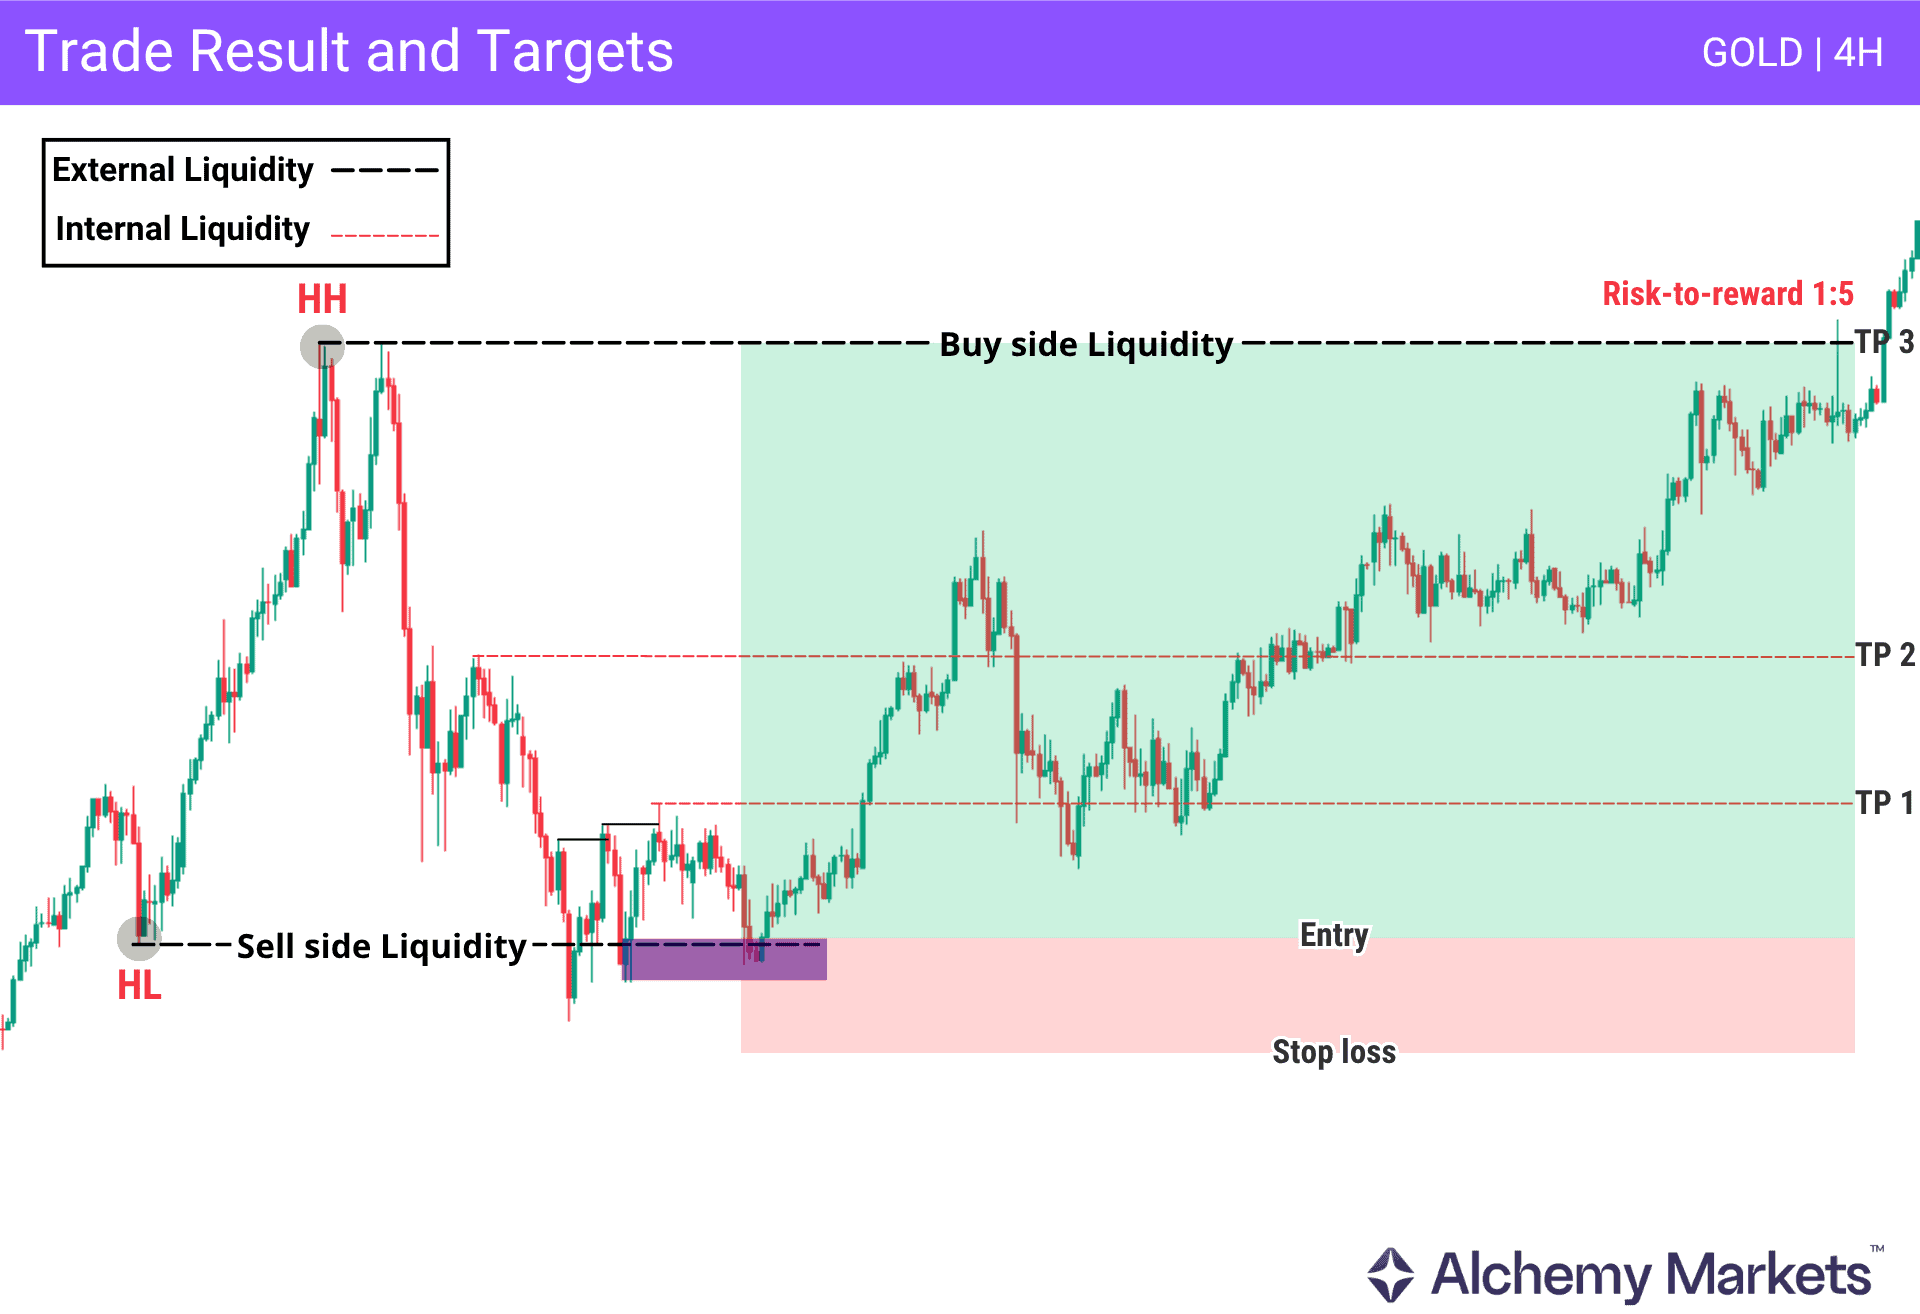
As you can see, price reacts from the second order block and moves higher. The first targets are the internal liquidity levels, with the higher high (buy-side liquidity) serving as the final target.
Bullish Setup
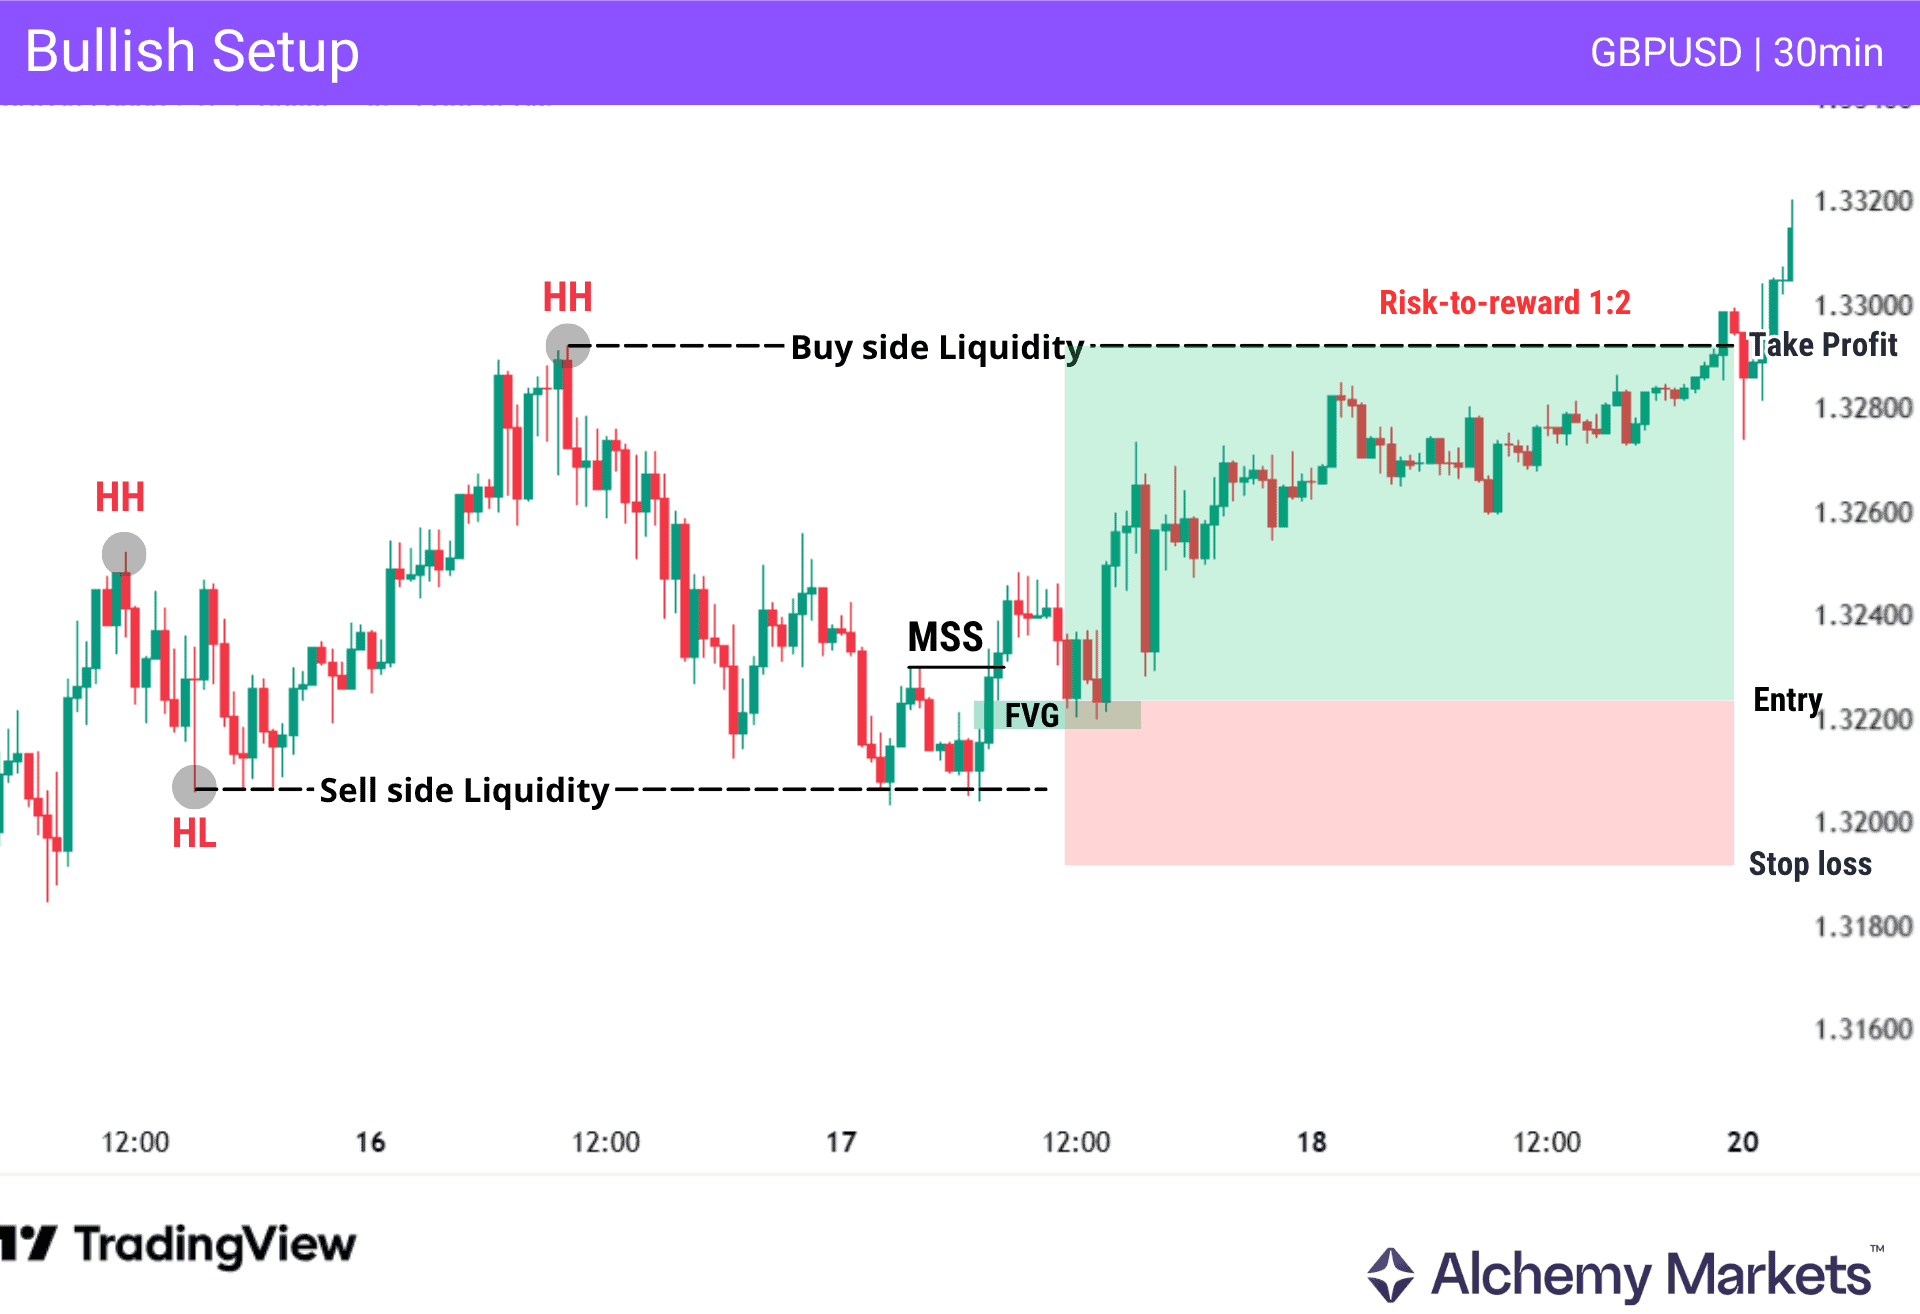
A bullish Turtle Soup setup forms in a bullish structure when price sweeps sell-side liquidity and confirms a reversal. After confirmation, this creates a buying opportunity aligned with the trend.
In strong bullish conditions, price typically moves from sell-side liquidity toward buy-side liquidity.
Bearish Setup
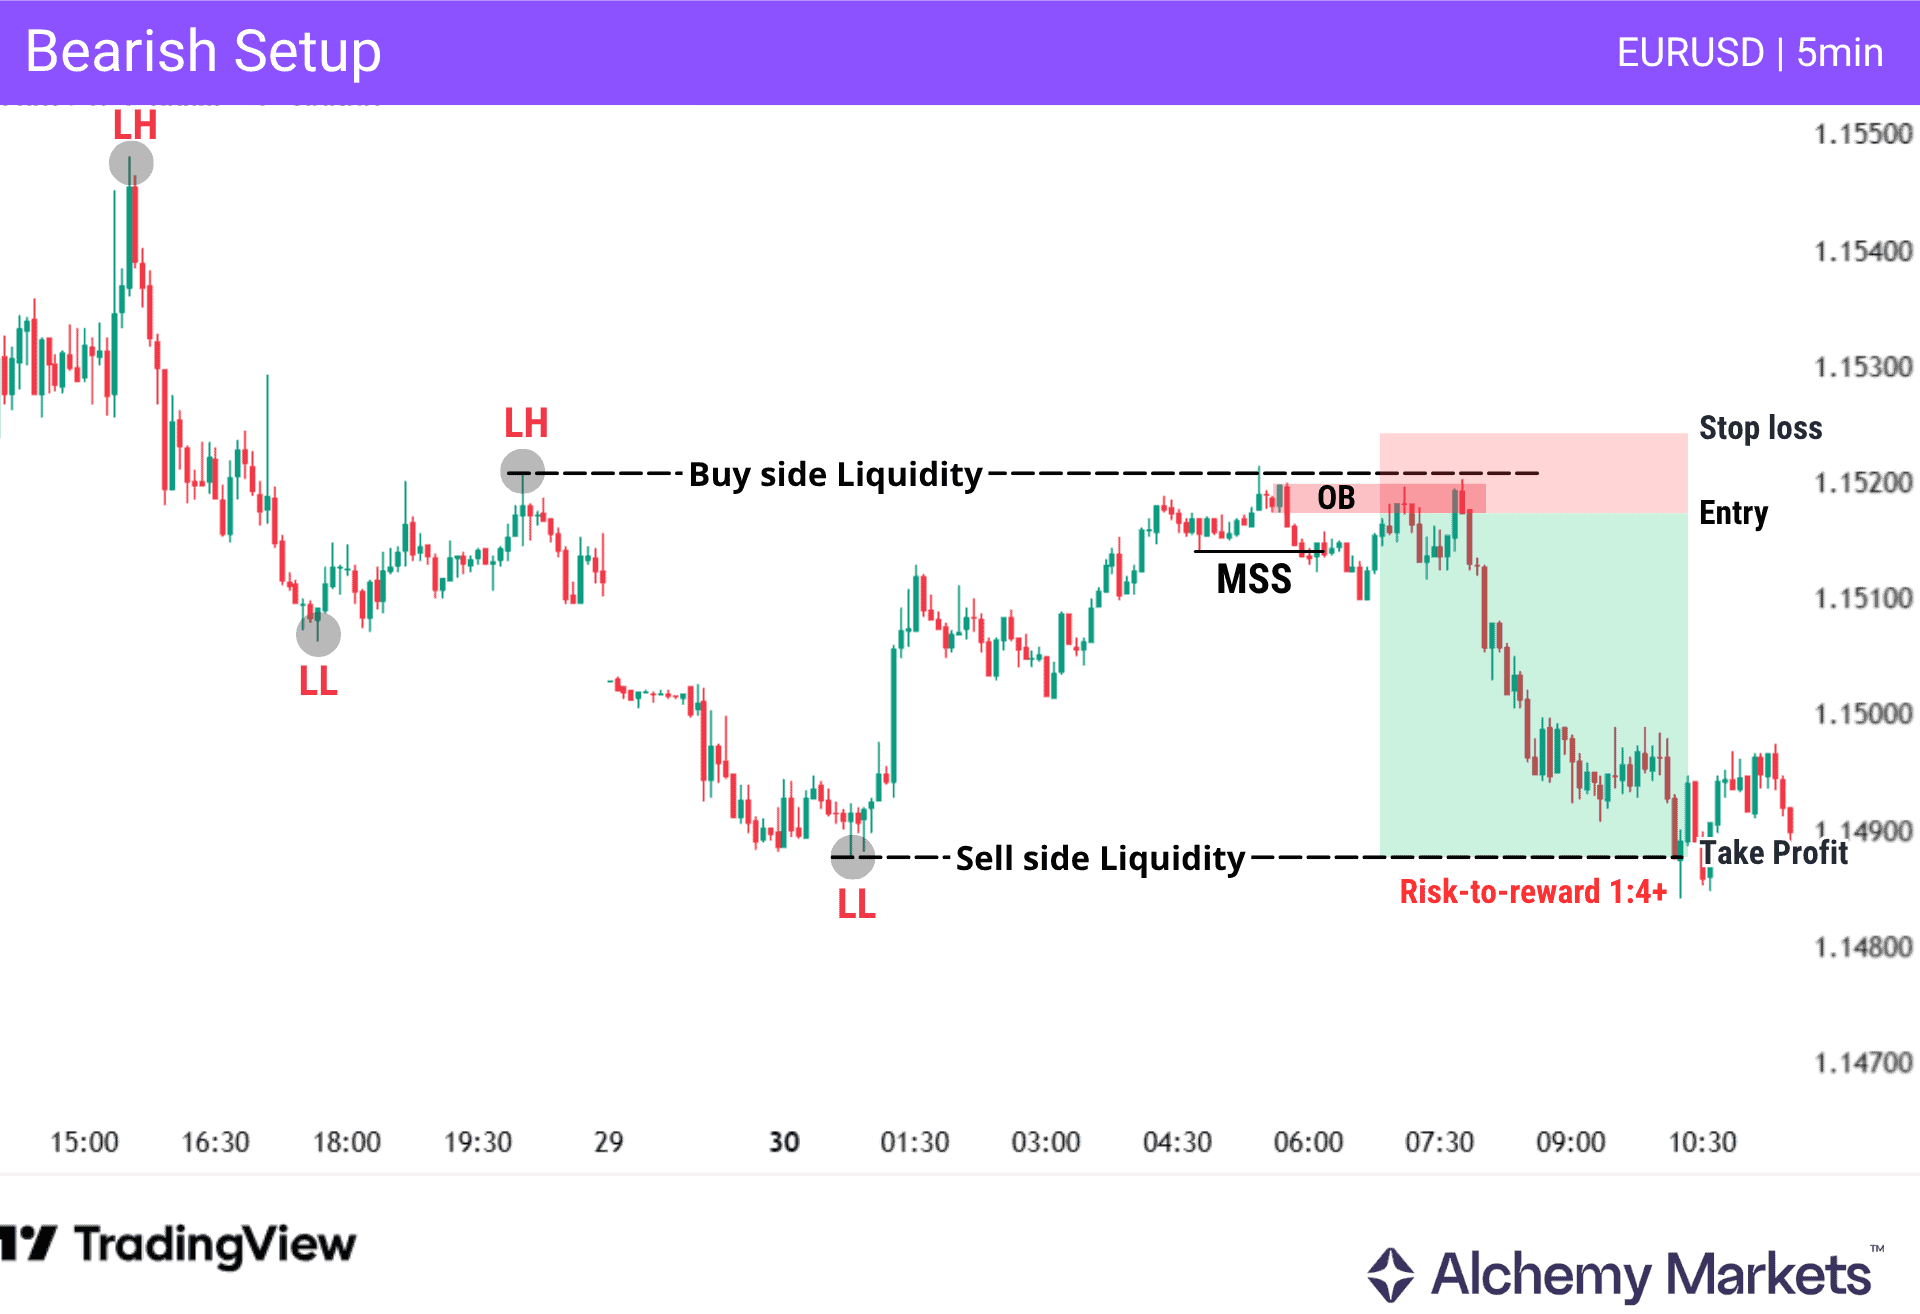
A bearish Turtle Soup setup forms in a bearish structure when price sweeps buy-side liquidity and confirms a reversal. After confirmation, this creates a selling opportunity aligned with the trend.
In strong bearish conditions, price typically moves from buy-side liquidity toward sell-side liquidity.
Advantages of Turtle Soup Trading
Turtle Soup can be useful for traders, as it provides a structured way to approach false breakouts and identify potential trading opportunities.
| Advantage | Explanation |
| High-probability areas | Trades are taken at key liquidity levels after price completes a pullback and clears stop-loss orders |
| Clear levels | The setup is based on clear swing highs and lows levels, making it easier to identify and trade |
| Works across markets | Can be applied to forex, crypto, stocks, indices, and commodities |
| Clearly defined risk | Stop loss is placed beyond the high or low formed after the liquidity sweep, making risk levels clear |
| Precise entries | Provides refined entry points on lower timeframes, allowing for favourable risk-to-reward ratios |
| works well with additional confluence | Works well with order blocks, fair value gaps, and other confluences |
Disadvantages of Turtle Soup Trading
Like any trading strategy, Turtle Soup has limitations and requires proper execution. Without context and confirmation, setups can fail or behave differently than expected.
| Disadvantage | Explanation |
Requires experience | Understanding market structure, liquidity, and multi-timeframe analysis takes practice |
Needs confirmation | Waiting for confirmation such as MSS can sometimes lead to missed trades |
Failed reactions | Price may initially react at a liquidity level but fail to hold, breaking through the level and invalidating the setup |
Inconsistent liquidity delivery | In weaker trends, price may not move cleanly from buy-side to sell-side liquidity, or vice versa |
Turtle Soup Trading vs Turtle Trading
Although they share a similar name, Turtle Soup trading and Turtle Trading follow different approaches.
The original Turtle Trading strategy focuses on breakout continuation, entering trades when price breaks a level and following the trend, often using tools such as moving averages, Donchian channels, or Bollinger Bands.
Turtle Soup trading, on the other hand, focuses on failed breakouts and liquidity sweeps. Instead of following the breakout, it waits for the move to fail and uses confirmation to trade the reaction from that level.
Comparison Table
| Feature | Turtle Trading | Turtle Soup Trading |
| Core idea | Follow breakouts | Trade failed breakouts |
| Approach | Trend-following | Reaction-based / confirmation-based |
| Entry logic | Enter on breakout | Enter after liquidity sweep and confirmation |
| Market condition | Works in trending markets | Works in both trending and ranging markets |
| Behaviour | Momentum continuation | Liquidity-driven reaction and continuation |
Bullish Turtle Soup Setup vs Bearish Turtle Soup Setup
A bullish Turtle Soup setup forms when price sweeps sell-side liquidity below the lows and shifts to the upside, creating a buying opportunity.
A bearish Turtle Soup setup forms when price sweeps buy-side liquidity above the highs and shifts to the downside, creating a selling opportunity.
Comparison Table
| Setup Type | Bullish | Bearish |
| Liquidity target | Sell-side liquidity (below lows) | Buy-side liquidity (above highs) |
| Liquidity sweep | Sweep below a key low | Sweep above a key high |
| Confirmation | Bullish market structure shift (MSS) | Bearish market structure shift (MSS) |
| Entry | Long after retracement into a bullish OB or FVG | Short after retracement into a bearish OB or FVG |
| Directional objective | Move from sell-side liquidity to buy-side liquidity | Move from buy-side liquidity to sell-side liquidity |
Turtle Soup Trading in Forex
The Turtle Soup strategy is widely applied in forex due to the market’s liquidity and consistent structure formation. Major pairs such as EUR/USD and GBP/USD frequently form clear swing highs and lows, making it easier to identify liquidity levels and potential sweep areas.
Forex markets are also influenced by session-based volatility, particularly during the London and New York sessions. These periods often create expansions in price that can sweep liquidity before forming a reaction, making them suitable conditions for applying Turtle Soup setups with proper confirmation.
Turtle Soup Trading in Crypto
Crypto markets tend to produce frequent liquidity sweeps due to their high volatility, but this also increases the risk of false reactions and overextended moves. Price can push well beyond key levels before any reversal forms, making early entries unreliable.
Because of this, confirmation becomes critical. Waiting for a clear market structure shift (MSS) and using refined entry zones such as order blocks or fair value gaps helps avoid premature entries and improves execution in fast-moving conditions.
Major news events can also influence direction, often increasing volatility and affecting how price reacts around liquidity levels.
Turtle Soup Trading in Stocks
In stocks, Turtle Soup setups are most effective when focused on higher timeframe key levels, where large pools of liquidity attract both buyers and sellers. These levels often form around major swing highs and lows, acting as clear areas of interest for price.
When price reaches and sweeps these levels, it can lead to a potential reaction, particularly if the move fails to continue. However, stocks can introduce gaps, where price moves beyond a level without trading through it, which can distort liquidity behaviour and reduce the clarity of the setup.
Because of this, it is important to focus on well-defined higher timeframe levels and wait for clear confirmation before execution.
Turtle Soup Trading in Commodities
Commodities such as gold (XAU/USD) and silver (XAG/USD) are highly volatile and often influenced by geopolitical developments and macroeconomic events. Because of this, short-term price direction can be difficult to anticipate, particularly on lower timeframes.
These markets frequently exhibit aggressive liquidity sweeps and false breakouts around key levels, creating conditions that can be used in Turtle Soup setups.
Turtle Soup Trading in Indices
Indices such as the S&P 500 and NASDAQ are highly driven by intraday liquidity and session timing. Price often builds around session highs and lows, particularly during the London and New York opens, where large volumes enter the market.
These periods frequently produce sharp, fast moves that sweep liquidity on one side before reversing. This makes indices particularly sensitive to timing, as the initial move can be misleading. Rather than reacting immediately, it is often more effective to observe how price behaves after the sweep, especially around key session levels.
FAQ
Is the Turtle Soup strategy suitable for beginners?
The strategy can be learned by beginners, but it requires a solid understanding of liquidity and market structure. It is often easier to start on higher timeframes before refining execution on lower timeframes.
How do I avoid getting caught in real turtle breakouts instead of false ones?
Focus on confirmation. A valid setup requires a liquidity sweep followed by a market structure shift (MSS). Without this shift, the breakout is more likely to continue.
Do you need to wait for a Market Structure Shift with the ICT Turtle Soup?
Yes, waiting for a market structure shift (MSS) provides stronger confirmation. Entering before this increases the risk of trading continuation instead of a valid reversal.
Is Turtle Soup just a liquidity sweep?
No. A liquidity sweep is only the first step. A complete setup requires a sweep, a shift in market structure, and identifying entries and targets.
How to identify order blocks?
Order blocks are typically the last opposing candles before a strong move. These areas often act as points where price may react when revisited.
What is the best time frame to use for the Turtle Soup trading?
The strategy works best using multiple timeframes. The higher timeframe provides context, while the lower timeframe is used for confirmation and entry.
What higher timeframe should you use for the ICT Turtle Soup?
Common choices include the 4-hour and daily timeframes, as they tend to provide clearer structure and more reliable liquidity levels.
Can I automate the Turtle Soup strategy?
Some parts can be automated, but confirmation and execution generally require manual analysis, especially when identifying structure and liquidity.
Who first invented the Turtle Soup Trading?
The concept was introduced by Linda Bradford Raschke as an alternative to the original Turtle Trading method developed by Richard Dennis and Bill Eckhardt.
How reliable is the Turtle Soup trading?
The strategy can be effective when used with proper context, confirmation, and risk management. Without these elements, its performance becomes inconsistent.
What is the turtle system strategy?
The turtle system strategy refers to the original breakout-based method that focuses on trend continuation using predefined rules.
Can the ICT Turtle Soup strategy be applied in trending markets?
Yes, but it is more effective when price is extended into liquidity rather than during strong, clean directional moves without pullbacks.
Why is it called Turtle Soup trading?
The name is a funny contrarian take on the famous “Turtle Trading” breakout strategy. When the breakout fails and traps traders, it is “making soup” of the trapped turtles.