
- Elliott Wave
- December 15, 2025
- 2 min read
Ethereum Elliott Wave: Support Looms Nearby
Executive Summary:
- Ethereum is falling and may find support near $2,940 and $2,801
- If support is found, then the next rally may carry up to $3,732 and $4,243
- This bullish view is valid so long as the prices hold above $2,623.
Ethereum Elliott Wave Analysis
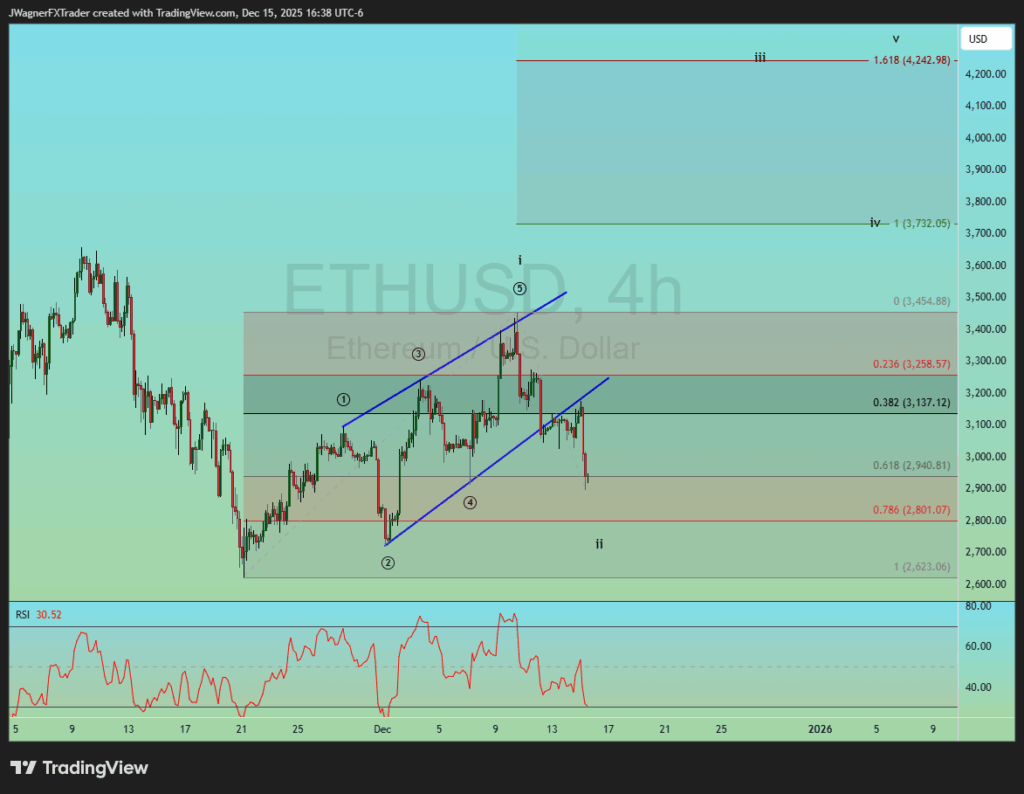
Ethereum price declining in an apparent Elliott wave ii of a larger 5-wave sequence.
Under this model, the price of Ethereum may decline to $2940 and possibly $2800 then rally to $3,732 and possibly $4,243. The key bullish level is $2623.
The rally from November 21 is considered a leading diagonal pattern, representing a rising wedge. The diagonal unfolds in 5-waves, then is followed by a corrective pattern.
Once the top was in place for the leading diagonal, the Ethereum price has declined below the support trend line formed by the wave 2 and 4 lows. After breaking below the low, ETH price has rallied to retest the underside of the broken trend line.
Using the Fibonacci retracement levels, we can set potential targets to the downside at the 61.8% and possibly 78.6% levels. This implies downside targets of $2940 and possibly $2800.
If the bottom does form near these levels, then we can apply the Fibonacci extension tool between the proposed wave i and ii to determine where wave iii might travel to. It appears some upward targets may include $3,732 and possibly $4,243.
Bottom Line
This downward trend that began December 10 may be reaching its final stages near $2,940 and $2,800. If this forecast is correct, then an upward target may include $3,732 and possibly $4,243. This forecast remains valid so long as the Ethereum price remains above the November low of $2,623.