
- Quarterly Forecast
- oktober 6, 2026
- 7 min läsning
Q4 2026 Commodites Forecast: Will Gold and Silver Find a Bottom?
| Q3 2026 Performance | 2026 YTD | |
| *Gold (XAUUSD) | +3.7% | -3.6% |
| *Silver (XAGUSD) | +3.1% | -15.5% |
| *Crude Oil (USOIL) | +28.0% | +56.2% |
| Platinum | +10.9% | -16.3% |
| *Bitcoin | +42.5% | -4.7% |
*Analysis and forecast below
Q3 2026 recovered much of the loss sustained in Q2 as each of the tracked commodities markets gained in Q3.
Only Silver and Platinum remained in the red by double digits for the year. Crude oil continues to remain at sticky high prices as the conflict with Iran has impacted the recovery and distribution of oil.
Though the Strait of Hormuz appears to be reopened, the supply of oil is likely to remain below pre-war levels with long-term demand remaining sticky.
The metals have traded low enough that a bottom may start to develop. Bitcoin, the digital gold, still appears to have an incomplete downtrend as it has yet to trade below $50k.
Crude Oil
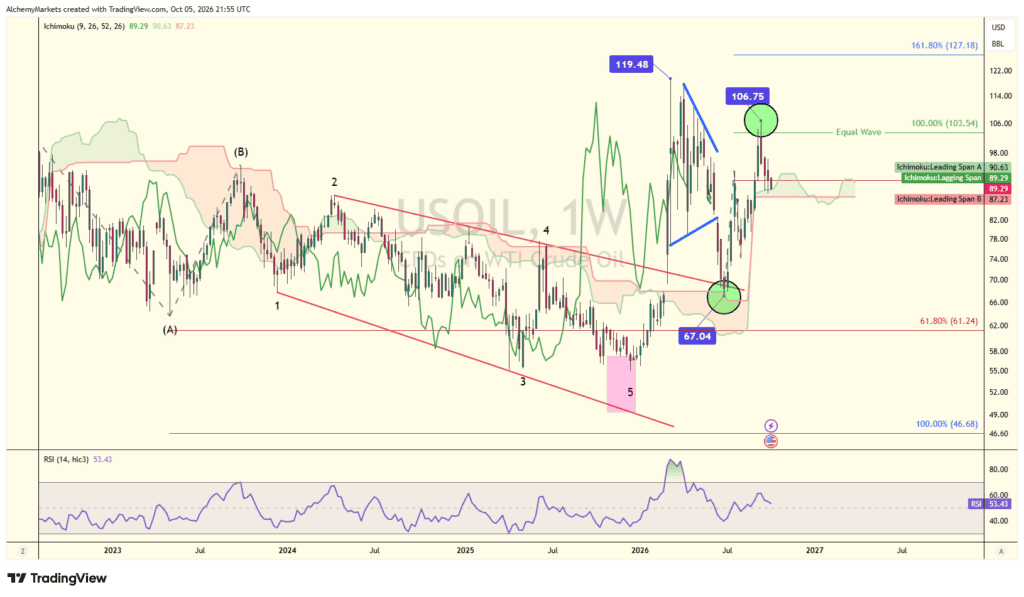
At the end of Q2, Crude oil pushed to a war time low of $67.04. Prices have been steadily climbing since then reaching a Q3 high of $106.75.
The structure of the rally is inconclusive. I can see both bullish and bearish patterns. I’m leaning towards bullish patterns simply because the Iran conflict has been on again-off again. The structural damage to the supply chain is real.
Additionally, China cut their imports beginning in March by 4 million barrels per day. During a time of a supply crunch, this is a huge cut and it alleviated the pressure on demand helping keep crude oil costs down.
Additionally, sovereign nations have drawn down their emergency supplies. This means if the cost for crude oil were to fall, sovereign nations may buy some to replenish their used up reserves.
Technically, part of the reason I’m leaning towards the longer-term bullish patterns is because the rally from the July low to the September high is an equal wave pattern (between the two green circles). This gives weight to a corrective rally. A corrective rally shaped like that placed AFTER a corrective decline from Q1 signals the September high is probably a ‘B’ wave high.
It’s too early to tell, but this may be a larger triangle pattern developing.
The September high of $106.75 is a key level. If this breaks to the upside, then a larger bullish structure is underway. So long as prices hold below $106.75, then a decline to $80 is possible. This would be a decline within the context of a much larger uptrend.
Gold Forecast
From a longer term perspective (over several years), the Elliott wave pattern is incomplete to the upside suggesting new highs may eventually be seen above $5600. However, gold has been in a fairly steady downtrend so far in 2026.
Our Q2 2026 forecast was spot on. While trading at 4,676, we forecasted:
“Therefore, if gold holds below $5,000, then be mindful of another dip that could dig as low as $3,600.”
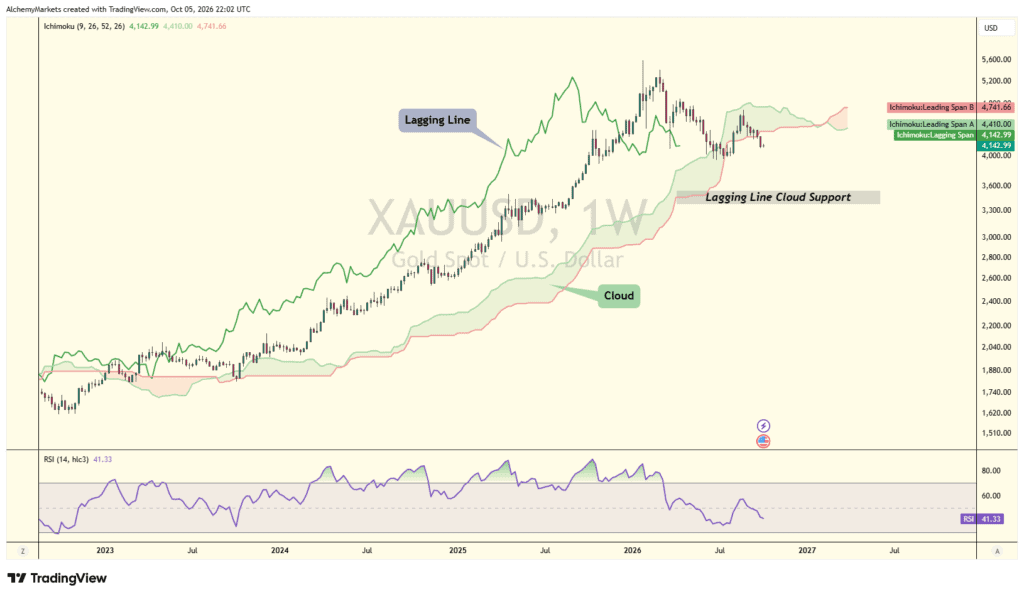
Gold prices briefly penetrated the lower end of the Ichimoku Cloud at 3959, then rebounded to the topside of the cloud in Q3. Currently, gold prices are just below the lower end of the Cloud trying to decide whether to rally back above or continue its decline.
The lagging line is still well above the cloud. Ichimoku technicians would suggest that price can briefly dip through the cloud, but if a trend change were to occur, it would be the lagging line breaking below the cloud.
Based on the current position of the cloud, heavy support for Q4 would be near 3,500 if gold prices fall.
I’m not convinced that gold will re-calibrate to lower levels, but if it does, strong support sits near 3,500.
Using Elliott Wave Theory as our guide, it appears gold is in the initial stages of a rally that launched from 3942. The setback in August & September is viewed as a partial correction that leads to another bullish rally carrying up to 5,000 and possibly 5,500 in the coming months.
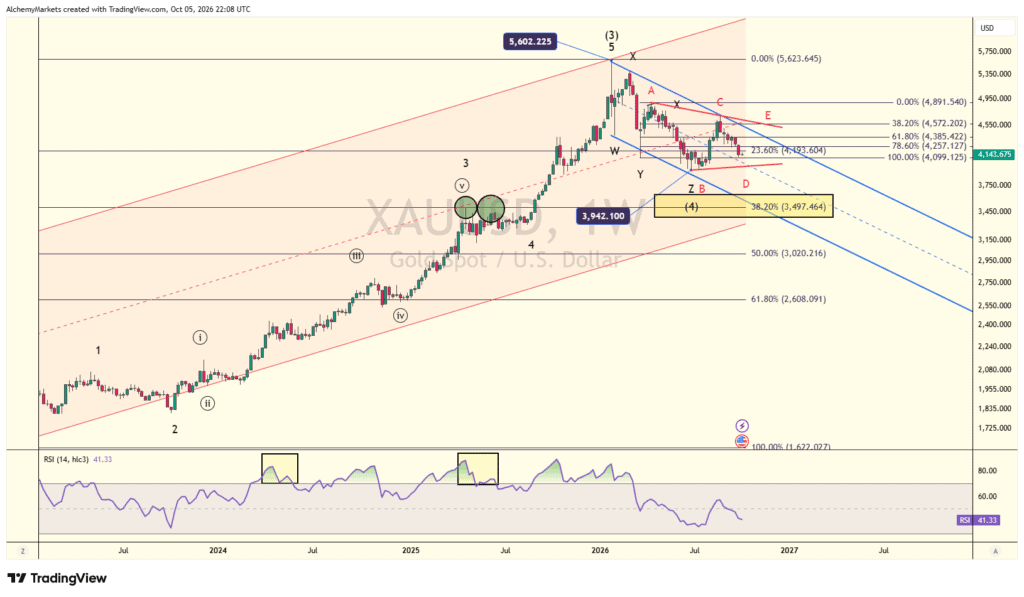
There is a competing bearish wave count that we have relegated as an alternative pattern in that the downward correction is incomplete (red labels). Though a rally may develop, the rally may hold below 4,550 as gold prices work down to near 3,600.
Interesting how separate forms of technical analysis in Ichimoku and Elliott wave point to a very strong support level near 3500-3,600. I’m not suggesting gold prices have to fall to those levels, but if it does, 3500-3600 presents a strong value area.
Silver
Silver’s technical picture is more or less aligned with gold.
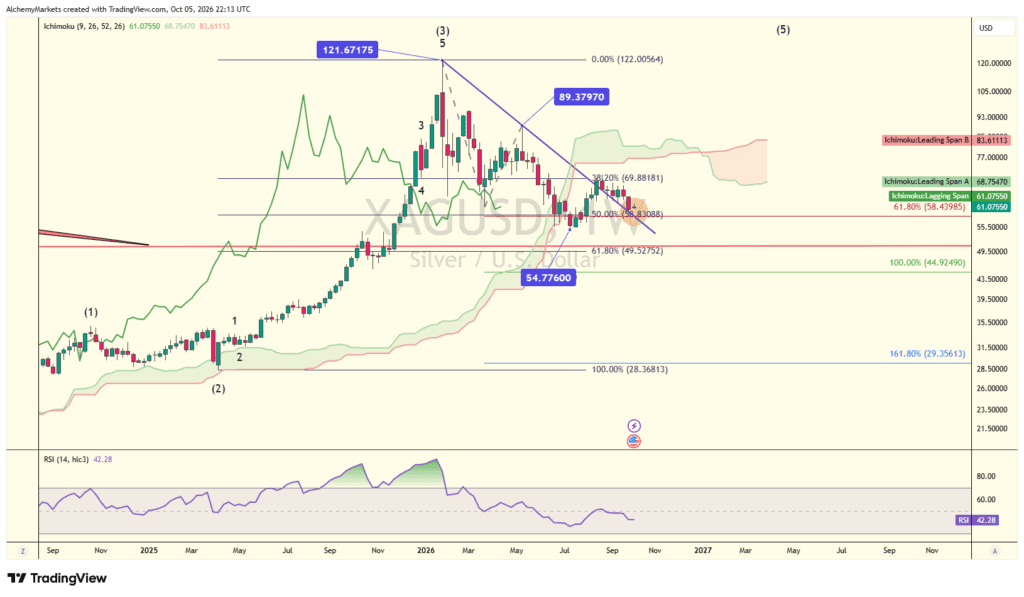
During Q3, silver reached a low in July of $54.77 just above the key low we forecasted in Q2.
It is our view that silver is finding a bottom and may have hit that low in July. This would explain a relatively sideways price action where prices today are similar to the low formed 6 months ago in March.
The recent decline in September may be a partial correction of the small rally. Additionally, the resistance trend line formed from the January and May highs was broken in August. The late Q3 decline is simply rubbing along the topside of the broken resistance trend line turned support.
If this decline ends up being a partial retracement, then silver would push above $71 possibly reaching $89.
If silver prices were to falter and push below the July low of $54.77, then the downward decline was incomplete and the red 1980 trend line may provide support. The red trend line passes through near $50.90.
Ichimiku is providing a mixed review. Silver prices are below the cloud while the lagging line is above the cloud. However, where the lagging line sits, the cloud is small and rapidly rising in price.
That is an interesting dynamic that suggests if silver prices were to fall, it may be followed by a quick and sharp rebound.
This leads me to conclude that silver is trying to bottom and may have found a bottom in July at $54.77. If not, then the next level of support arrives near $50.90.
One support is established, then a rally to $89 would be an initial target.
Bitcoin Forecast (Digital Gold)
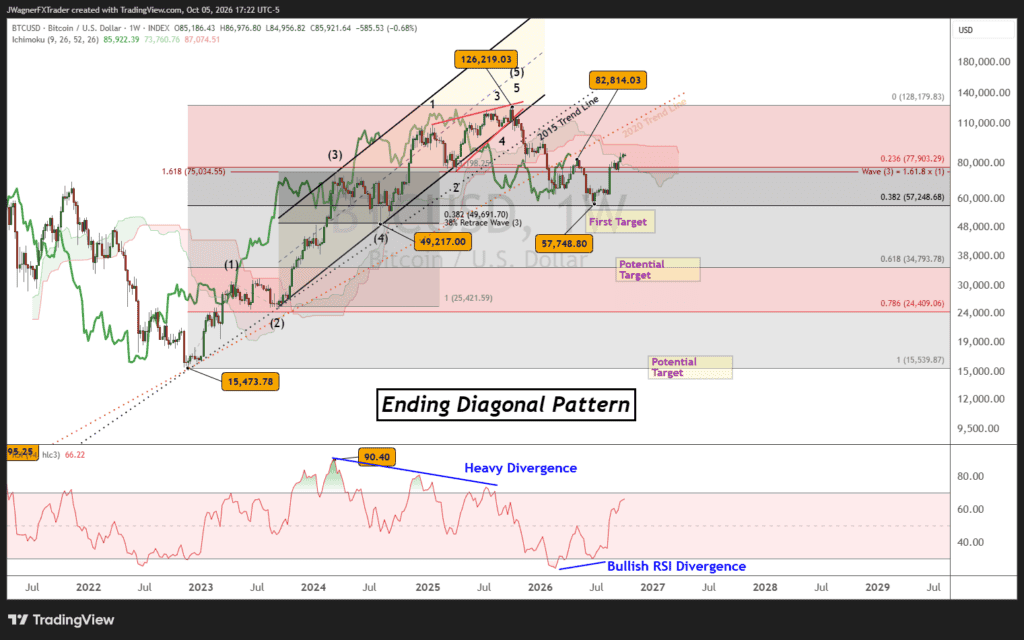
Bitcoin has had quite the rally in the latter part of Q3 2026. There was nice bullish RSI divergence coming off the weekly lows. The rally has lifted far enough that RSI could be making a bullish shift, but we can’t say for sure.
From an Elliott wave perspective, the decline to 57,748 was a little shallow based on idealized Elliott wave patterns. The EW patterns suggest another retest of the low and possibly deeper cuts coming.
From an Ichimoku perspective, both Bitcoin price and the lagging line are below the cloud. This is bearish and suggests bullish rallies are temporary.
Therefore, the base case for Bitcoin in Q4 is that a secondary top would develop soon. The top of the Ichimoku cloud where the lagging line may hit is 100,330. The top of the cloud for price is 93,175. Therefore, while Bitcoin is below 100,330, the larger trend can be considered down.
Once the downtrend re-emerges, then Bitcoin may push below 57k possibly reaching 49k or 35k.
If Bitcoin were to push above 100,330, then we’d consider that a major low is in place and that Bitcoin was going to trend significantly higher.
Bigger picture, the main Elliott wave count suggests that an important and long-term top formed in October 2026.
If the 2022-2026 rally is a completed Elliott wave impulse pattern, then wave (5) of the impulse can be counted as an ending diagonal or rising wedge. These patterns tend to be completely retraced leading to a decline back to $49,217, the origination of the diagonal pattern. It is important to keep in mind that even lower levels are possible like $35k and even $15k.
Most of the damage has been done with the current trend low at $57,748. However, the decline does not appear complete and hints that another low is around the corner.