


Scritto da:

- Opening Bell
- Marzo 4, 2026
- 3 min di lettura
S&P 500 Taps Bottom of Range at $6,792 and 4H-EMA 200
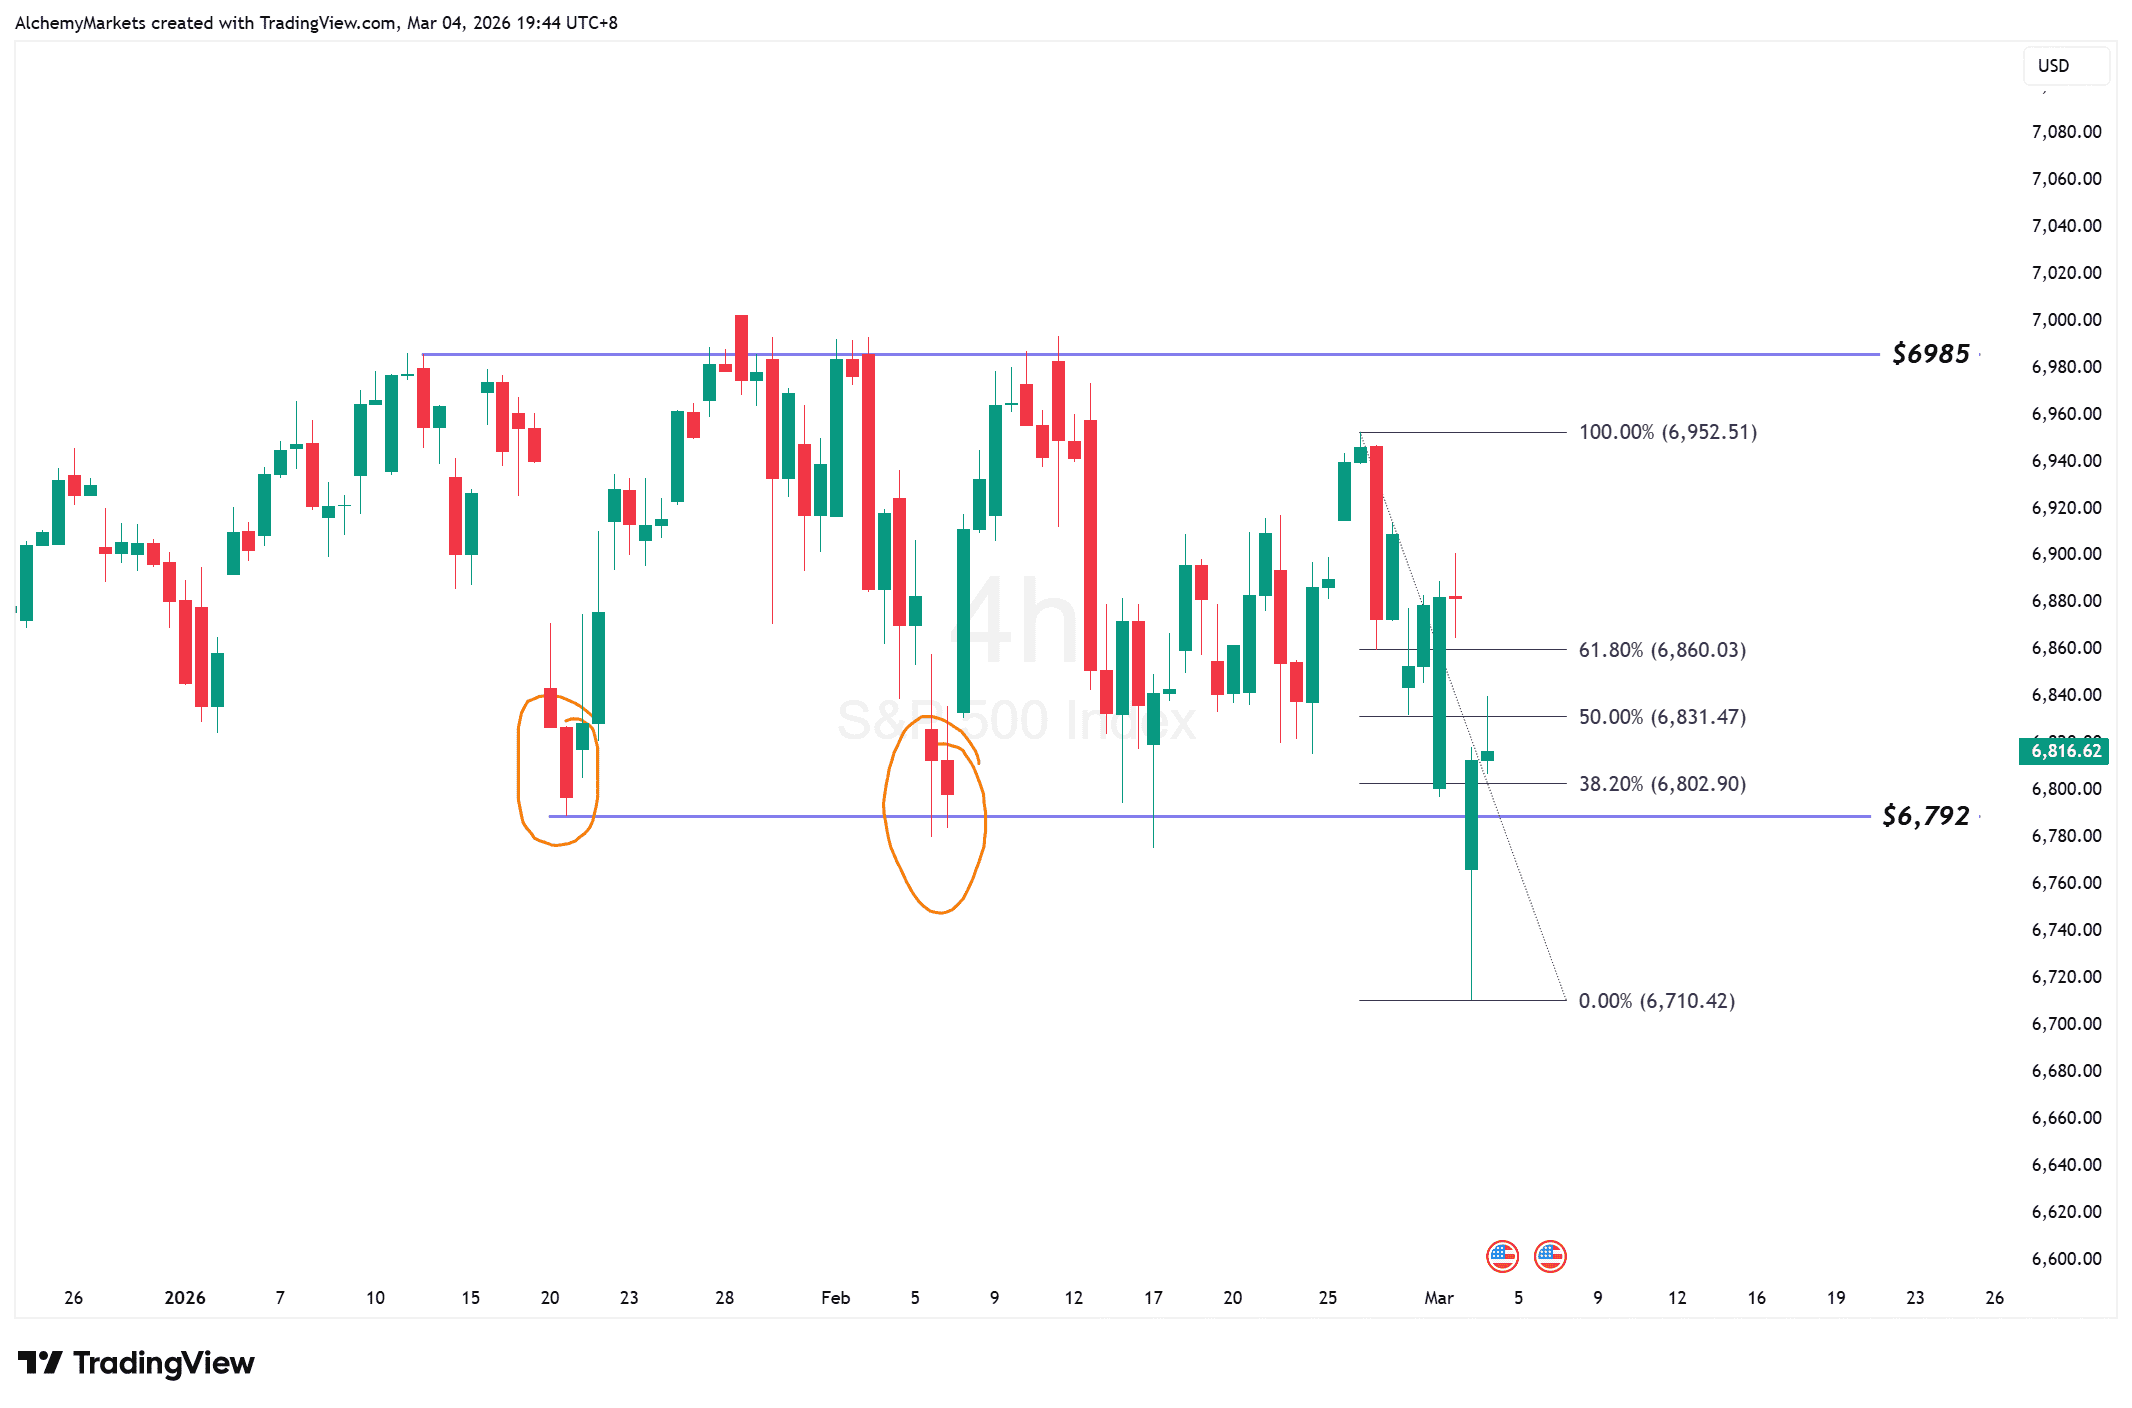
The S&P 500 tanked by 2.76% yesterday, but is now making a valiant effort at recovery. Upon closer inspection, we can see the asset is still within a tight range between $6,792 to $6,985.
There is now a very clear market gap between $6,812 to $6,864; but that may not be significant at all because S&P 500 blatantly has disrespected those gaps for the entirety of 2026.
What this tells us is that we are in a macro driven environment; earnings, geopolitics, and interest rate decisions are what drives this market concurrently. The choppy sideways move also aligns with the idea of sector rotation, where now – defense and energy stocks are beginning to shine rather than AI and Chips.
So what does this mean for trading today?
Going on the 4H-timeframe, we can see that S&P clearly resisted closing below the range:
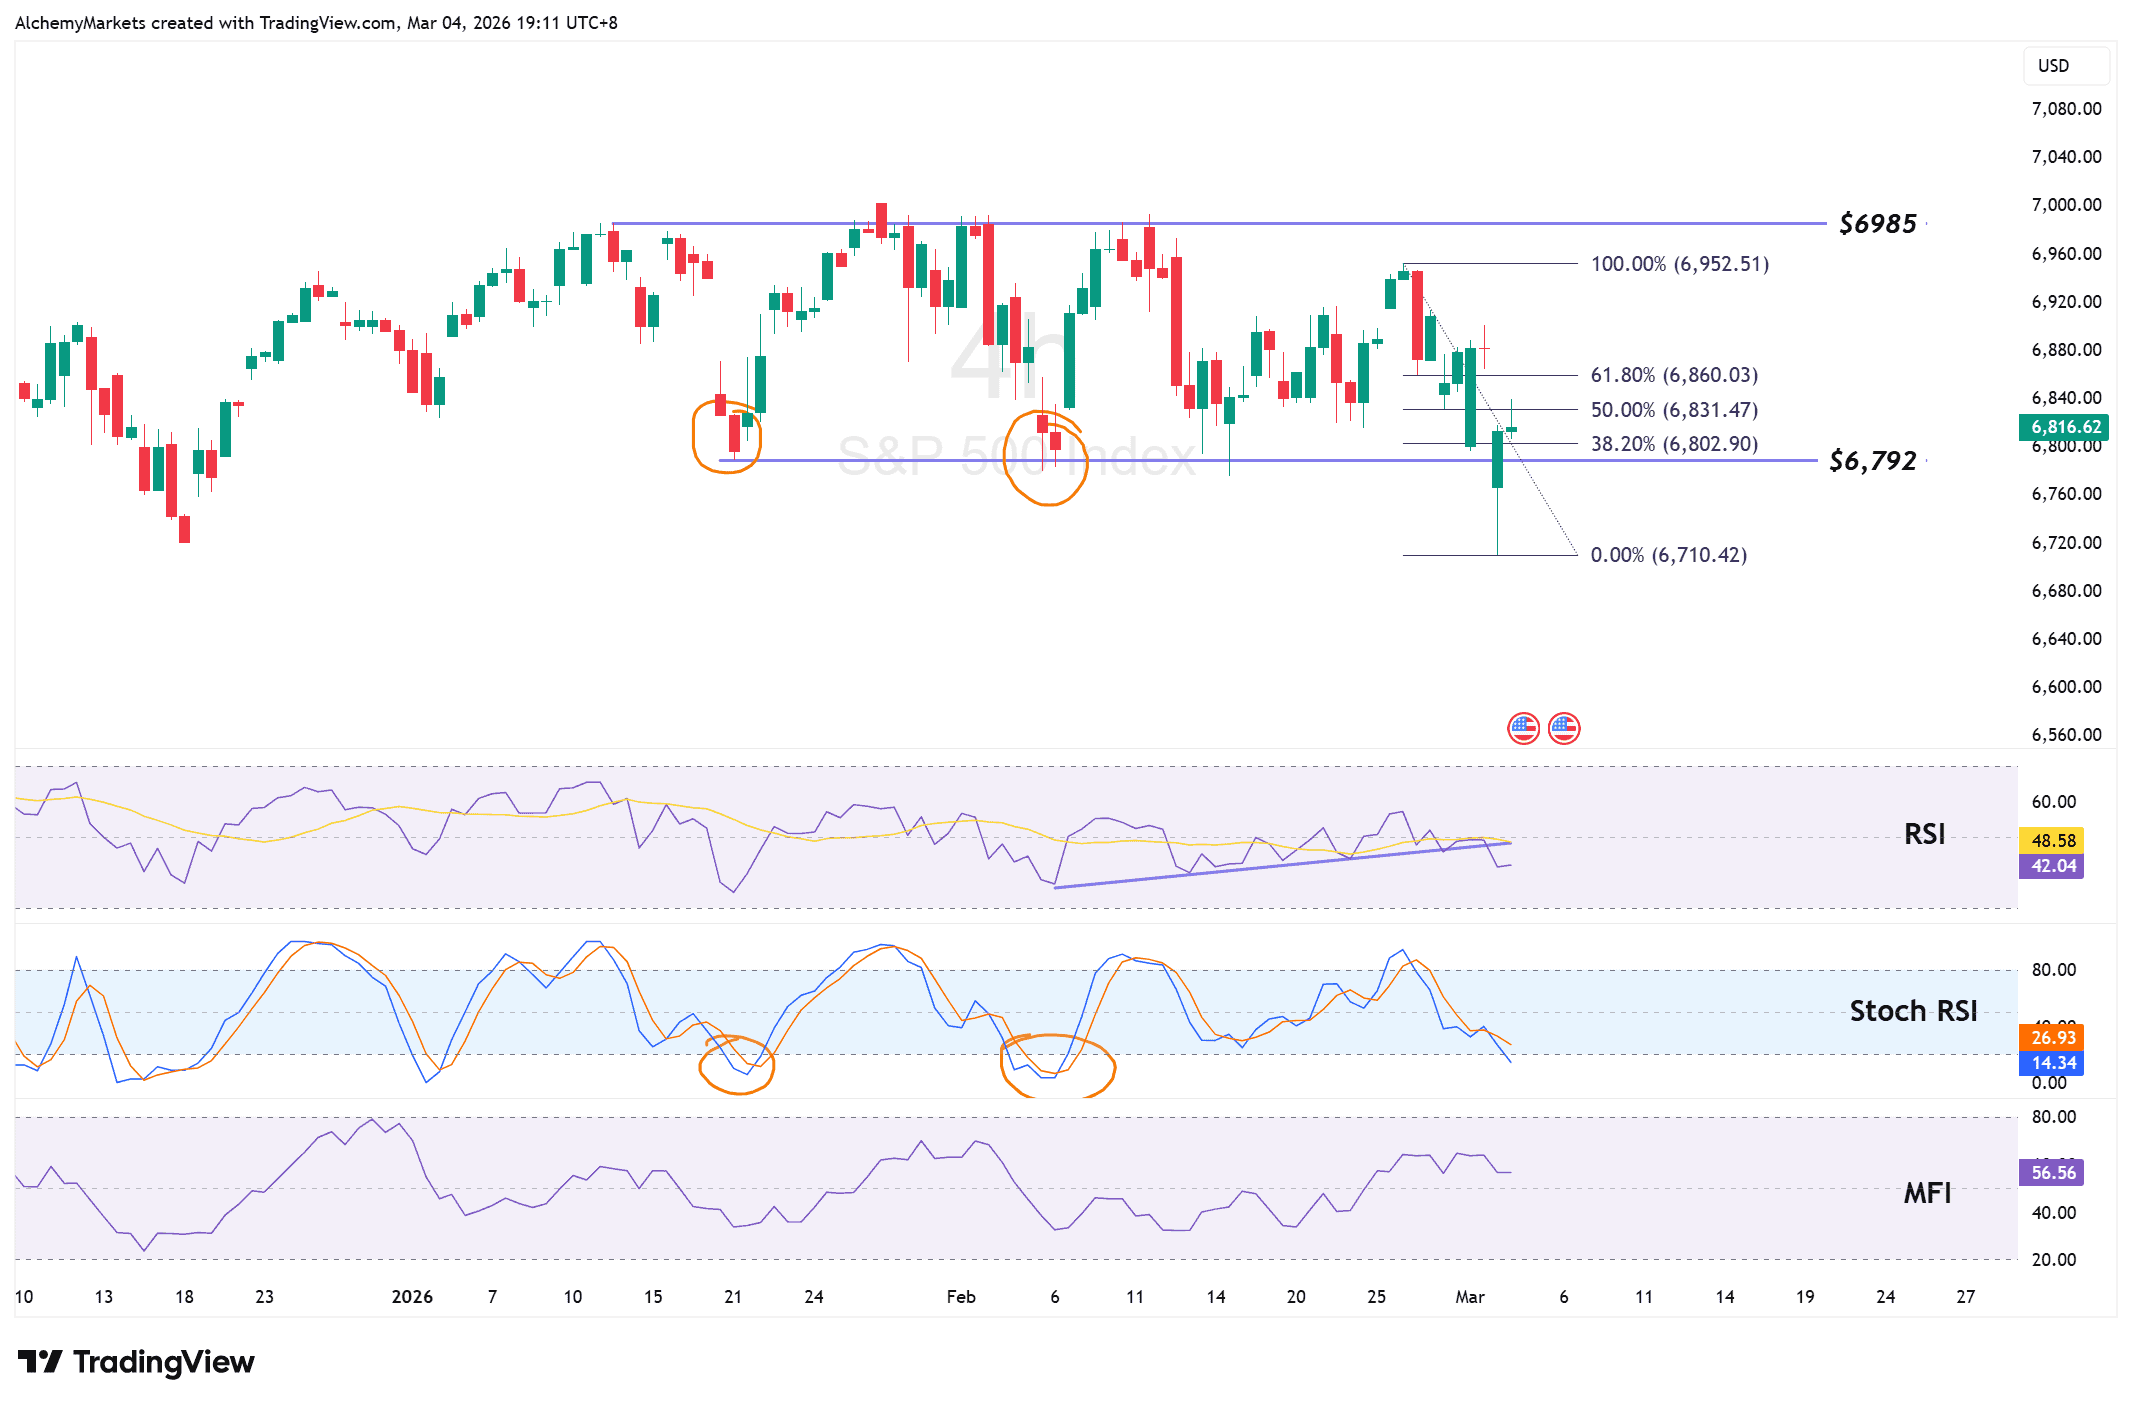
That’s a good sign. But several technical factors to be considered are emerging:
- Across RSI, Stoch RSI, and MFI momentum indicators, there is still more downside to be had.
- RSI has broken a trendline support, and that doesn’t look good for major bullish upside.
- MFI remains elevated and is painting a potential double top signal (Bearish).
- Stochastics RSI still has not printed oversold and a crossover, but is getting close.
These signals point to a potential lower drop to come, but perhaps not by much.
We’re getting close to an inflection point. Should the S&P 500 hold the range, we can continue to expect rangebound behaviour.
Fib levels mark a potential reversal point (to continue the decline) at $6,860, where traders should keep an eye on.
The Bigger Picture: S&P 500 is Still in Uptrend
Despite all the market noise, S&P 500 is still in an uptrend. Zooming out a little, we can see if we use the Bollinger Bands to capture 1 standard deviation from the 4H-EMA 200, that it serves as a beautiful trend filter.
Notice how in August 2024, despite the steep drop, the SPX still held within the band and continued its uptrend. Currently, the band’s lows sits at $6,693, approximately $6,700.
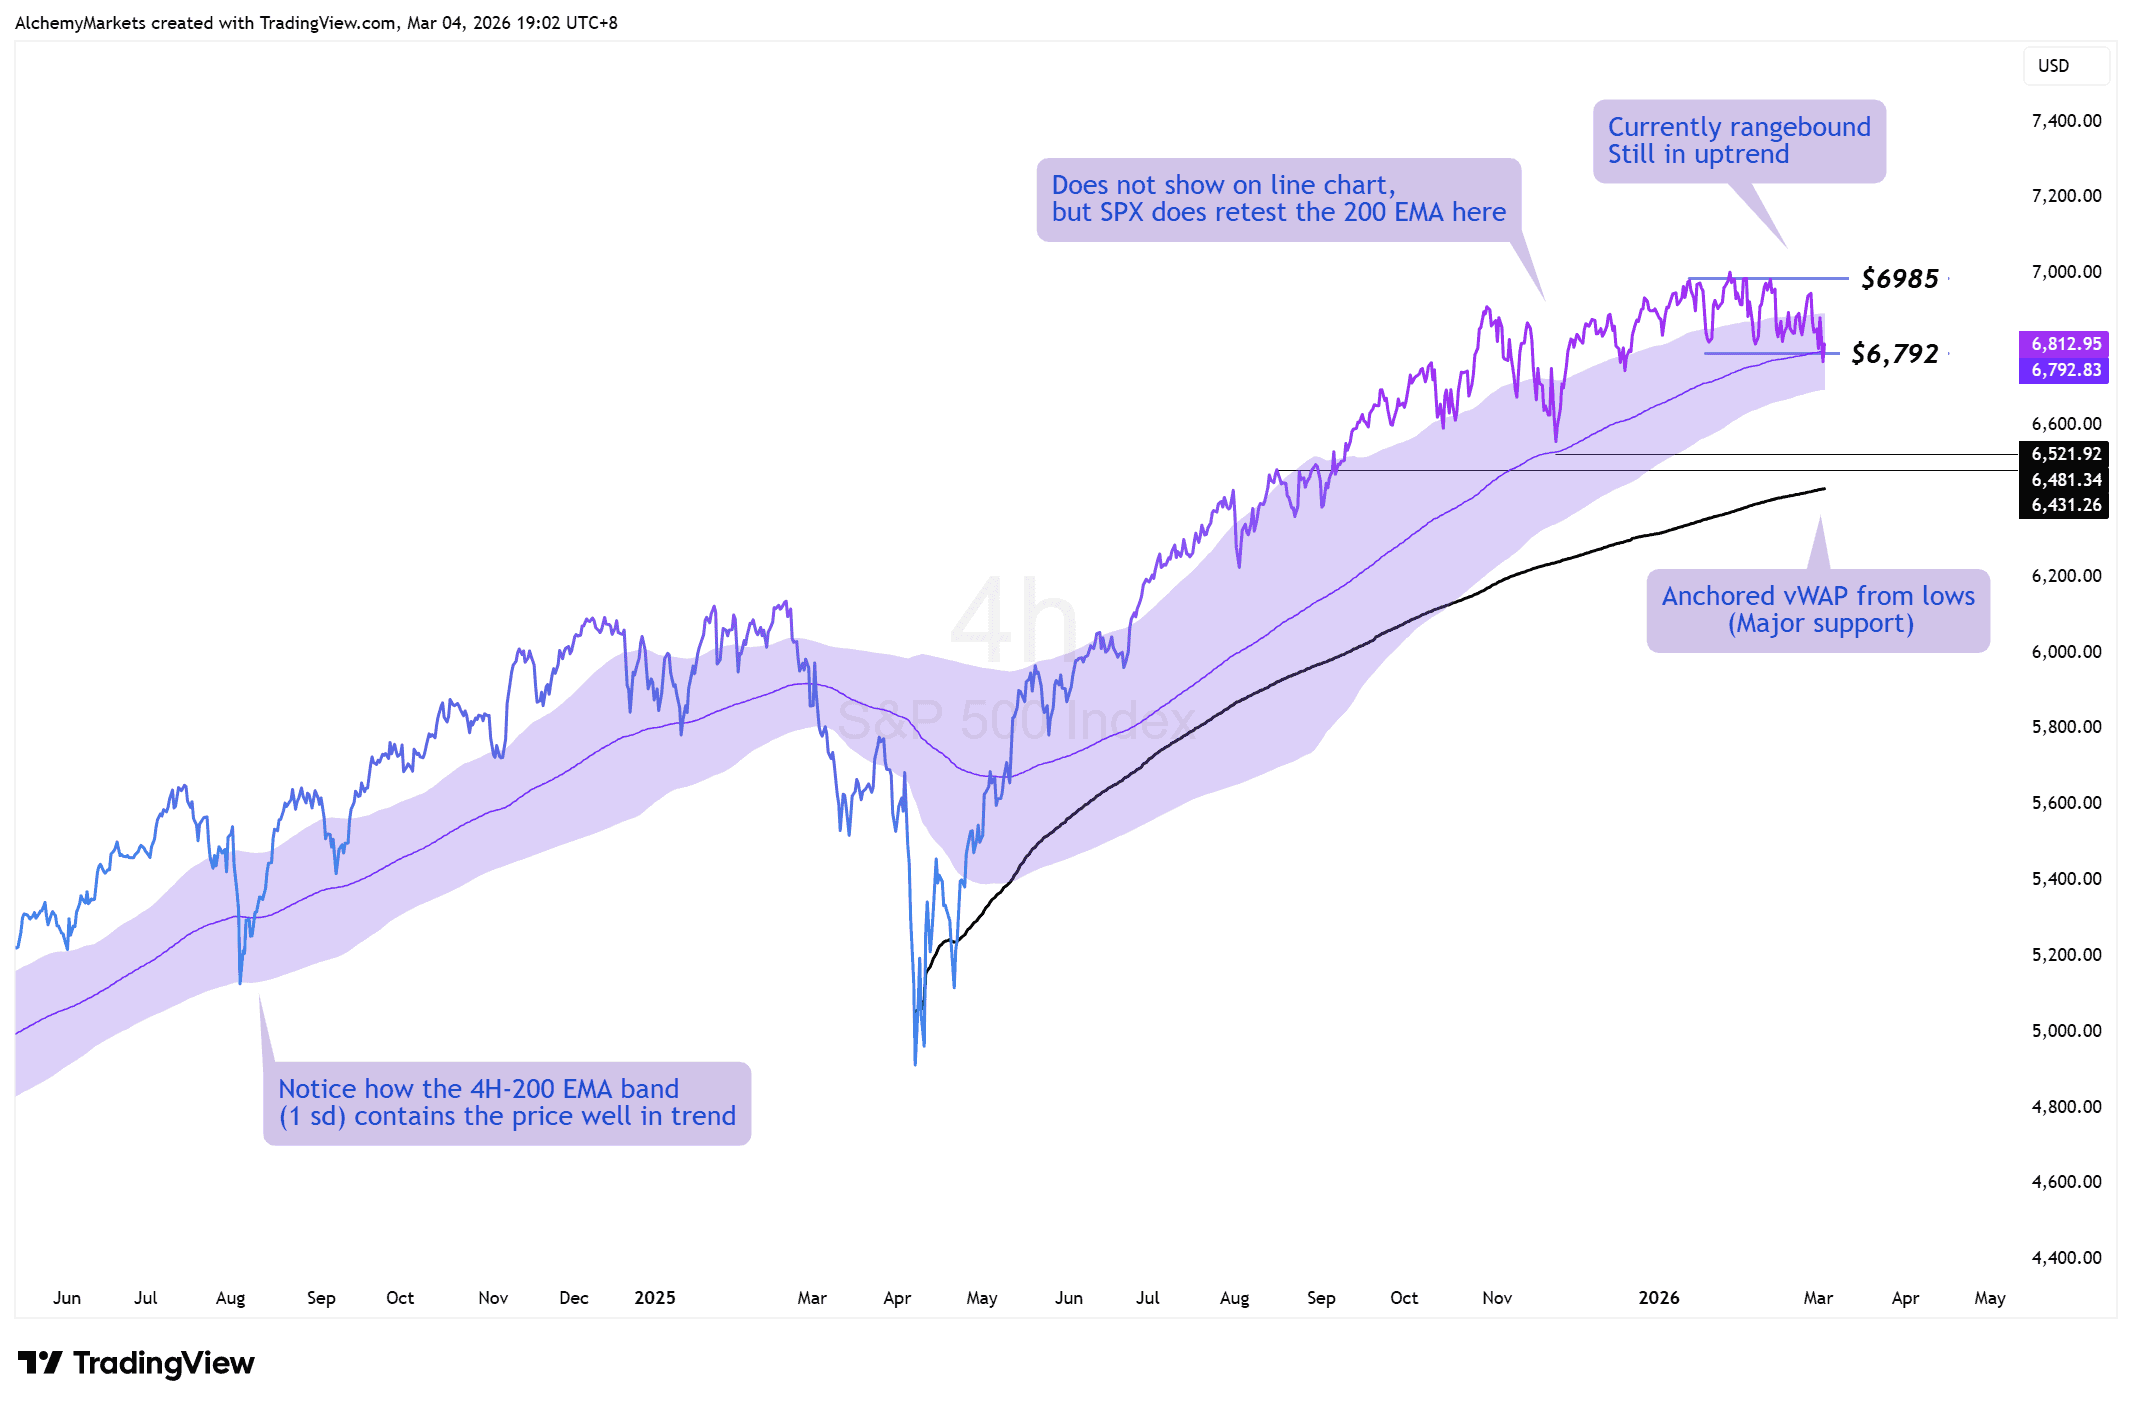
However, we are beginning to see cracks in the rally. The band is beginning to shrink, which is what it did back in early 2025 before cracking below the bands; creating a drop of over 20%.
Now, the price has just retested the 4H-EMA 200 for the second time in the rally (first time in Nov 2025), so we’ll have to see if this support fails. If that happens, look towards $6,700 – and if that fails, the probabilities of a prolonged downtrend on S&P 500 increases.
The bottom line is:
We are still in an uptrend – but momentum indicators suggest lower prices aren’t out of the picture. The play now is to watch these “breach” levels closely to assess S&P 500’s health.


