


Written by:

Reviewed by:

Bearish
- August 26, 2024
- 21 min read
Triple Top Candlestick Pattern – How to Trade it
What Is a Triple Top?
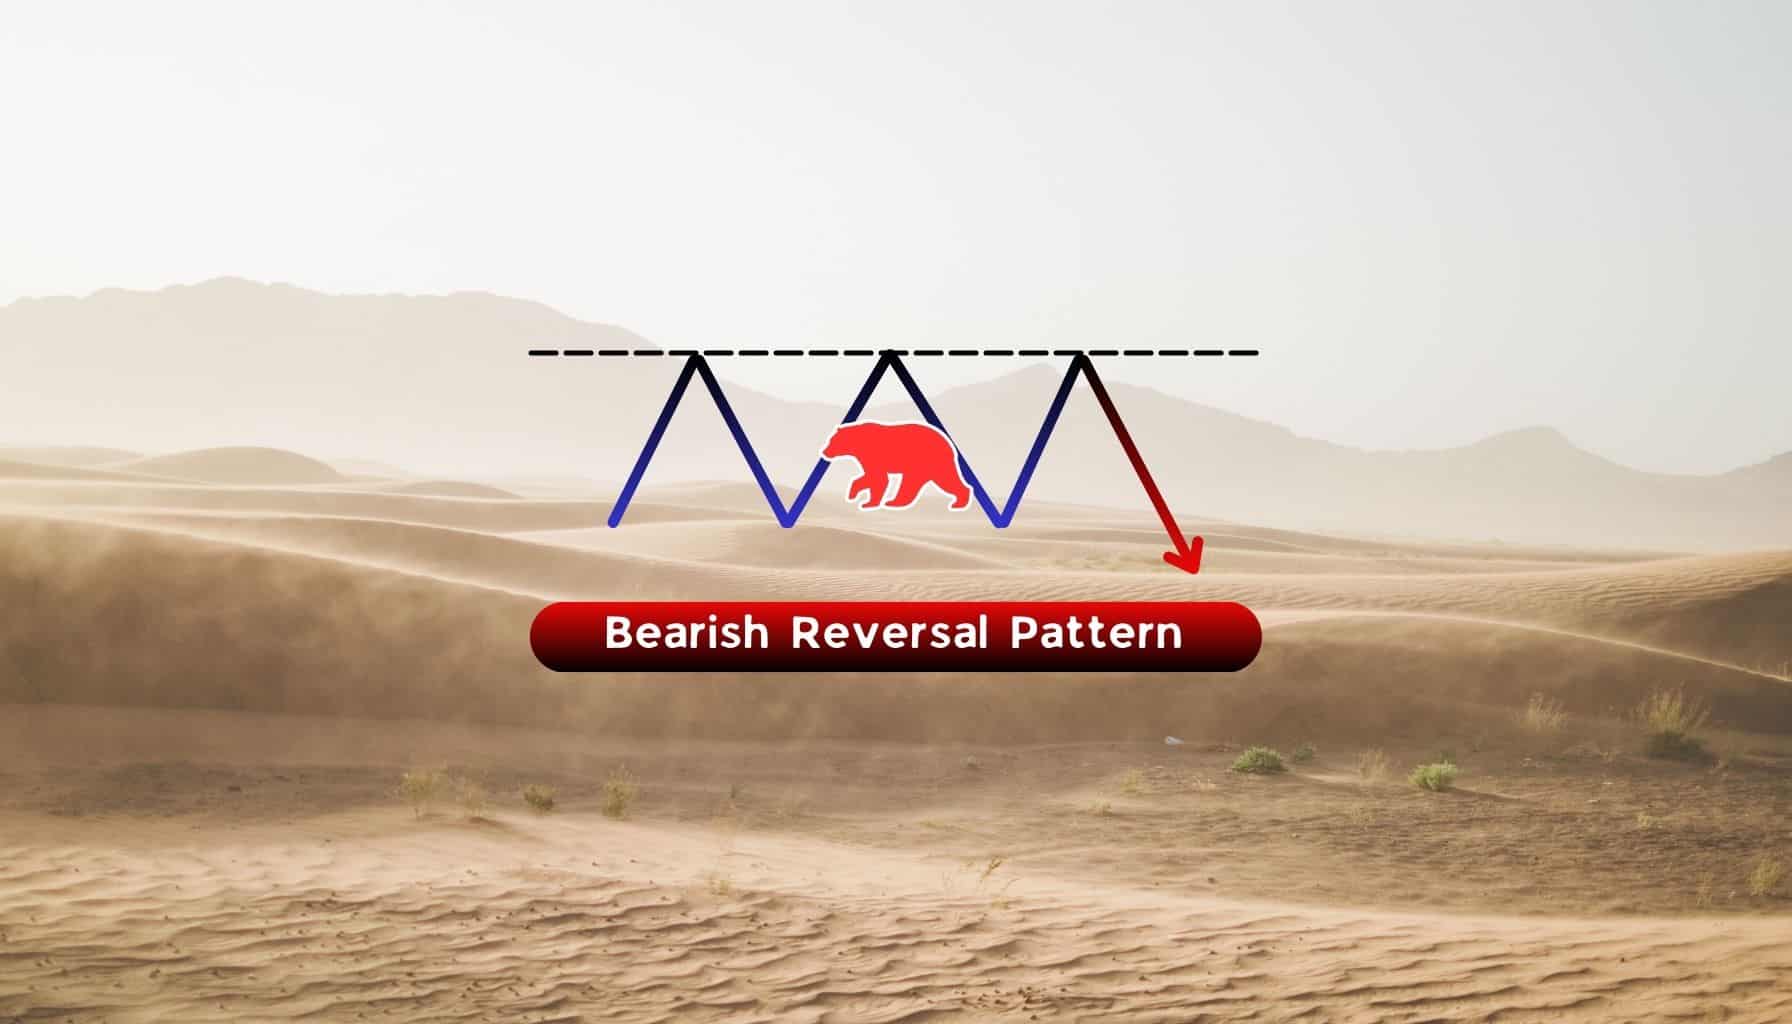
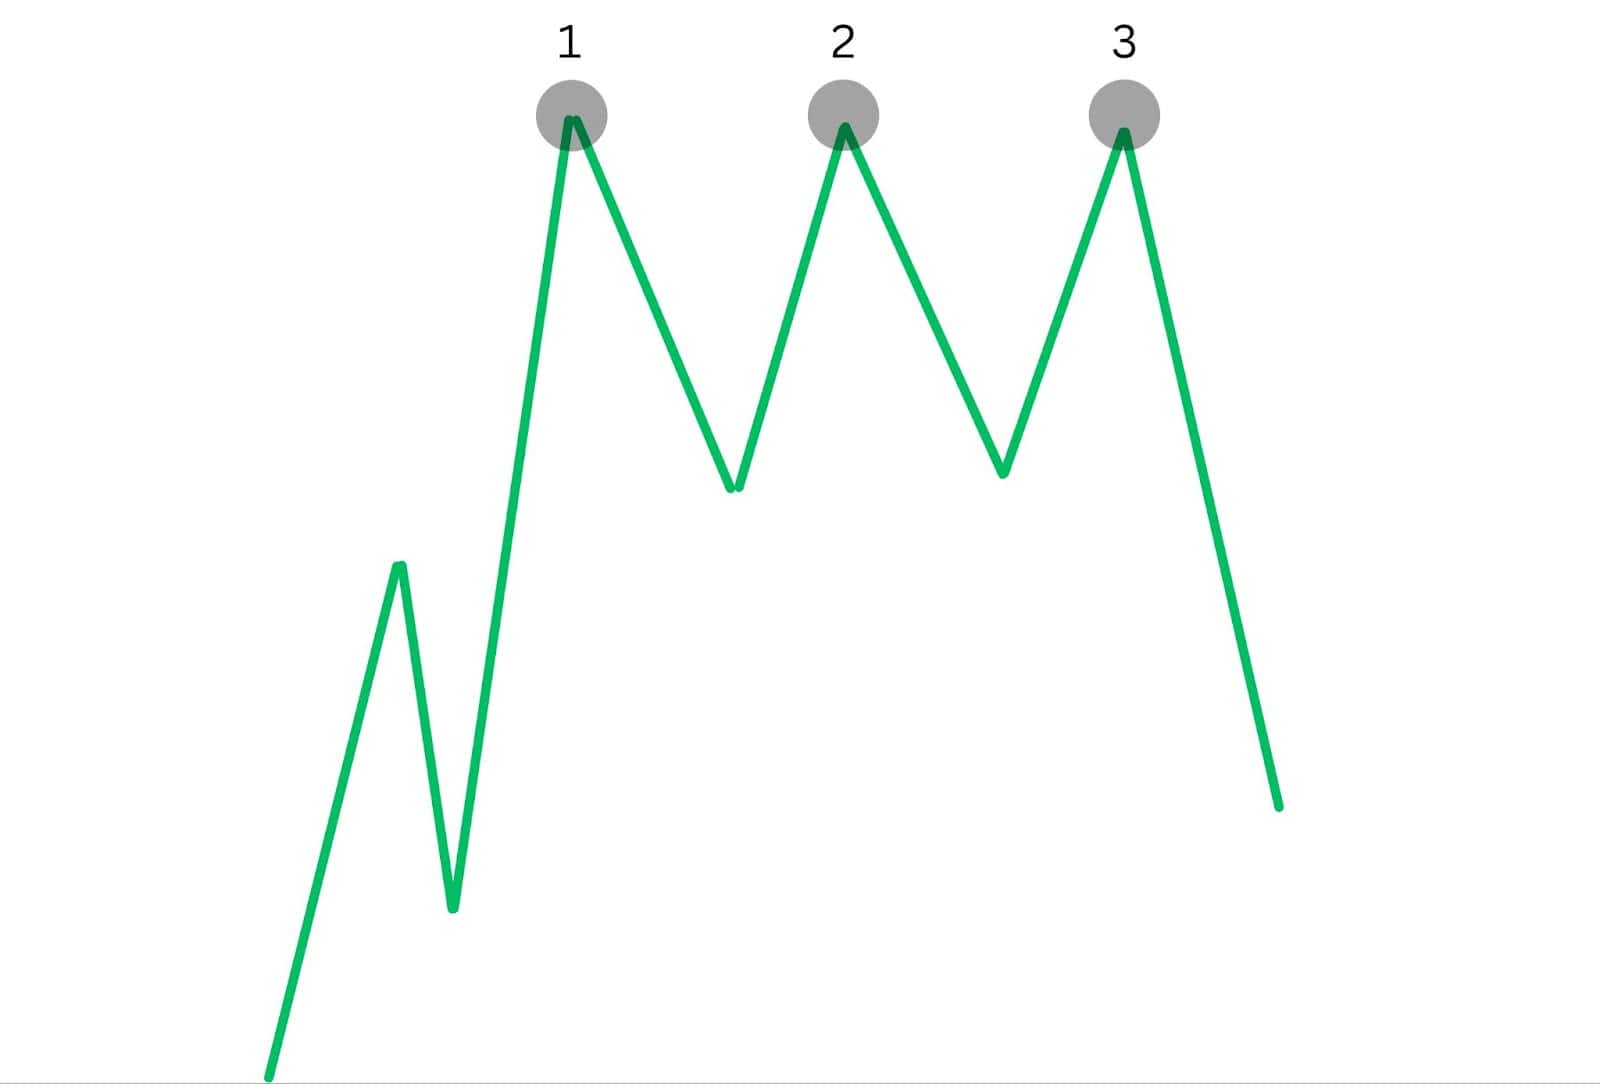
A triple top chart pattern is a bearish reversal chart pattern in technical analysis, characterised by three peaks at a similar price level followed by a break below support. This bearish pattern suggests that the asset is struggling to break through a resistance level, signalling potential shift in trend from up to down.
Traders often see this reversal chart pattern as a clear sign of market exhaustion, where buyers can no longer push the price higher. This pattern, once confirmed, provides a valuable opportunity for traders to anticipate and act on a potential decline in price.
What the Triple Top Pattern Tells Us
The triple top chart pattern is a powerful chart formation that consists of three consecutive highs at nearly the same level within an uptrend. This pattern indicates that there were multiple attempts to break through a horizontal resistance, signalling market exhaustion and a potential bearish reversal. The repeated failure to breach resistance demonstrates that buyers are losing power, and sellers are gaining influence, pointing to a shift in market dynamics.
The triple top chart pattern serves as an early warning of a trend reversal, indicating that bullish momentum is fading at the third peak and bearish pressure is increasing. When technical analysts see a triple top, they recognise that the market sentiment is shifting from bullish enthusiasm to cautious scepticism, suggesting it’s time to consider defensive strategies like tightening the stop loss on long positions, exiting long positions, or initiating short positions.
How Can you Identify a Triple Top Pattern on a Chart?
To identify a triple top pattern on a chart, first look for a sideways consolidation at the end of an uptrend. This pattern is characterised by three peaks at roughly the same level, indicating a strong resistance area that the price struggles to break through. The triple top pattern is versatile and can be found on any chart time frame from monthly to minute.
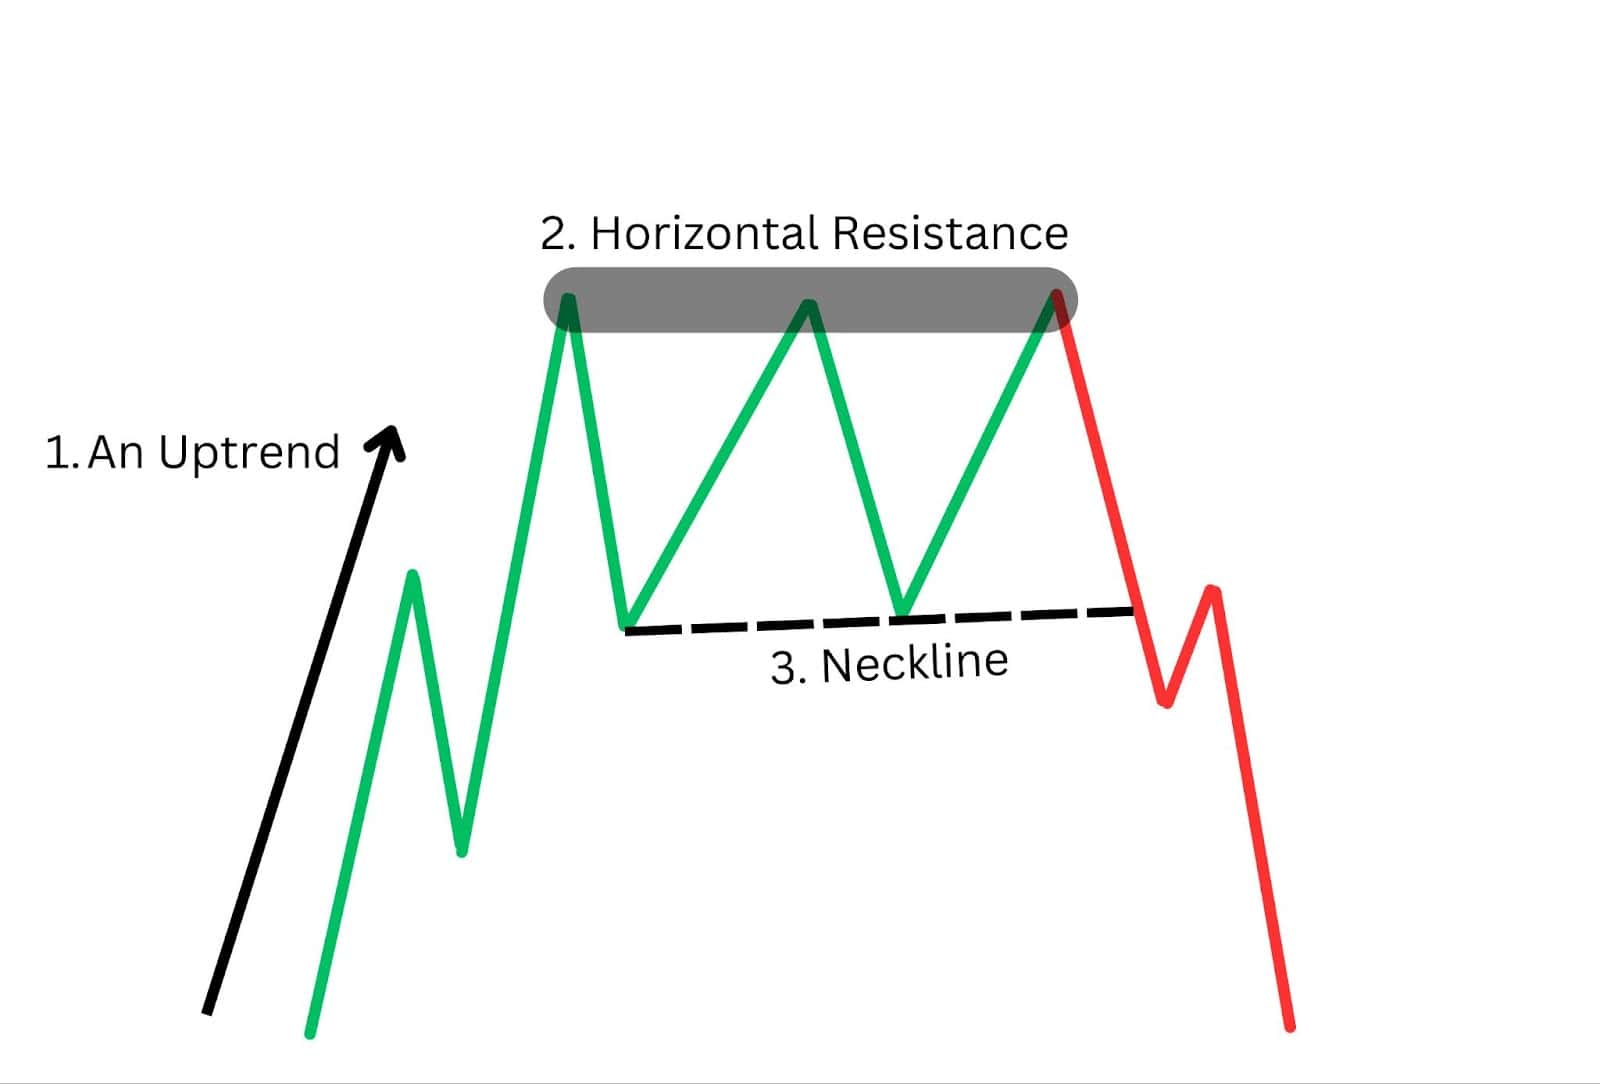
Here are the key elements to identify a triple top pattern:
- An uptrend: The asset’s price must be trading higher, forming higher highs and higher lows.
- Horizontal resistance: A trend line connecting three roughly equal highs.
- Neckline: A support line that connects the lows between the peaks. The break of this neckline signals the activation of the pattern.
Ideal Neckline Characteristics and Risk-to-Reward Ratio
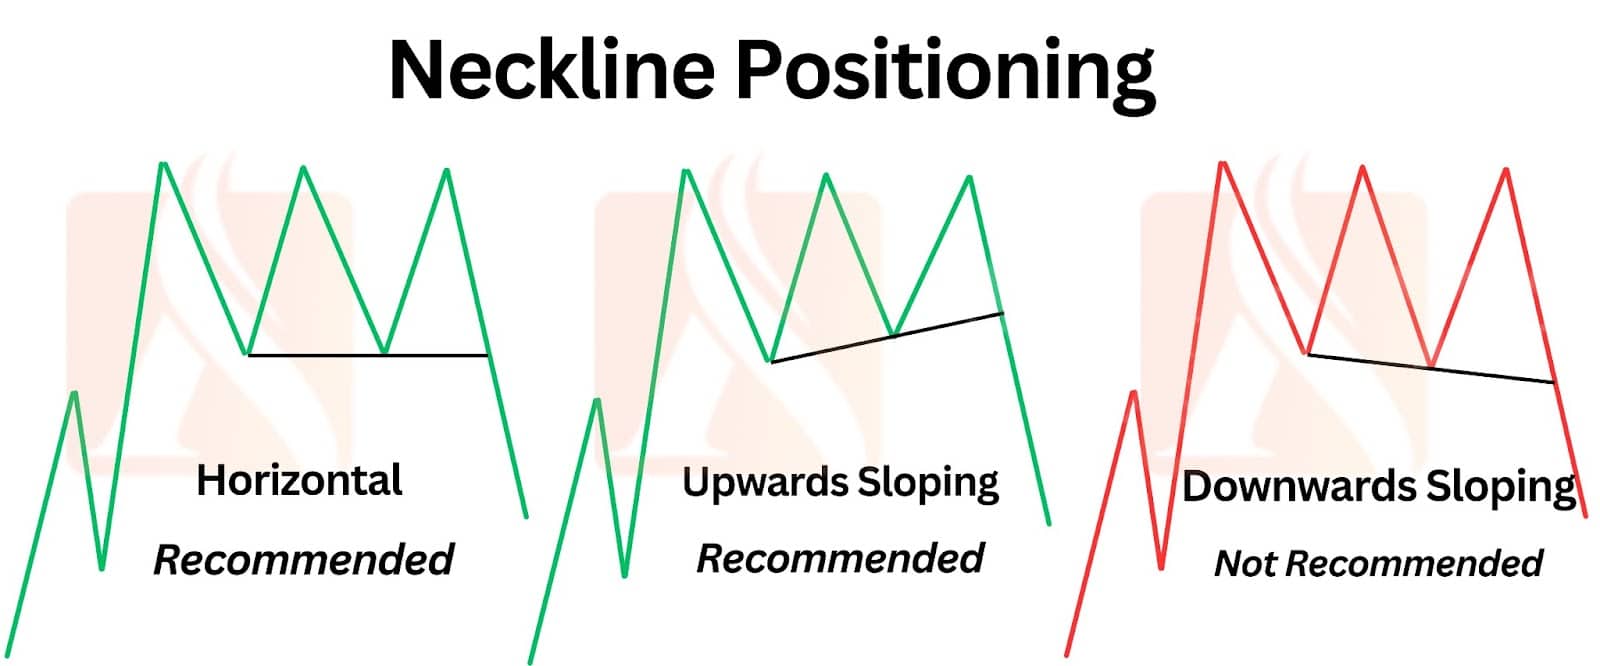
Drawing the neckline is simple. First, spot the two troughs between the three peaks. Then, draw a trendline to connect the lows of the two troughs.The neckline in a triple top pattern can be horizontal, upward-sloping. Ideally not downward-sloping as this will tax the risk to reward ratio of the overall trade and the entry may be too mature into the downward trend.
A horizontal neckline is the most reliable, marking a consistent support level. An upward-sloping neckline can provide a better risk-to-reward ratio by maintaining the uptrend longer until broken. Conversely, a downward-sloping neckline is less ideal from a risk to reward ratio, but does indicate the market is so weak that it gained a head start on creating lower lows.
Prioritising horizontal or upward-sloping necklines offers clearer signals and better risk management in a triple top pattern.
Importance of the Triple Top
The triple top candlestick pattern offers several insights to traders and how they can adjust their position. Here, we delve into the primary reasons why the triple top pattern holds such significance in trading.
Reversal Signal: The primary significance of the triple top is that it signals a potential reversal from an uptrend to a downtrend. This provides traders with an opportunity to exit long positions or enter short positions. By identifying this pattern, traders can anticipate a market shift and adjust their strategies accordingly.
Reliability: Triple tops are considered more reliable than double tops because the formation of a third peak suggests that the resistance level is strong and unlikely to be breached. This adds to the pattern’s credibility as a reversal signal, giving traders greater confidence in their decision to act on it.
Risk Management: Identifying a triple top pattern allows traders to set stop-loss orders above the resistance level, thereby managing their risk. This ensures that potential losses are limited if the pattern fails and the price continues to rise. Effective risk management is crucial for maintaining a healthy trading portfolio.
Profit Target: The distance from the resistance level to the support level (the height of the pattern) can be projected downward from the breakout point to set a profit target which would give the trader a ratio of 1:1 risk to reward. This helps traders plan their trades and set realistic price objectives, providing a clear framework for potential gains.
Confirmation: The breakout below the support level (neckline) provides a clear execution point for bearish positions. This confirmation helps reduce the chances of false signals, making the triple top pattern a useful tool for making informed trading decisions. By waiting for this confirmation, traders can avoid premature entries and improve their chances of success.
How Does Triple Top Pattern Indicate a Trend Reversal?
The triple top pattern reflects the underlying psychology of market participants and their shifting sentiments. Initially, the market is in a strong uptrend, driven by bullish sentiment and optimism. Buyers are confident, pushing the price to new highs as they expect further gains. This upward momentum continues until the price reaches a level where it encounters significant resistance.
Formation of Peaks
The first peak forms as the price hits this resistance level. Early sellers start to take profits, creating a pullback. However, the prevailing bullish sentiment quickly resumes, driving the price back up for a second attempt to break through the resistance. This second peak forms as buyers, still optimistic, push the price upward again. However, the resistance holds firm, and the price pulls back once more.
Shift in Sentiment
By the time the third peak is forming, market psychology begins to shift. The repeated failures to break through the resistance creates doubt among buyers. This doubt grows into anxiety as they realise that despite strong buying efforts, the price cannot sustain new highs. Sellers, on the other hand, gain confidence with each failed attempt, sensing the weakening bullish momentum. Buyers who were once confident become cautious and start exiting their positions, contributing to increased selling pressure. Sellers, emboldened by the repeated failures, become more aggressive. This collective shift in sentiment creates a critical point where the price begins to fall more decisively.
Confirmation of Reversal
The psychological climax occurs when the price breaks below the neckline. This breach is a powerful signal to the market: the buyers have been exhausted, and the sellers have taken control. The break below the neckline represents a new lower low, confirming the shift from bullish to bearish sentiment. Traders who were waiting for confirmation now see the reversal signal clearly, and selling intensifies.
In essence, the triple top pattern encapsulates the psychological journey of the market from optimism and confidence to doubt, anxiety, and ultimately, capitulation. It signals a profound shift in market dynamics, where the balance of power moves from buyers to sellers, marking the transition from an uptrend to a downtrend.
Role of Volume in the Triple Top formation
To add confirmation to the triple top pattern, traders closely monitor volume as the price falls through the neckline support. Heavy volume during this break indicates strong selling interest, reinforcing the validity of the pattern and the likelihood of a sustained downward move. When volume picks up, it shows that many traders are exiting long positions or entering short positions, reflecting a decisive shift in market sentiment, reinforcing the bearish trend that follows.
If volume does not increase significantly during the break, the pattern is more prone to failure. Low volume suggests a lack of conviction among traders, making it more likely that the price might rally or fail to fall as expected. Therefore, volume acts as a crucial confirming indicator, helping traders gauge the strength and reliability of the triple top pattern.
Triple Top Example
AUD/USD – Daily Timeframe
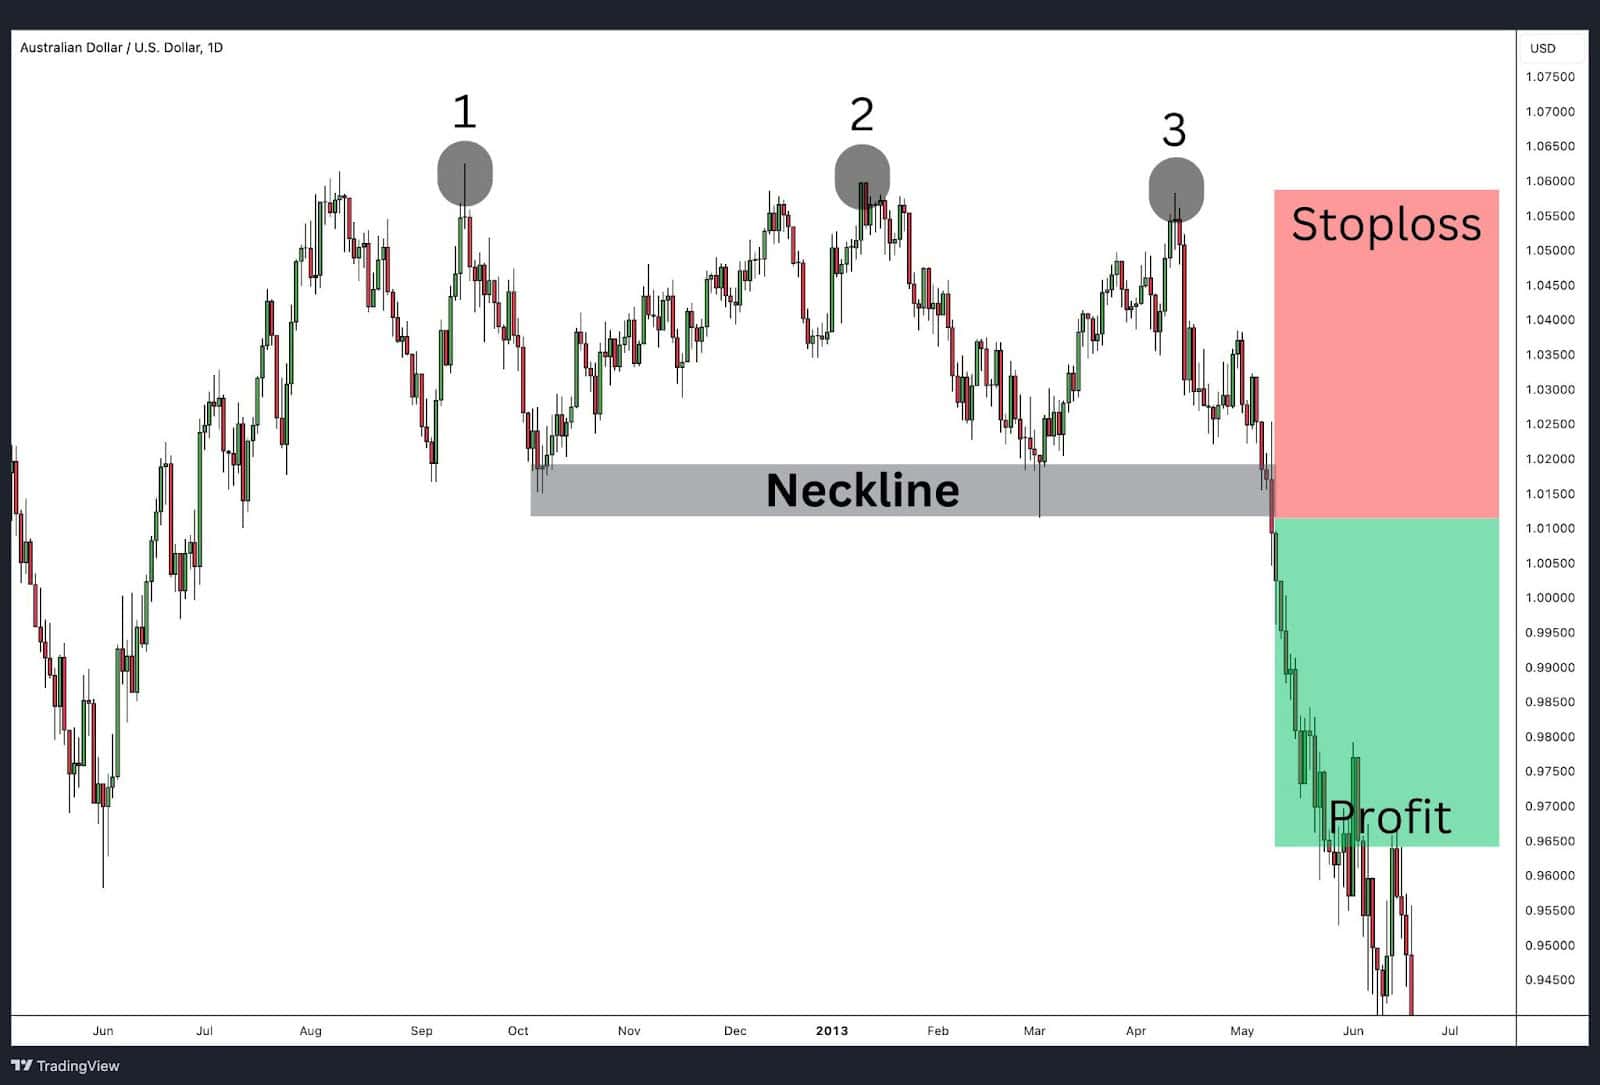
The chart above illustrates a classic triple top pattern in the Australian Dollar/U.S. Dollar (AUD/USD) currency pair on a daily timeframe. This example clearly demonstrates the key features and stages of the pattern, highlighting its significance as a bearish reversal signal.
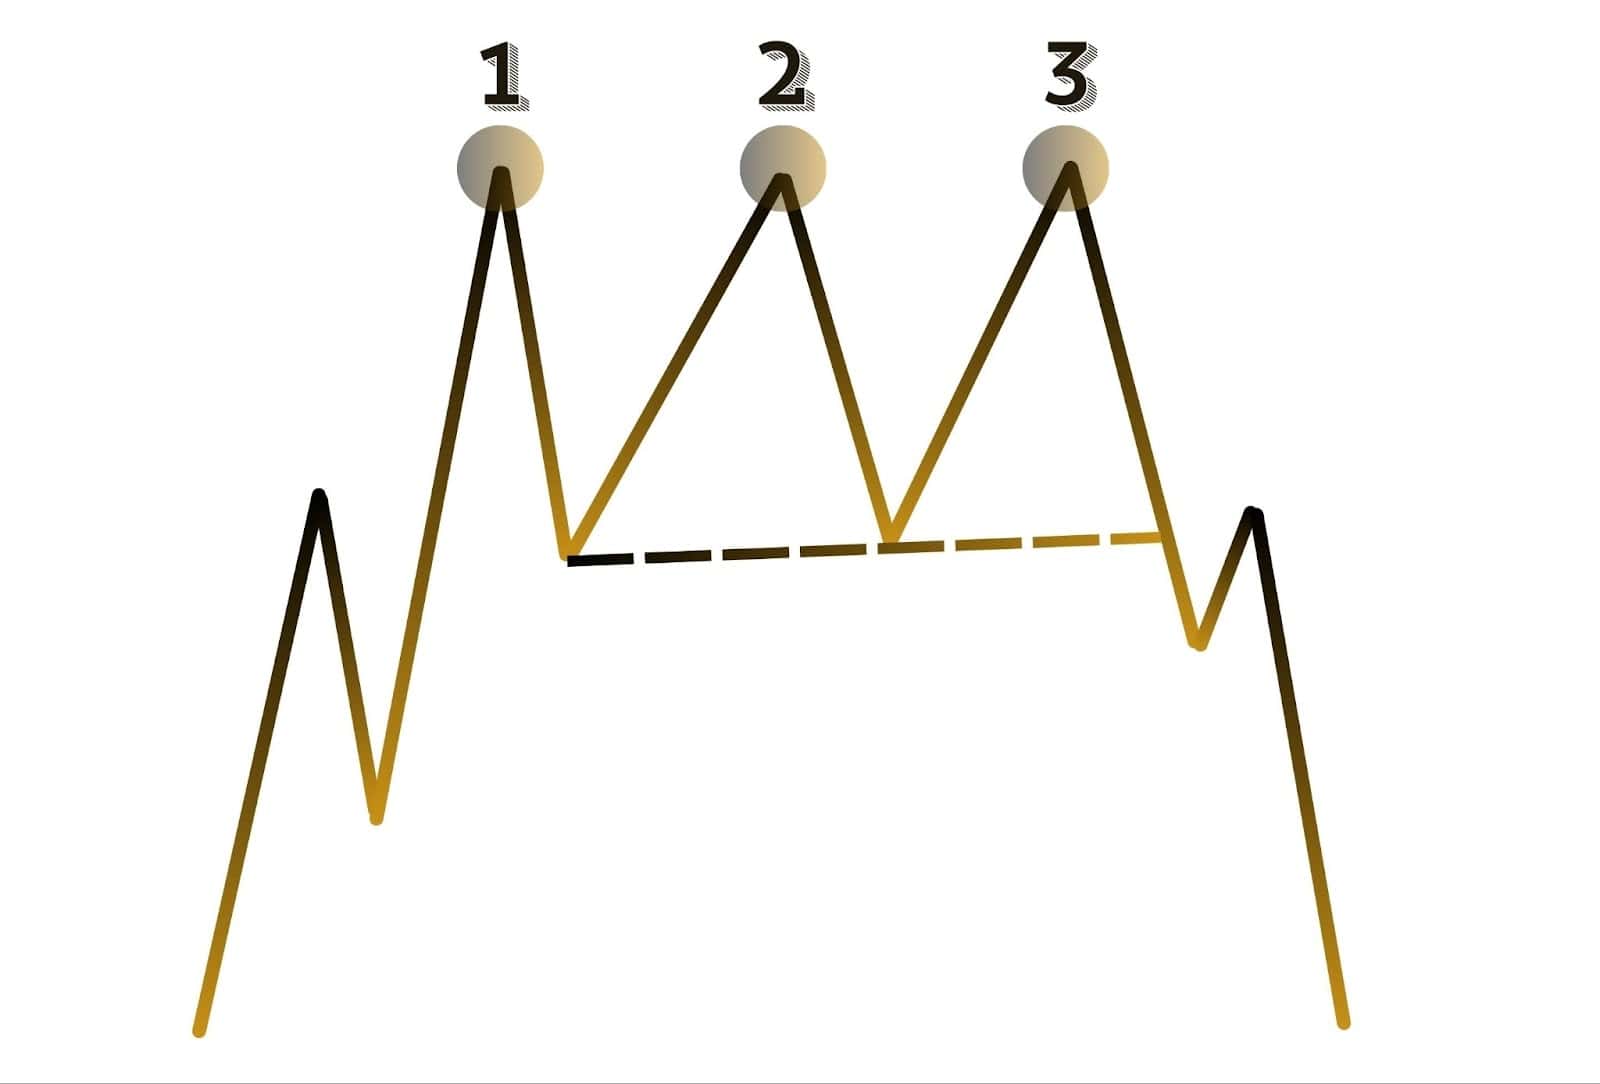
Formation of the Peaks: The pattern begins with an uptrend, where the price rallies and forms the first peak (1). The price then pulls back, to generate the first portion of the neckline before attempting another rally.
The second peak (2) forms at approximately the same level as the first, but the price again fails to break through the resistance. After another pullback to a similar level as the previous pullback, the neckline takes shape.
The price makes a third attempt to breach the resistance, forming the third peak (3), but fails once more.
Resistance and Neckline: The three peaks at roughly the same level indicate a strong resistance zone. The neckline, drawn through the lows between the peaks, serves as a crucial support level.
Break of the Neckline: The decisive moment in this pattern occurs when the price breaks below the neckline support. This break is accompanied by increased selling pressure, confirming the transition from a bullish to a bearish trend. The breach of the neckline signifies that the sellers have taken control, and the market is likely to move lower.
Resulting Downtrend: Following the break of the neckline, the price continues to decline, marking the start of a new downtrend. This validates the triple top pattern as an effective indicator of a trend reversal.
This example underscores the importance of recognising the triple top pattern and monitoring key levels such as the resistance and neckline. Traders who identify these patterns can make informed decisions, managing their risks and capitalising on potential market reversals.
Triple Top Trading Strategies
Breakout Candle Closes Below the Neckline
One straightforward trading strategy for the triple top pattern is to enter a position when the breakout candle closes below the neckline. This method does not involve waiting for a retest; it purely relies on the initial breakout for entry.

Using the AUD/USD example, once the price breaks below the neckline, you enter a short position at the close of the breakout candle. Place the stop-loss just above the third peak to protect against any unexpected upward moves. For the take-profit target, measure the distance between the neckline support and the resistance zone, then project this distance downward from the breakout point. This approach provides a clear and defined risk-to-reward ratio based on the pattern’s structure.
Waiting For a Retest of the Broken Neckline
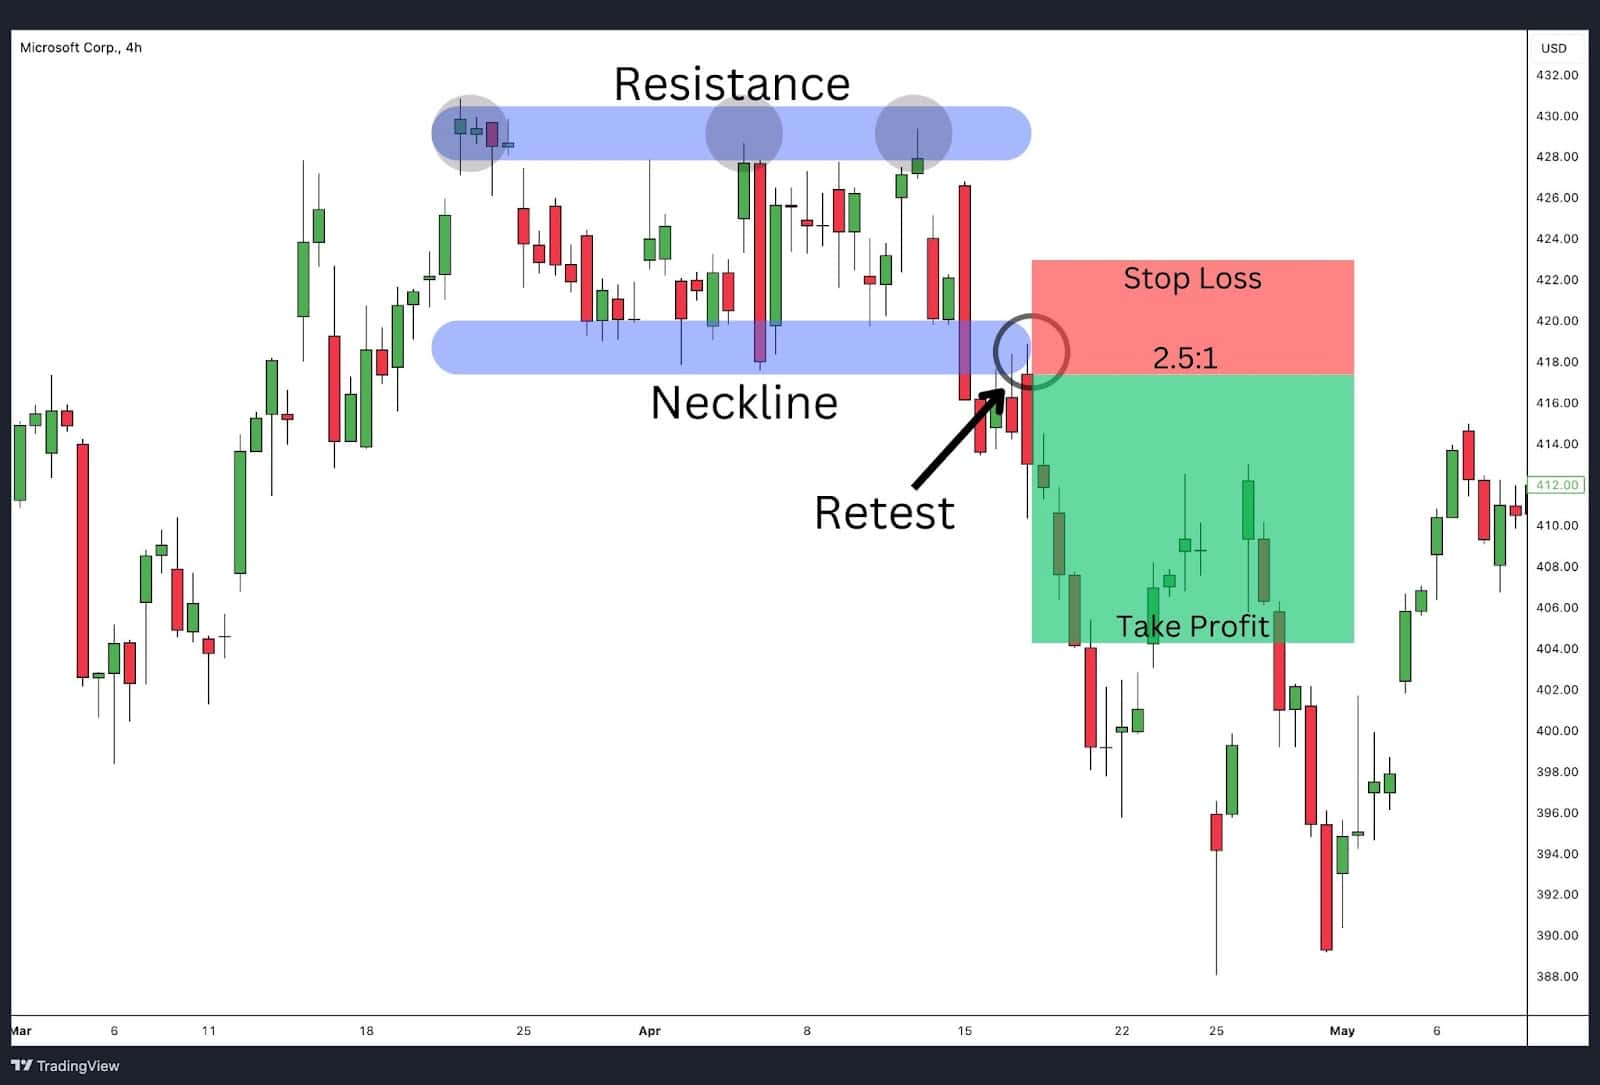
Another effective trading strategy for the triple top pattern is to wait for a retest of the broken neckline before entering a position. This approach involves patience, allowing the price to confirm the new resistance level after the initial breakout.
Using the Microsoft Corp. chart as an example, once the price breaks below the neckline, it subsequently retraces back to retest the neckline. This retest serves as confirmation that the previous support (now resistance) is holding. Enter a short position when the retest is confirmed and the price begins to fall again.
Place the stop-loss just above the neckline to protect against a false breakout. For the take-profit target, measure the distance between the resistance zone and the neckline, then project this distance downward from the neckline. This strategy allows for a more confirmed entry, potentially reducing the risk of premature or false signals. With this more aggressive approach, trader’s can receive more than the conventional 1:1 risk to reward and instead can expect risk rewards such as 2.5:1 instead as demonstrated in the above example.
Advantages of the Triple Top Pattern
Clear Reversal Signal:
- The triple top pattern provides a clear and well-defined signal of a potential trend reversal from bullish to bearish, helping traders make informed decisions.
Reliable Pattern:
- Triple tops are considered more reliable than double tops because the formation of a third peak suggests strong resistance that is unlikely to be breached.
Risk Management:
- The pattern allows traders to set precise stop-loss levels above the third peak and take-profit targets by measuring the distance between the neckline and resistance zone.
Confirmation through Volume:
- An increase in volume during the break of the neckline can provide additional confirmation, enhancing the reliability of the pattern.
Clear Entry Points:
- The breakout below the neckline or a retest of the neckline provides clear entry points, reducing ambiguity in trading decisions.
Predictable Profit Targets:
- The height of the pattern can be used to project profit targets, allowing traders to set realistic and achievable goals.
Disadvantages of the Triple Top Pattern
Rarity:
- Triple top patterns are relatively rare chart formation compared to other chart patterns, such as double tops, making them less frequent opportunities.
Potential for False Breakouts:
- There is always a risk of false breakouts, where the price briefly breaks the neckline but then reverses, leading to potential losses.
Time-Consuming to Identify:
- Identifying a triple top pattern requires patience and time as it develops over multiple peaks, which may not align with traders looking for quicker setups.
Volume Confirmation Required:
- The pattern is more prone to failure if the breakout is not accompanied by increased volume, making volume analysis essential.
Market Conditions Dependency:
- The effectiveness of the triple top pattern can be influenced by broader market conditions and external factors, which may affect its reliability.
Complexity in Setting Targets:
- While the pattern provides a method to set profit targets, the actual achievement of these targets can be influenced by market volatility and other unpredictable factors.
Triple Top vs Double Top
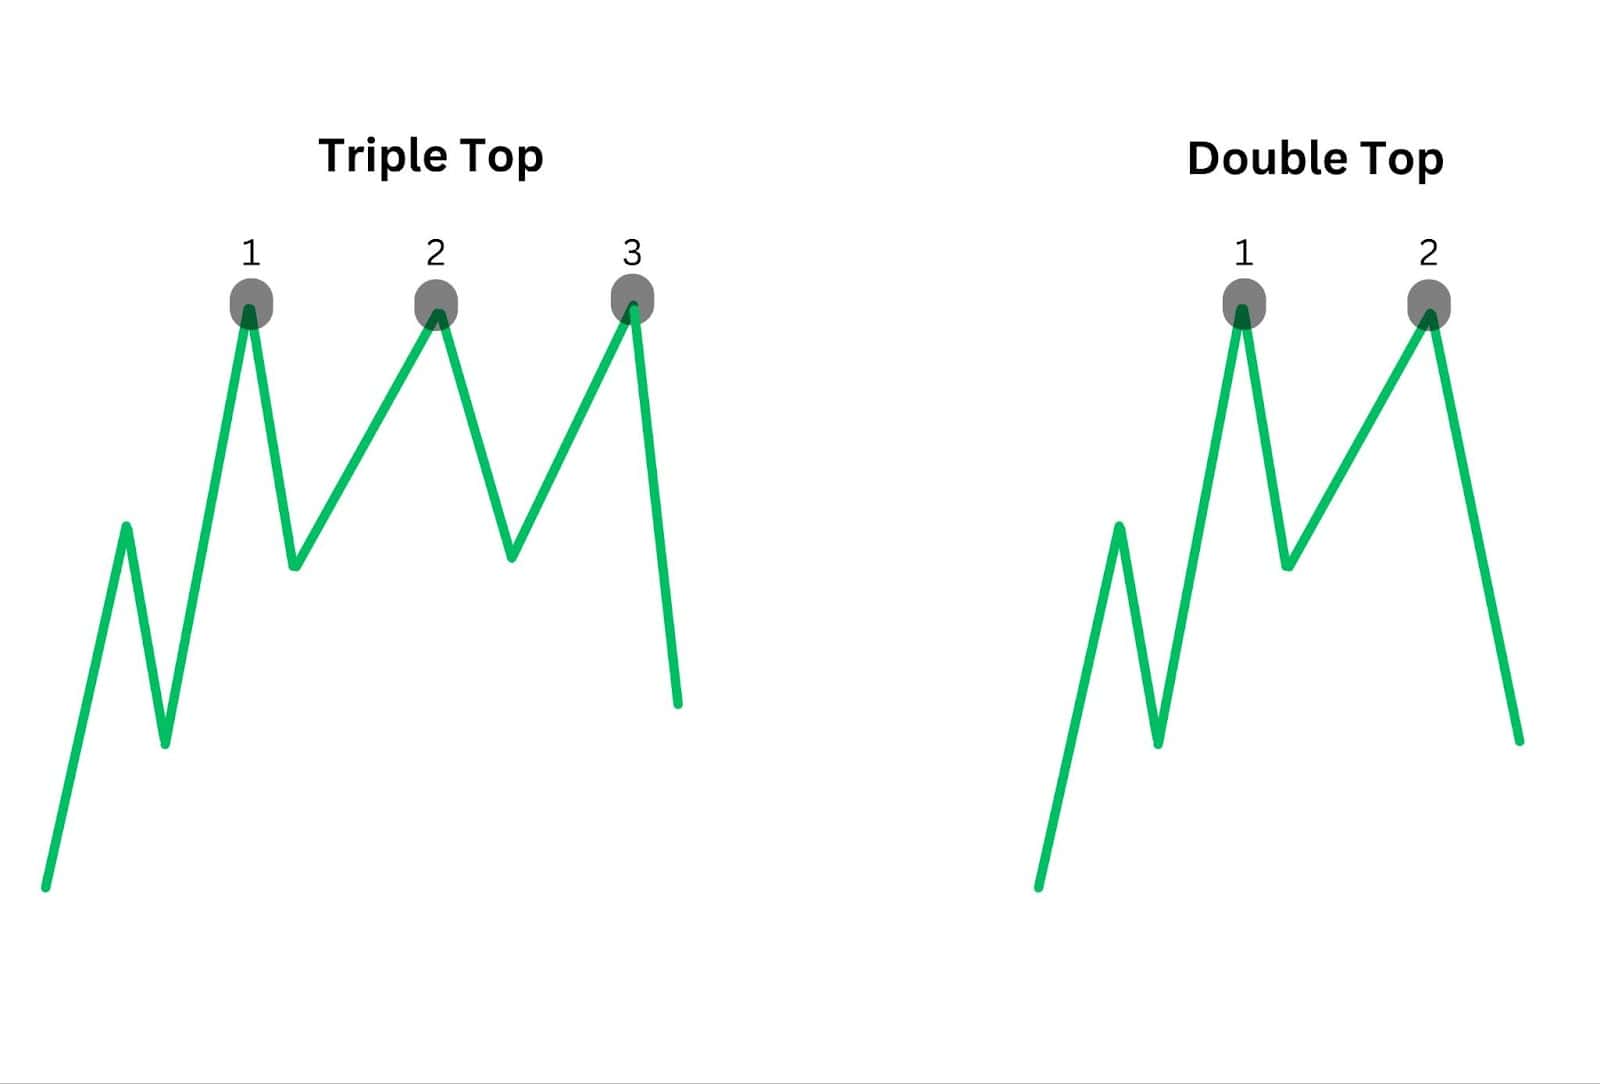
The triple top and double top are both bearish reversal patterns that signal a potential change from an uptrend to a downtrend. The primary difference lies in the number of peaks: a double top features two peaks at roughly the same level, while a triple top has three. The formation of a third peak in a triple top often provides a stronger indication of resistance and market exhaustion, making the pattern more reliable for some traders. This additional peak helps confirm that the resistance level is robust and that the bullish momentum is weakening significantly.
However, the triple top pattern is relatively rare compared to the double top, as it takes longer to form and requires more patience from traders. While the double top can provide quicker signals for entry, it might be more prone to false breakouts and less reliable in some cases.
On the other hand, the triple top, with its added confirmation from the third peak, can offer greater confidence in predicting a bearish reversal. Both patterns are valuable tools in technical analysis, but the choice between using a triple top or a double top may depend on a trader’s preference for reliability versus timeliness in their trading strategy.
Triple Top vs Triple Bottom
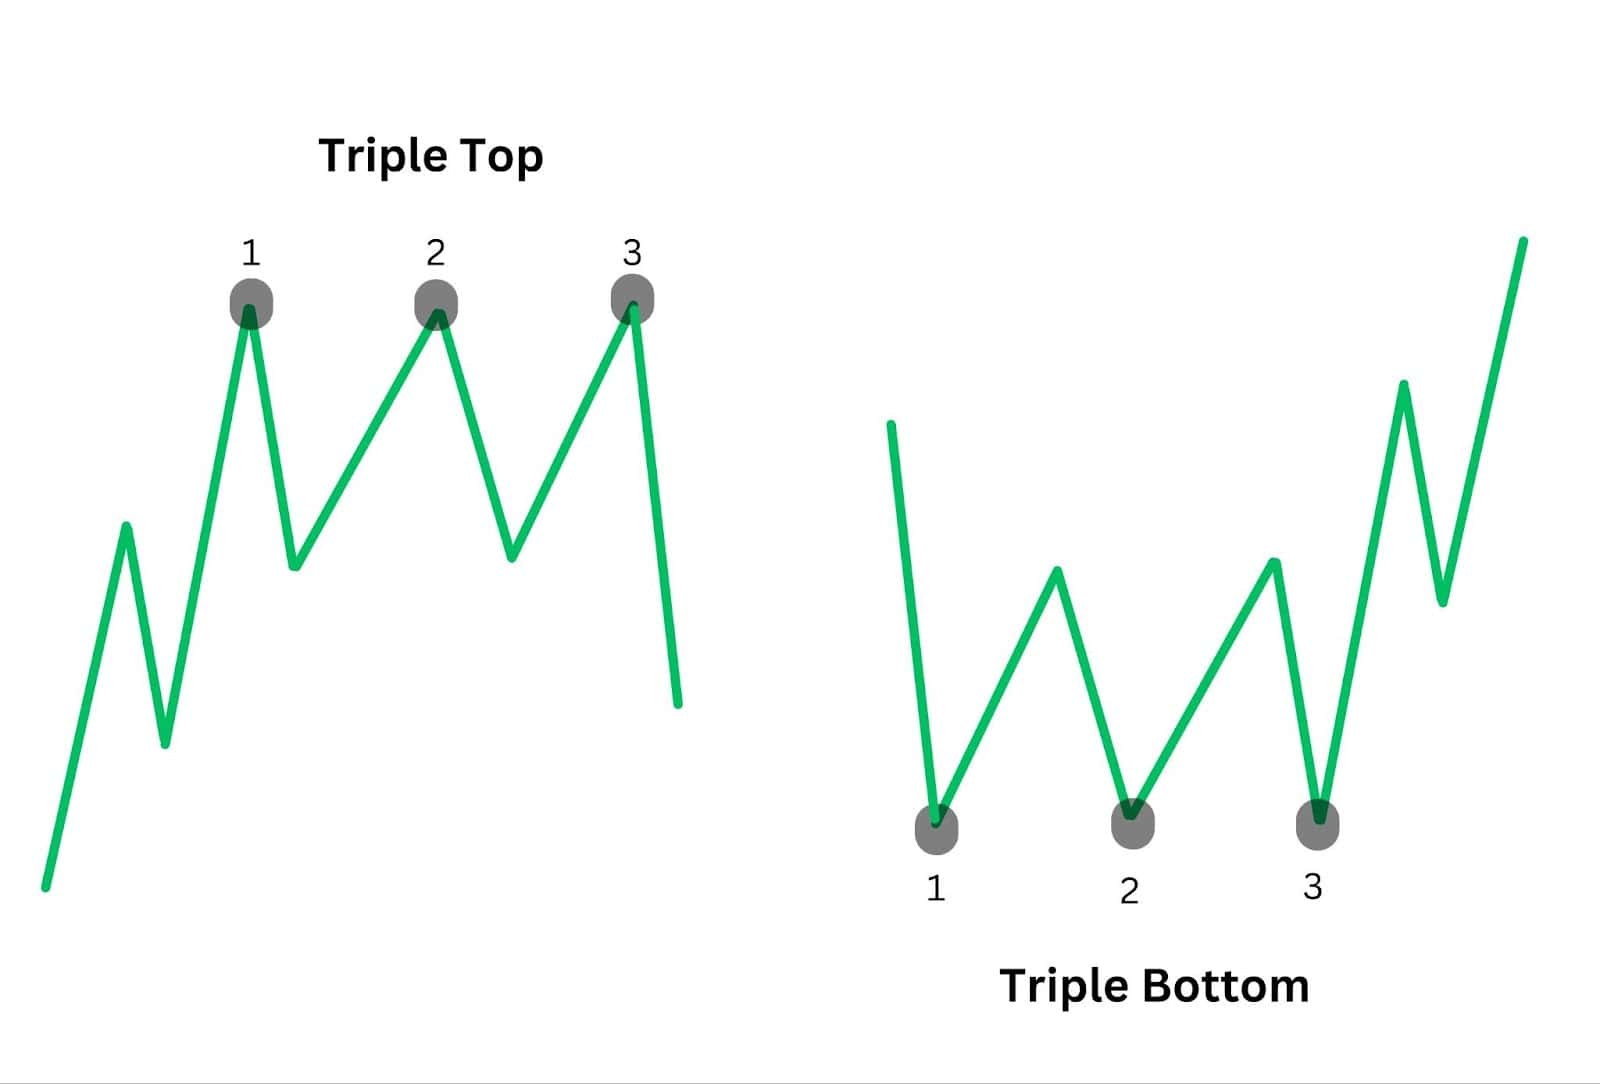
The triple top and triple bottom pattern both act as major reversal patterns in technical analysis, but they indicate different market directions. A triple top is a bearish reversal pattern, signalling a shift from an uptrend to a downtrend. It forms when the price reaches a resistance level three times and fails to break through, suggesting that the buying pressure is exhausted and selling pressure is taking over. This pattern helps traders anticipate a decline in price, providing opportunities to exit long positions or enter short positions.
Conversely, a triple bottom is a bullish reversal chart pattern, indicating a change from a downtrend to an uptrend. This pattern occurs when the price hits a support level three times and fails to break below it, demonstrating that selling pressure is weakening and buying pressure is gaining strength.
Traders use the triple bottom chart pattern to identify potential entry points for long positions, as it suggests that the market sentiment is shifting towards optimism. Both patterns are valuable for identifying potential reversals, but they operate in opposite market conditions, with the triple top indicating bearishness and the triple bottom signalling bullishness.
Triple Top vs Head and Shoulders

The triple top and head and shoulders patterns are both classic reversal formations in technical analysis, but they differ in structure and the signals they provide. The triple top pattern consists of three peaks at roughly the same level, indicating strong resistance and signalling a shift from an uptrend to a downtrend. Its simplicity lies in the uniform height of the peaks, making it a clear indicator of resistance exhaustion and potential bearish reversal.
In contrast, the head and shoulders pattern is more complex, featuring three distinct peaks; a peak (the head) between two lower peaks (the shoulders). This pattern also signals a reversal from an uptrend to a downtrend, but its structure suggests a more distinct shift in market sentiment.
The head and shoulders pattern is often considered more reliable due to its clear delineation of highs and lows, making it a favourite among traders for its definitive signal of trend reversal. While both patterns are valuable for identifying potential market reversals, the head and shoulders pattern is generally viewed as more robust and provides a clearer signal of an impending downtrend compared to the triple top.
Triple Top vs Ascending Triangle
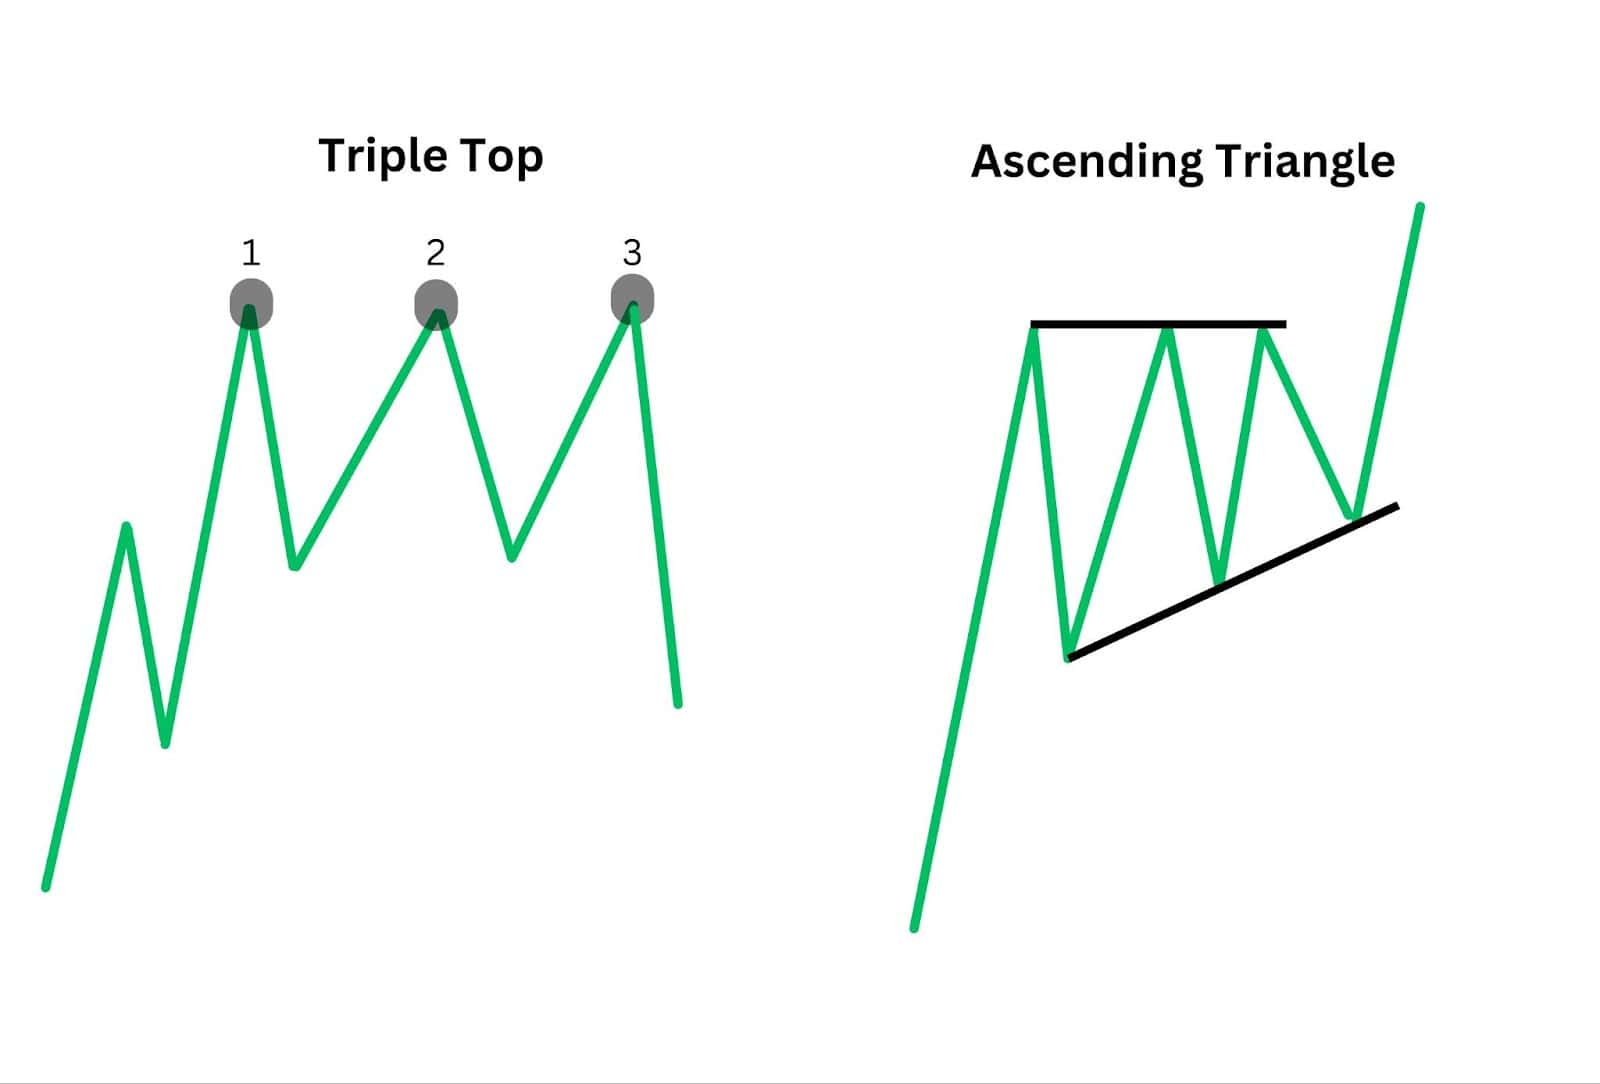
The triple top and ascending triangle are both important patterns in technical analysis, but they serve different purposes and indicate different market behaviours. The triple top is a bearish reversal pattern that forms when the price reaches a resistance level and is rejected in three consecutive attempts to break through, indicating that the buying pressure is exhausted. This pattern signals a potential shift from an uptrend to a downtrend, providing traders with an opportunity to exit long positions or enter short positions.
In contrast, the ascending triangle is generally a bullish continuation pattern, although it can sometimes act as a reversal. It is characterised by a horizontal resistance line at the top and an upward-sloping trendline at the bottom, indicating increasing buying pressure. During the ascending triangle development, the price continues to make higher lows while repeatedly testing the resistance level, thereby increasing the likelihood of a bullish breakout.
Although the ascending trendline of the triangle resembles the upward sloping neckline in the triple top, the outcome provides a clue to the pattern. Traders interpret an ascending triangle as a sign of consolidation before the price continues to move higher, and they often look for a bullish breakout to enter long positions.
The triple top pattern, on the other hand, depicts an inability for price to punch higher and signals a potential bearish reversal.
Triple Top vs Evening Star
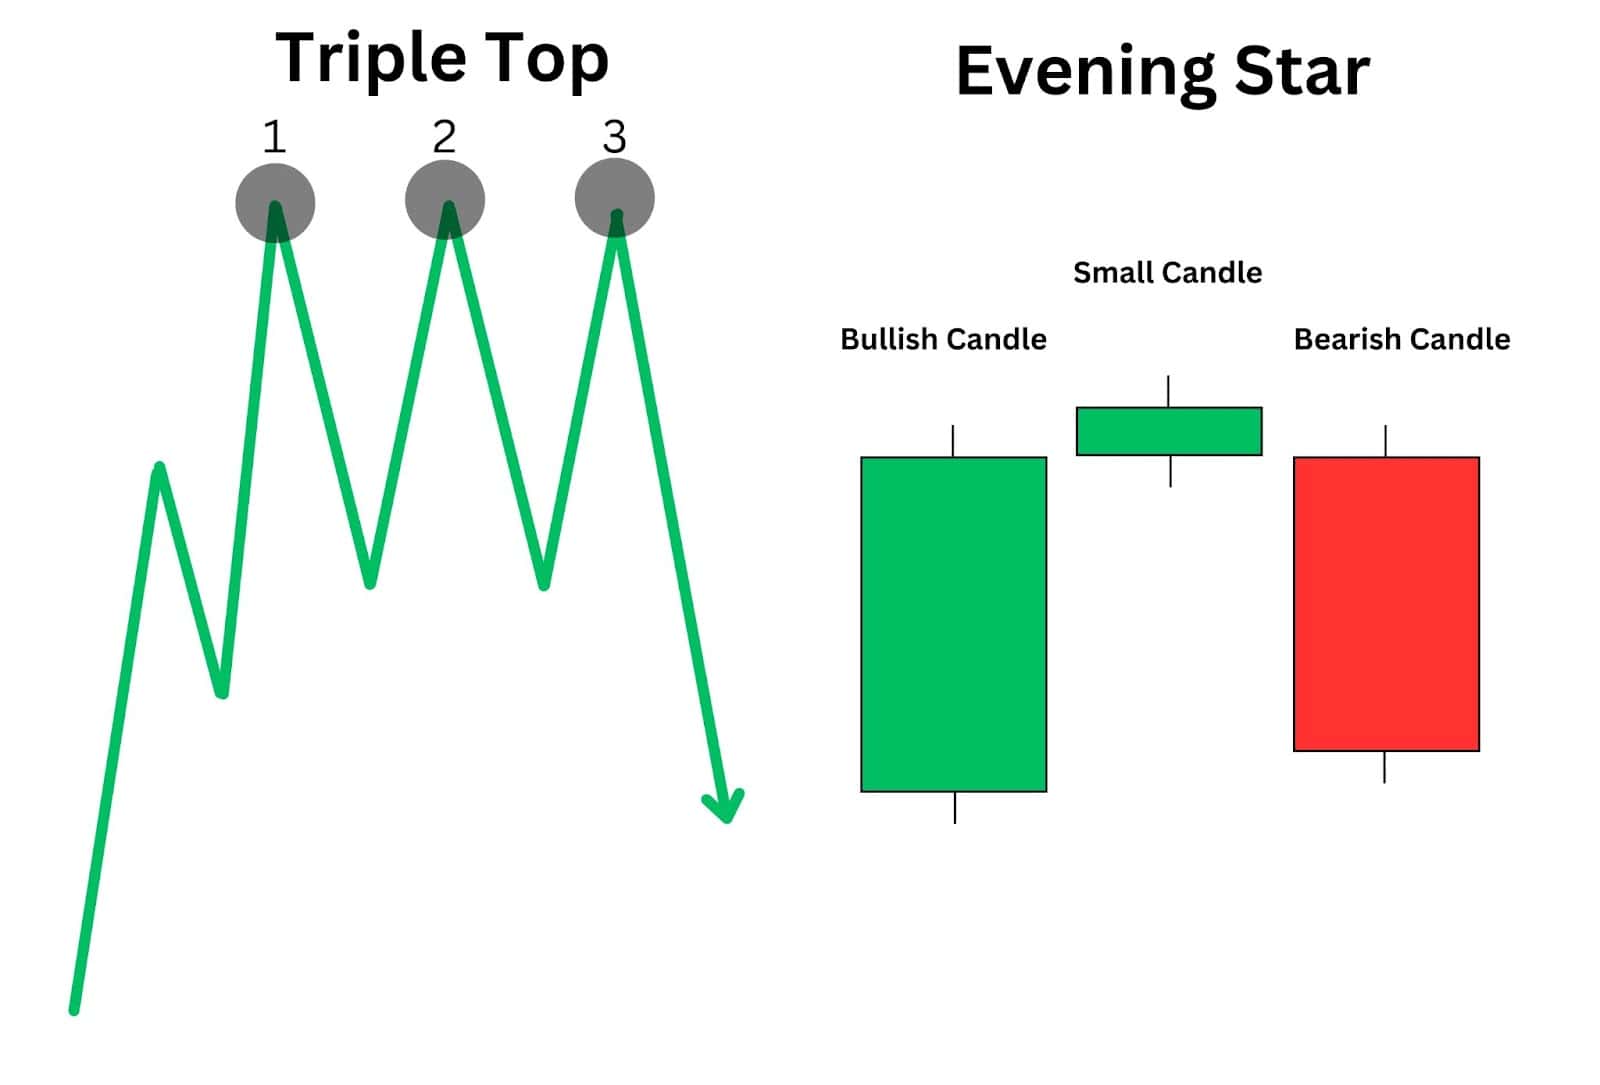
Pattern Formation
The triple top consists of three distinct peaks at similar price levels, formed over an extended period with no specified number of candlesticks. This makes it a complex pattern that often provides a more reliable signal due to the repeated testing of resistance levels.
The evening star, however, is a concise three-candlestick pattern that includes a large bullish candle, a small-bodied candle, and a large bearish candle, forming a single peak. This specific structure makes the evening star easier to spot and quicker to form.
Reliability and Identification
The triple top allows traders to set multiple stop-loss orders above each peak, offering robust risk management. The extended formation period also provides traders with ample time to confirm the pattern and plan their trades.
On the other hand, the evening star’s precise candlestick criteria, including specific size and color requirements, offer a clear and immediate signal for entering short positions. Traders typically place stop-loss orders above the high of the second candle to protect against false signals.
Trading Strategies
In summary, while both patterns indicate potential bearish reversals, the triple top’s complexity and reliability contrast with the evening star’s simplicity and ease of identification. Each pattern suits different trading strategies, with the triple top providing thorough confirmation and the evening star offering quick and clear entry points.
What Factors to Consider When Trading the Triple Top Pattern
When trading the triple top pattern, consider the following factors for a more effective strategy:
- Clear Resistance and Neckline Levels: Ensure the three peaks are at similar levels to identify a strong resistance zone. The neckline should be well-defined, connecting the lows between the peaks.
- Entry Points: Look for a breakout below the neckline to enter a short position. Confirming this break is crucial to avoid false signals.
- Stop-Loss Placement: Set stop-loss orders just above the third peak to manage risk effectively. This protects against unexpected price movements that could lead to losses.
- Profit Targets: Measure the distance between the resistance and neckline, and project it downward from the breakout point to set realistic profit targets. This helps in planning your trades with clear objectives.
- Market Conditions: Assess broader market trends and conditions, as they can influence the pattern’s reliability and effectiveness. Ensure the overall market sentiment aligns with the bearish signal of the triple top.
- Volume Confirmation: Look for increased volume during the breakout below the neckline to confirm the pattern’s validity. High volume indicates strong selling interest, reinforcing the likelihood of a sustained downtrend.
What Indicators Works Best with a Triple Top Pattern?
Using technical indicators alongside the triple top pattern can enhance the reliability of your trades and provide additional confirmation signals. Below are some of the most effective indicators to use in conjunction with the triple top pattern.
Triple Top Pattern with Moving Averages
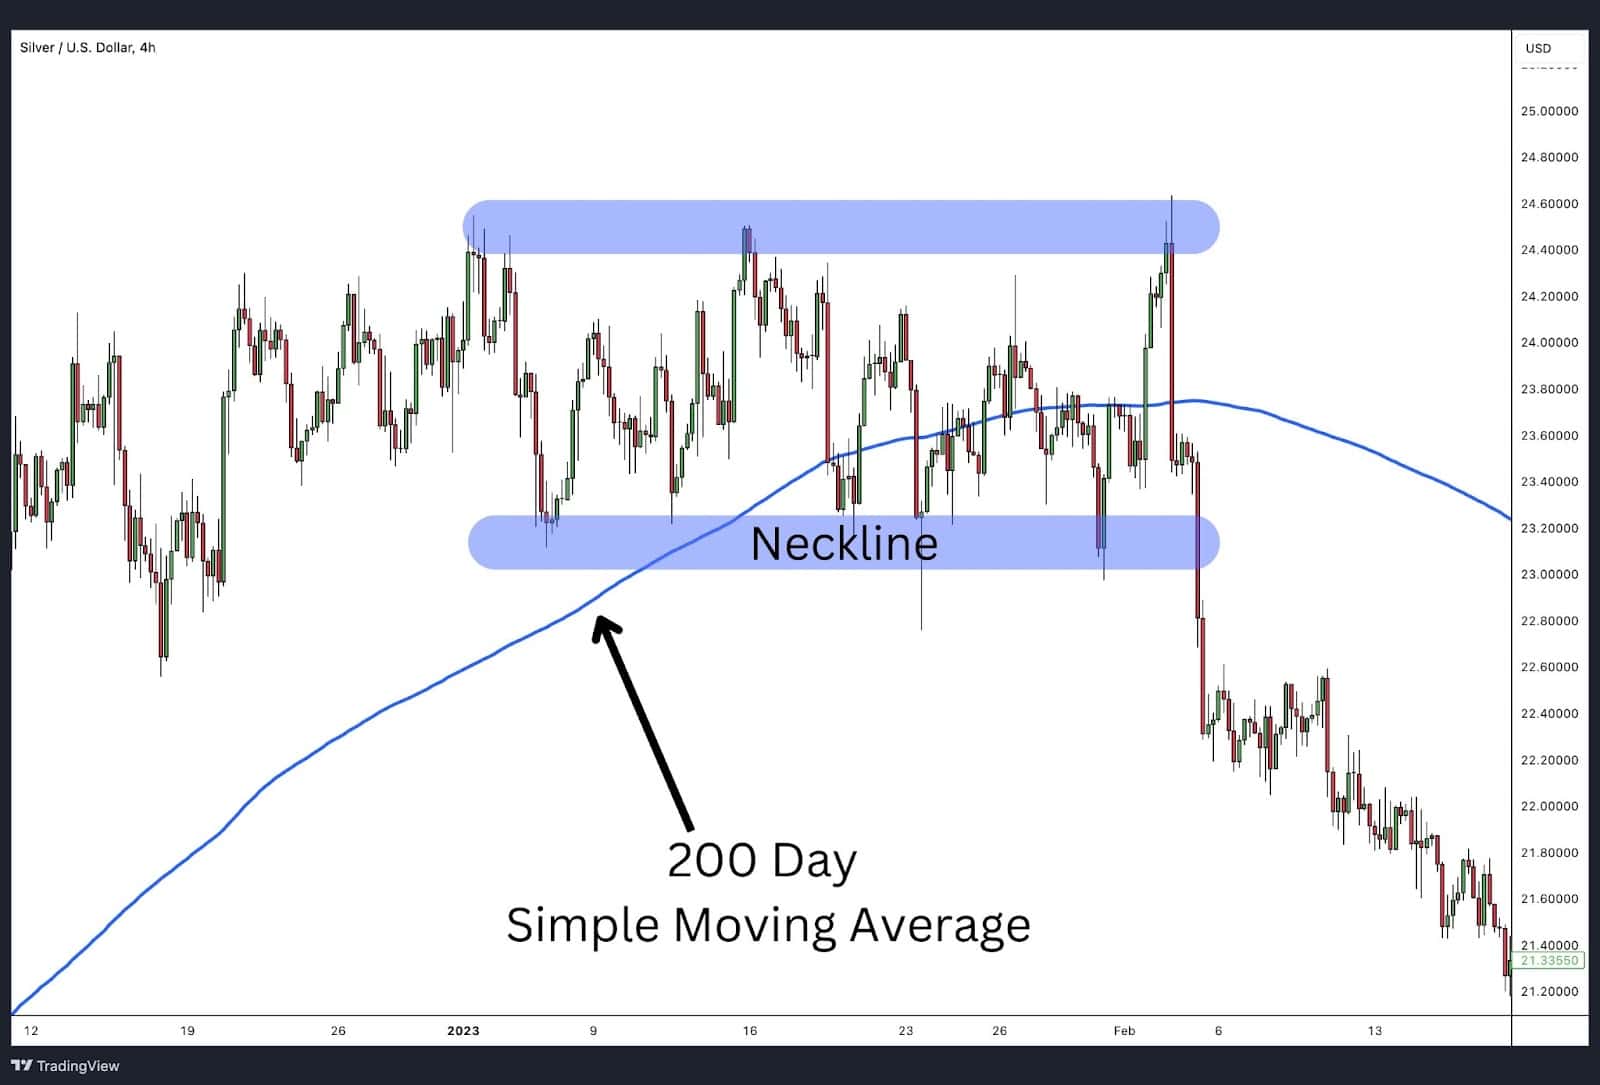
Moving averages help smooth out price action and can identify the overall trend direction. When trading a triple top, look for the price to break below a significant moving average, such as the 50-day or 200-day simple moving average or exponential moving average, which can confirm the bearish reversal indicated by the triple top.
Triple Top Pattern with MACD
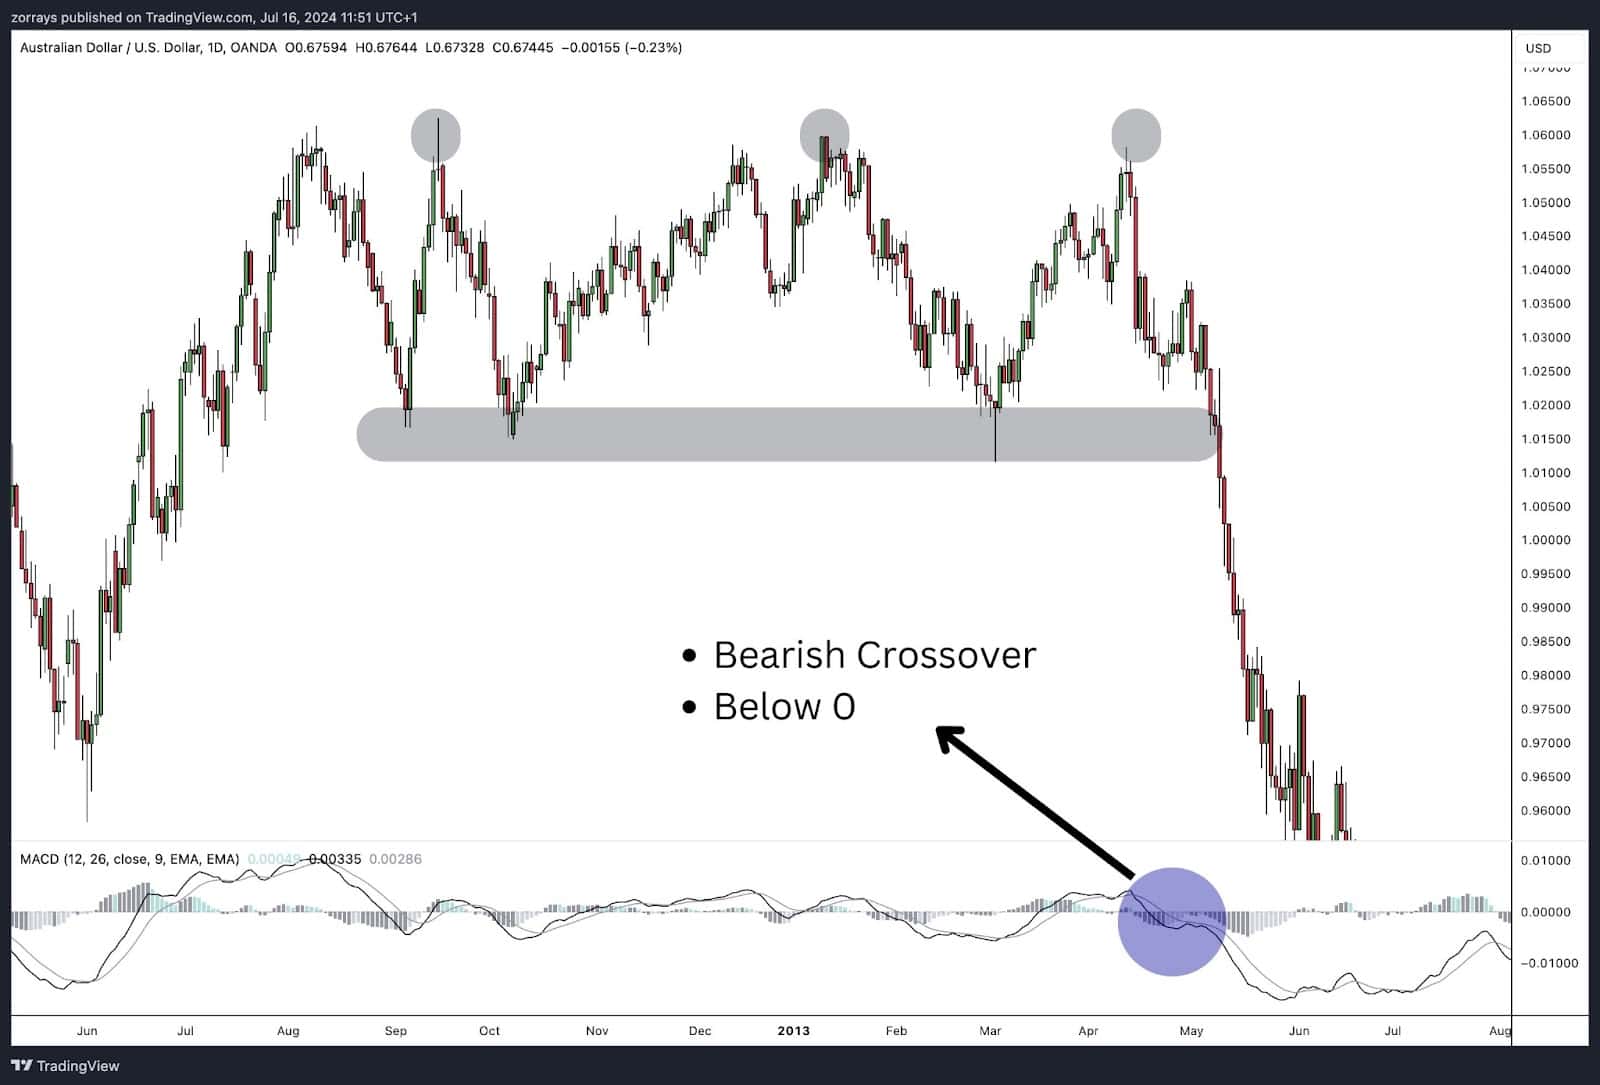
The Moving Average Convergence Divergence (MACD) indicator can provide valuable confirmation for the triple top pattern. A bearish crossover, where the MACD line crosses below the signal line, especially below the zero line, can reinforce the bearish signal of a triple top formation.
Triple Top Pattern with RSI
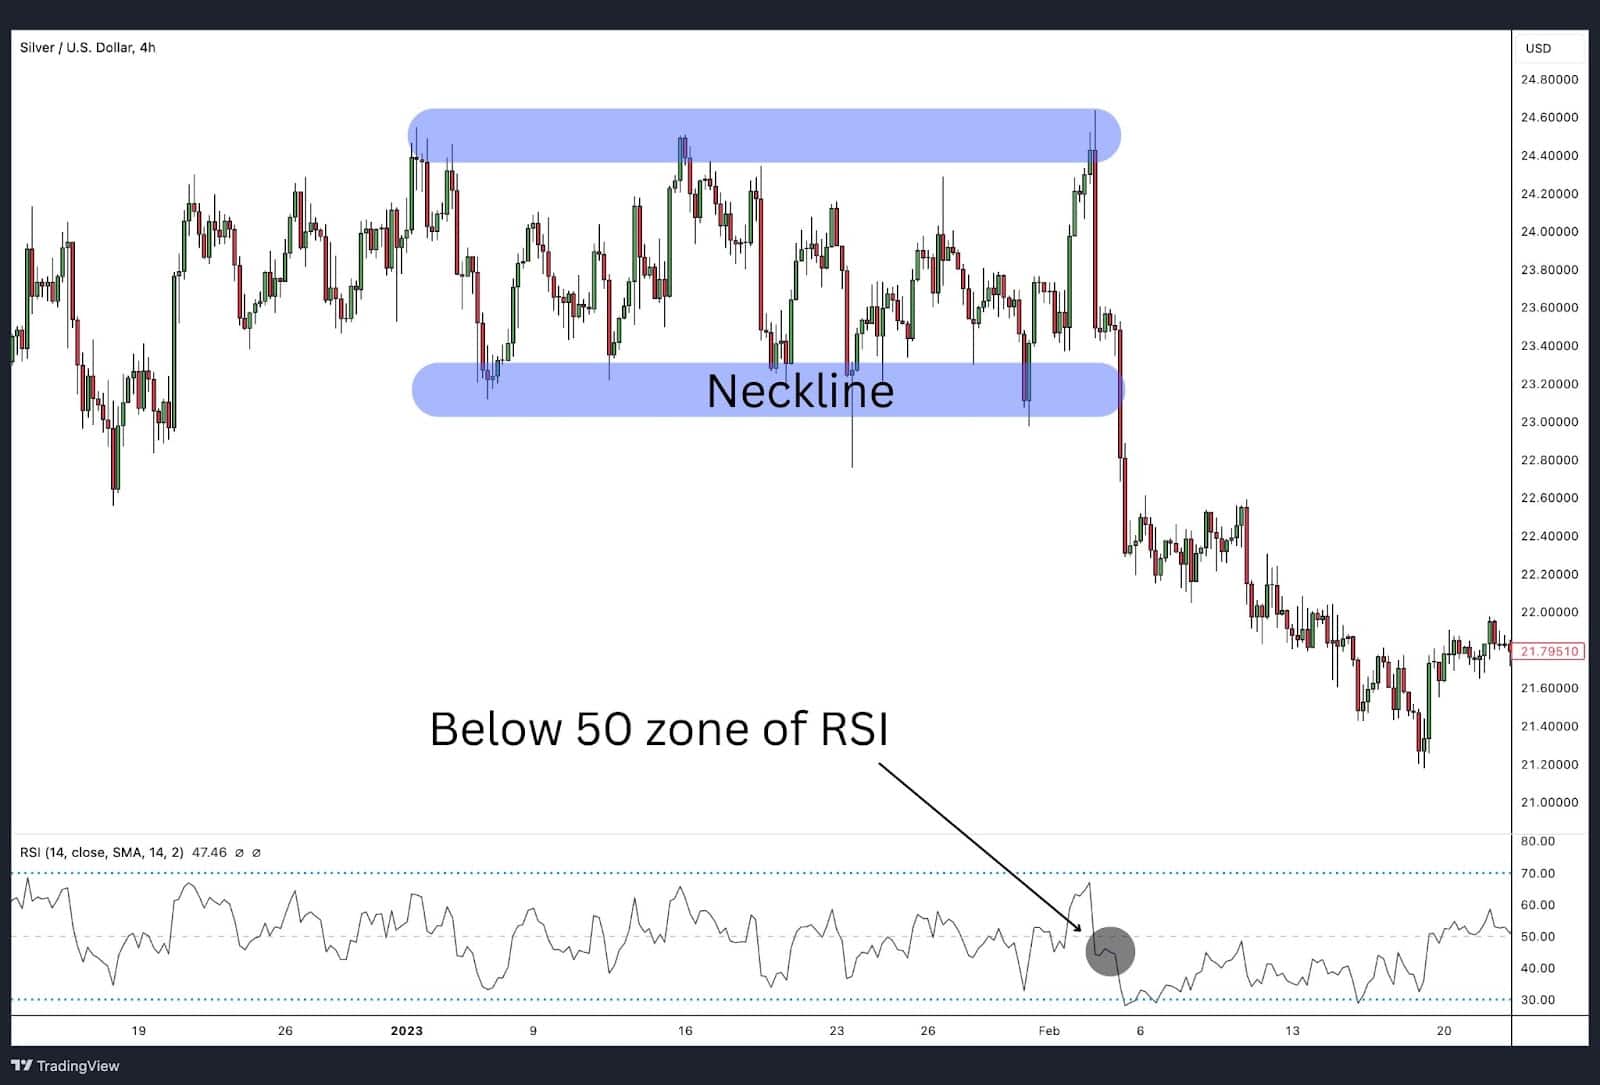
The Relative Strength Index (RSI) measures the speed and change of price movements. An RSI reading above 70 indicates overbought conditions. It is not unusual to spot bearish RSI divergence when the final top has registered.
Additionally, as the RSI starts to decline from high levels to below the 50% region, it can signal a potential reversal, confirm the triple top, and strengthen the case for entering a short position.
Triple Top Pattern with Volume
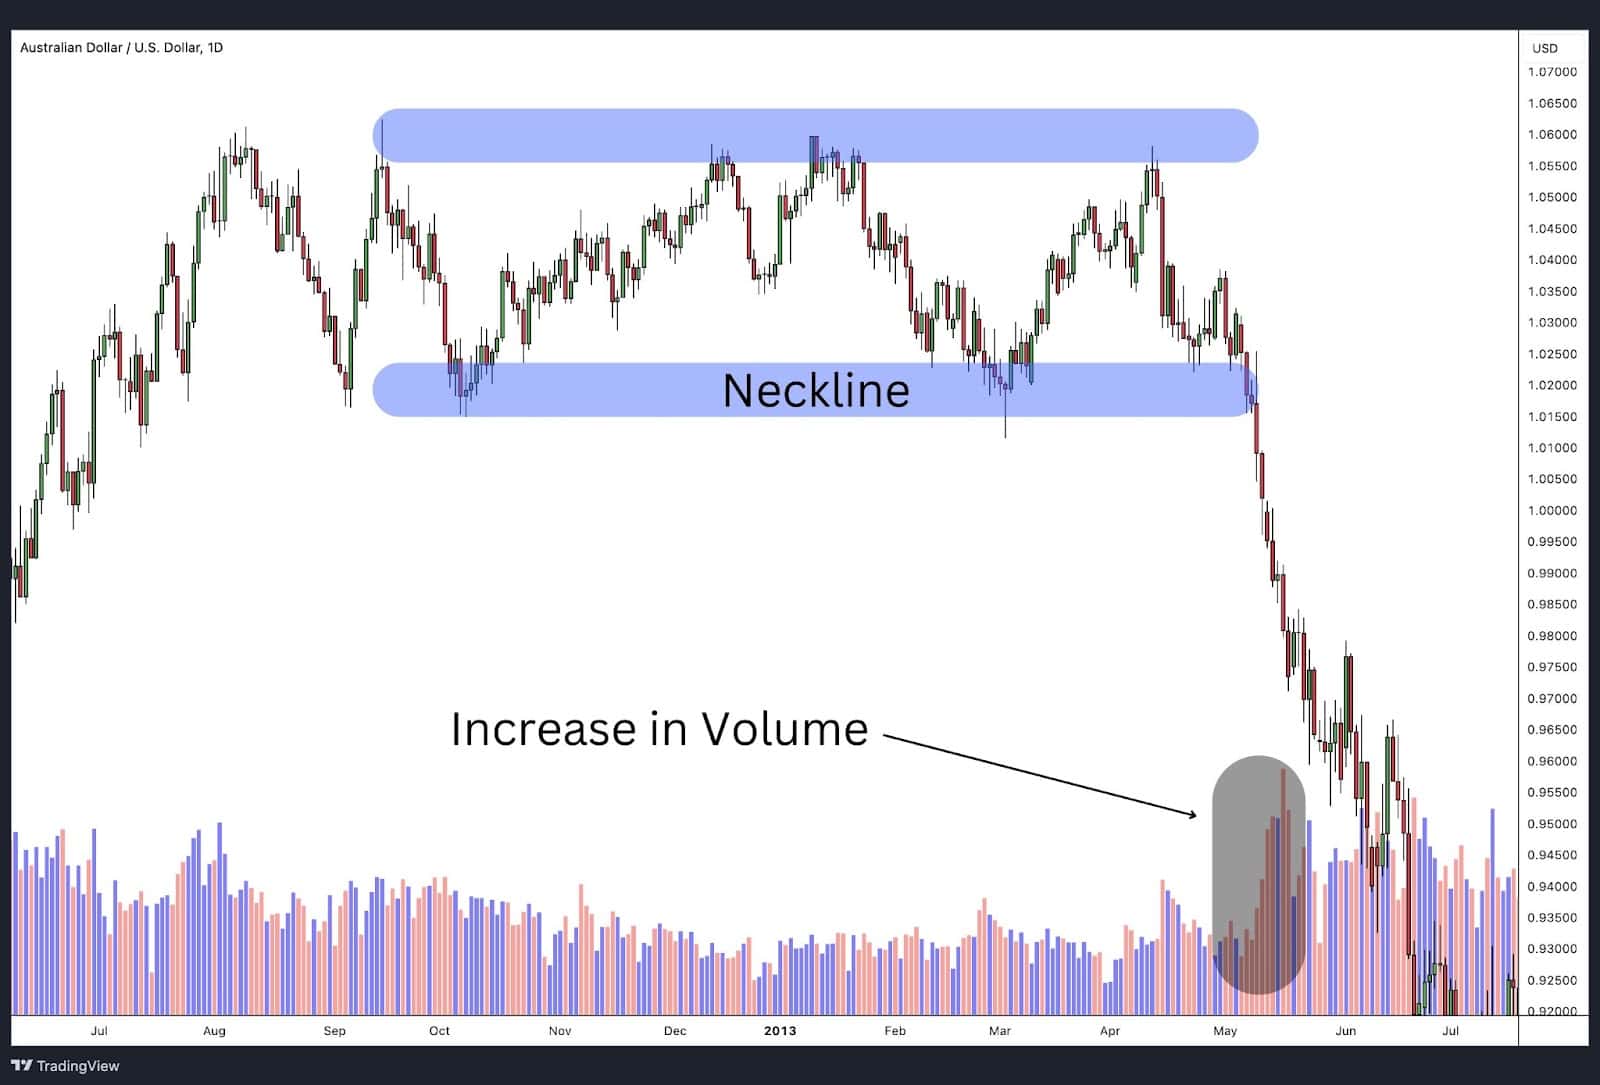
Volume is a crucial factor in confirming the validity of the triple top pattern. A significant increase in volume as the price breaks below the neckline suggests strong selling pressure and validates the bearish reversal. Conversely, low volume during the breakout may indicate a higher risk of a false signal.
Triple Top Pattern with Bollinger Bands
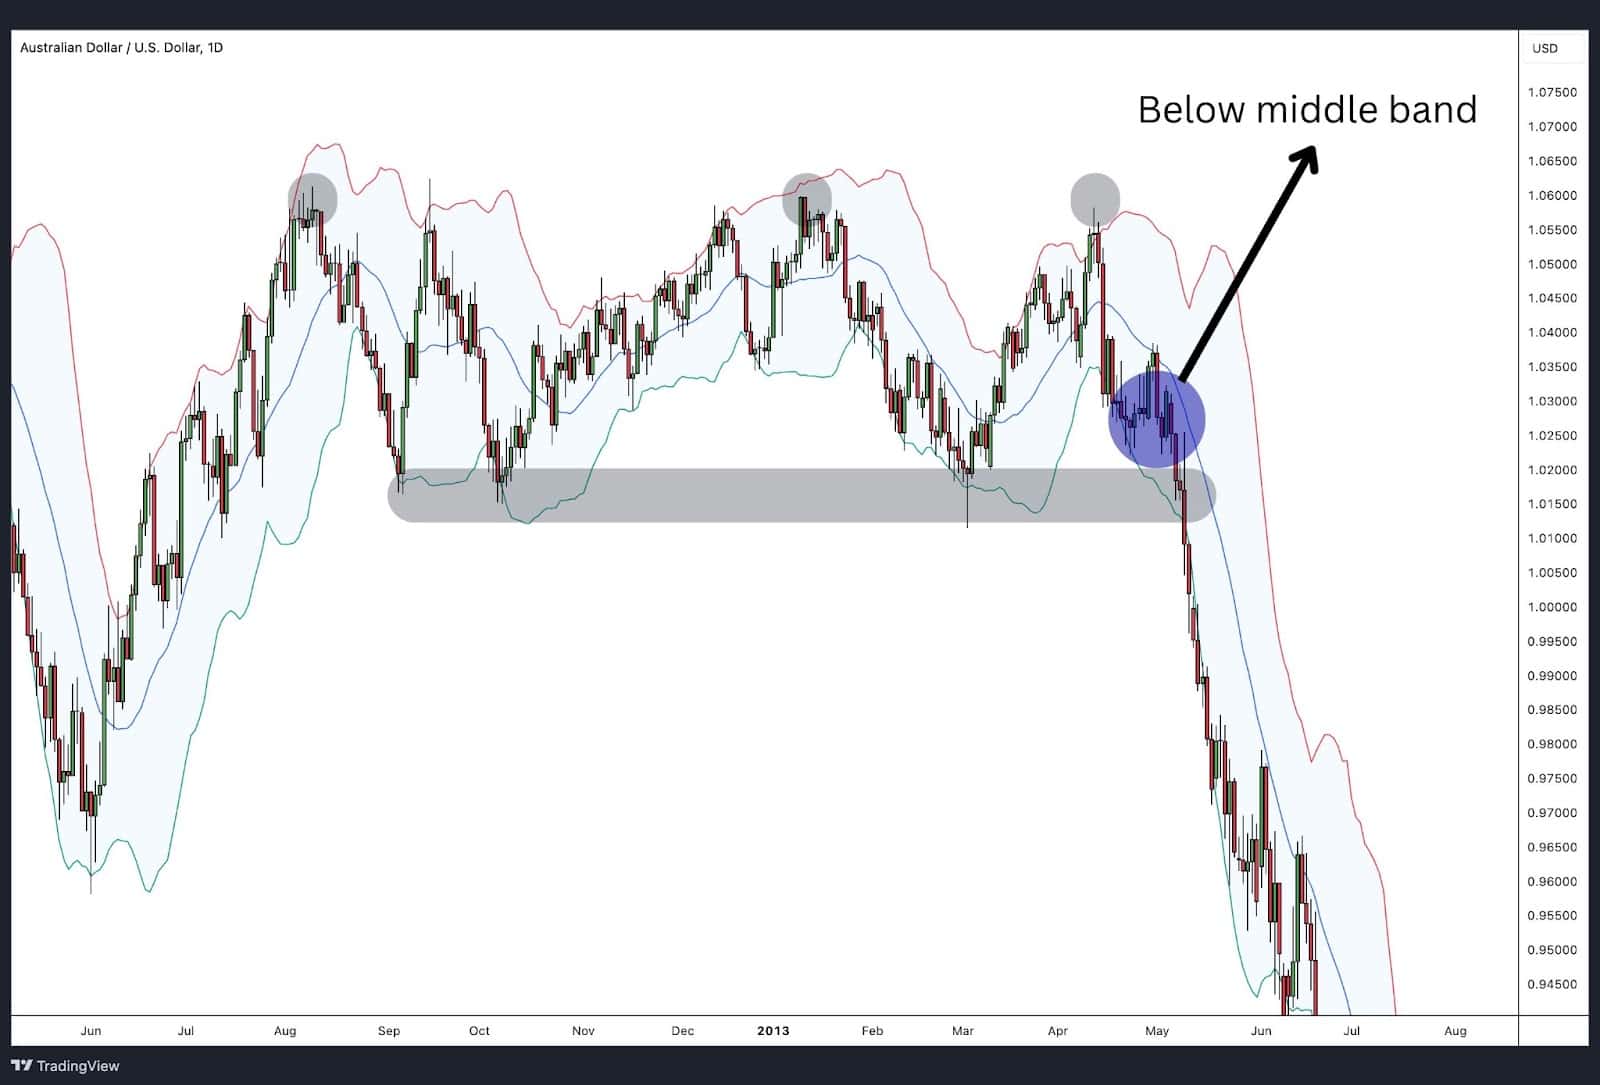
Bollinger Bands® can provide insights into market volatility. In a triple top pattern, if the price moves outside the upper Bollinger Band during the peaks and then breaks below the middle band (the 20-day simple moving average), it can indicate a loss of upward momentum and confirm the bearish reversal.
FAQ
Is the triple top bullish or bearish?
A triple top pattern is a bearish candlestick pattern. It indicates a potential reversal from an uptrend to a downtrend, signalling that the buying momentum has exhausted and selling pressure is likely to increase.
How reliable is a triple top pattern?
According to Bulkowski’s research, the triple top pattern has an average success rate of around 69% when it comes to accurately predicting a bearish reversal. This means that approximately two-thirds of the time, the pattern successfully signals a downward price movement following the formation of the third peak and the subsequent breakout below the neckline.
However, it’s important to note that these success rates can vary based on different market conditions, timeframes, and the specific implementation of the pattern. Using additional technical indicators and volume analysis can help improve the reliability of trading decisions based on the triple top pattern.
What timeframes work best with the triple top pattern?
The triple top pattern tends to be more reliable on longer chart time frames such as daily, weekly, or monthly. Shorter timeframes may produce more false signals due to market noise.
Is triple top pattern originated by three peaks advancing into the same region with pullbacks in between?
Yes, a triple top pattern is characterised by three peaks advancing to roughly the same price level, with pullbacks to the neckline support level in between. This formation indicates strong resistance and a potential bearish reversal when the price breaks below the neckline.


