Bullish
- December 13, 2024
- 35 min read
Triple Bottom Pattern – How to Trade It
Key Takeaways
- Bullish Reversal Indicator: The triple bottom pattern serves as a bullish reversal chart pattern, signalling a potential shift from a downtrend to an uptrend. This pattern is characterised by three equal lows forming at roughly the same price level, followed by a breakout above the resistance level. This pattern indicates that selling pressure has diminished and buyers are gaining control, often leading to a price rally once the breakout occurs.
- Effectiveness and Reliability: The triple bottom pattern is widely regarded as a reliable bullish reversal pattern, with a reported success rate of approximately 87%, according to Liberated Stock Trader. This high reliability makes it a preferred choice for technical traders in predicting a reversal from a bearish pattern to a bullish trend. This contrasts with the bearish reversal pattern, such as the triple top, which markets price action that fails to break through resistance after three attempts, leading to a significant price drop.
- Challenges in Identification: Despite its high success rate, the triple bottom chart pattern can be difficult to identify correctly, especially in choppy or noisy market conditions. Traders may sometimes mistake it for similar chart patterns like the double bottom or inverse head and shoulders. Therefore, it is crucial to wait for a confirmed breakout above the resistance level before entering a long position. Additionally, using strong risk management strategies, including a well-placed stop loss, helps mitigate losses in case of a false breakout or pattern failure.
What Is a Triple Bottom?

A triple bottom chart pattern is a bullish reversal formation frequently used in technical analysis to signal a change from a downtrend to an uptrend. This chart pattern is defined by three equal lows that represent points of strong support on a price chart. Each low indicates where selling pressure diminishes, and buyers step in, causing the price to rally higher. The pattern is confirmed when the breakout occurs above a well-established resistance level, formed after the third bottom.
The triple bottom formation unfolds in three stages, illustrating the ongoing struggle between buyers and sellers:

- Step One: Initially, sellers dominate the market, driving the price downward below a recent swing low. This decline triggers buying interest, leading to the formation of the first bottom as the price rallies slightly from the newly found support level.

- Step Two: The upward momentum from the first bottom is typically brief. Sellers regain control, pushing the price back toward the initial low. However, strong buying interest re-emerges, stopping the decline and forming the second bottom. The price then ascends towards the recent high, but with limited momentum.

- Step Three: Failing to breach the resistance level in step two, the price falls back once more. The price tests the low for a third time, but support holds firm, signalling growing buyer confidence. As buyers gain momentum, the price is driven towards the resistance level, leading to a potential breakout and confirming the completion of the triple bottom chart pattern.
What Does the Triple Bottom Pattern Indicate?
The triple bottom pattern is a powerful bullish reversal chart pattern that signals a significant shift in market sentiment. Initially, the market is dominated by sellers, and price falls repeatedly to the same support level. Despite three attempts by sellers to push prices lower, strong support emerges, indicating buying interest. Each of these lows forms three equal lows, which is the hallmark of a triple bottom formation.
At first, the market faces selling pressure, with sellers outnumbering buyers. As the price action declines, buyers begin to emerge, creating a local swing low. This causes the price to bounce higher, but the buying momentum is not strong enough to establish a new trend direction. Sellers re-enter the market, driving the price back down, forming what may initially look like a double bottom.
However, the buyers return after a second and third test of the critical support level, preventing the price from falling further. After this third bottom, the bearish momentum of sellers is exhausted. With sufficient buying pressure, the breakout occurs when the price surpasses the resistance level formed by the triple bottom chart pattern.
This reversal pattern indicates a transition from a downtrend to a potential uptrend, offering a clear trading opportunity for technical traders. The price target is often calculated by measuring the height of the bottom pattern and adding it to the breakout point above the resistance level, giving traders a target for the potential upward price movement.
In conclusion, the triple bottom chart is a reliable indicator of a bullish reversal, where the dominance of sellers fades, and buyers gain control, ultimately pushing the price higher.
How To Identify a Triple Bottom Candlestick Pattern?
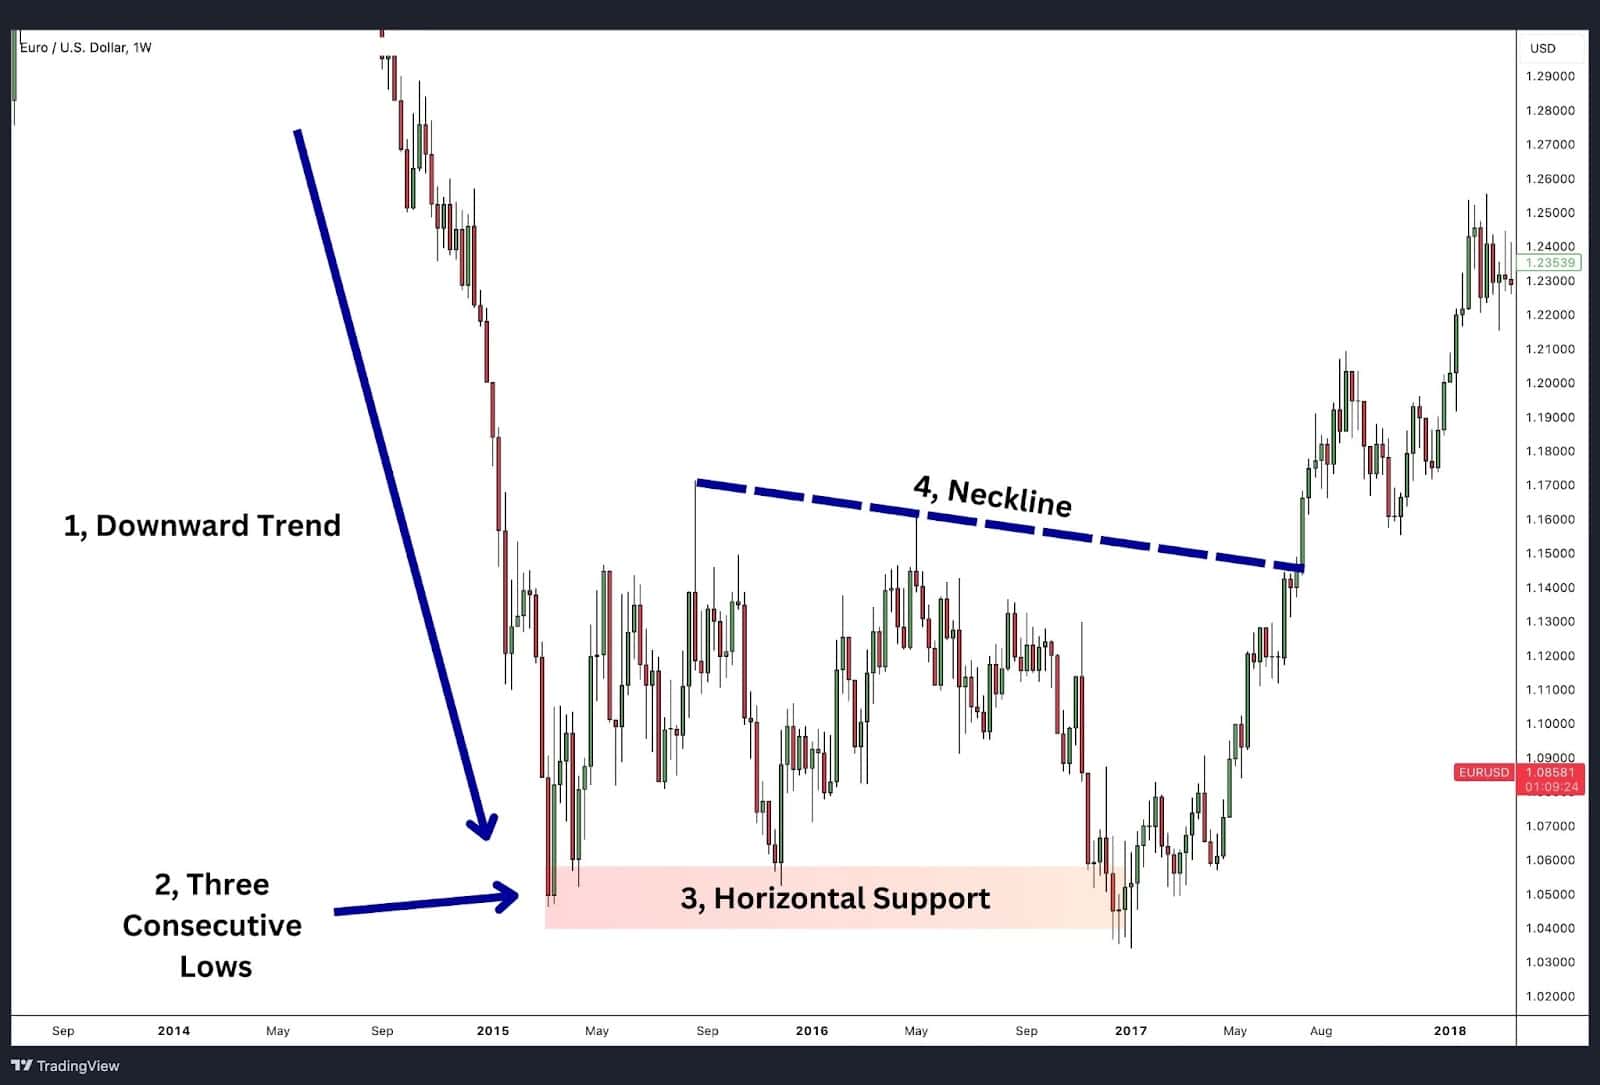
To effectively trade the triple bottom pattern, it is essential to accurately identify it on a price chart. This pattern is a bullish reversal pattern, typically forming at the end of a downtrend. The key to recognising triple bottoms lies in observing a few distinct characteristics.
1. Downward Trend:
The first step is to look for a series of lower lows and lower highs, which indicate a prevailing and clear downtrend. This sets the context for the potential formation of a triple bottom pattern, as it suggests the market has been dominated by sellers.
2. Three Consecutive Lows:
The defining feature of triple bottoms are three distinct lows that occur at roughly equal price levels. These lows indicate points where the selling pressure is repeatedly met with strong buying interest, preventing the price from falling further. It’s crucial that these lows are relatively equal, as significant variations could suggest a different pattern or insufficient buying strength.
3. Horizontal Support:
A key element of the triple bottom pattern is the presence of horizontal support. This support level represents a price point that the market repeatedly tests but fails to breach. It is where the maximum buying volume typically accumulates, indicating a strong defence by buyers against further price declines.
4. The Neckline (Resistance Level):
Above the three lows, the pattern forms a ‘neckline,’ which serves as a critical resistance level. The neckline connects the peaks that occur between the lows and must be broken to confirm the pattern. A breakout above this resistance level signifies the completion of the triple bottom pattern and a potential shift from a bearish to a bullish trend.
Challenges in Identification:
Identifying a triple bottom pattern can be challenging for several reasons. Firstly, the pattern is relatively rare, making it an uncommon sight on charts. Additionally, it can take a considerable amount of time to fully form, requiring patience and a keen eye for detail. The pattern’s reliability hinges on a confirmed breakout above the neckline, without which the pattern may fail to signal a true reversal.
Importance of the Triple Bottom Pattern
The triple bottom chart pattern holds a pivotal role in the field of technical analysis. Its importance lies in its ability to signal a potential shift in market dynamics from bearish to bullish, providing traders with a crucial tool for predicting trend reversals.
By identifying this pattern, traders can make informed decisions, adjusting their strategies to align with the anticipated change in market direction. This means traders can close out short trades, tighten stop losses on short positions, or position to buy as a result of the change in market direction.
This pattern’s reliability and clarity make it an essential component in a trader’s toolkit, offering insights into market sentiment and helping to navigate the complexities of trading.
Let’s explore the significance of the triple bottom pattern in greater detail.
How Does Triple Bottom Pattern Indicate a Trend Reversal?

Here’s a breakdown of how the pattern signifies this reversal:
Formation of Three Lows: The process begins with sellers driving the price downwards, testing the support level. On the first attempt, the price hits a low point but is met with significant buying interest, preventing further decline. As sellers try again, they are once more halted by strong support, forming the second low.
This sequence repeats, and price falls resulting in a third test of the low. These three tests of nearly the same level highlights the market’s inability to move lower, indicating a potential exhaustion of selling pressure.
Resistance Breakout: The critical confirmation of a trend reversal occurs when the price action breaks above the resistance level, also known as the “neckline”. The neckline lies above the highs formed between the three lows.
This breakout is a clear signal that buyers have gained the upper hand, overcoming the previous resistance level. It marks the end of the bearish phase and the beginning of a bullish trend, as the market shifts from a state of selling to buying.
The formation of a triple bottom reversal pattern thus signifies a change in market sentiment, with the balance tipping in favour of buyers. This bullish reversal is a strong indicator for traders and investors, suggesting that a new upward trend may be underway. By recognising and acting upon this pattern, market participants can position themselves advantageously for the anticipated price rise.
Does Triple Bottom Indicate an Opportunity to Enter a Bullish Position?
Yes, the triple bottom chart pattern is a strong indicator of an opportunity to enter a bullish position. The formation of this pattern reveals key market dynamics that signal a shift in sentiment:
- Sellers’ Inability to Lower Prices: Throughout the formation of the triple bottom reversal, sellers repeatedly attempt to push prices below a certain level but fail each time. This inability to breach the support level indicates that selling pressure is diminishing.
- Weakening Selling Pressure: As sellers struggle to drive prices lower, the strength of the support level becomes more apparent. This failure to break through signals that the market may be running out of bearish momentum, paving the way for potential bullish activity.
- Increasing Buyer Control: With each unsuccessful attempt to lower prices, buyers gain confidence. The support level is reinforced, and the buying pressure begins to overshadow the selling pressure. This provides a feedback loop where sellers stop selling and buyers start buying when the support level is met in the future.
- Breakout Confirmation: The critical point in confirming the triple bottom chart pattern is when the price breaks above the resistance level, also known as the ‘neckline.’ This breakout is a clear signal that buyers have taken control, marking the end of the bearish trend and the start of a bullish phase. At this juncture, traders are presented with an opportune moment to go long, expecting a price increase.
Is Triple Bottom Generally Seen as Three Equally Lowest Bounces Off Support?
Yes, the triple bottom reversal pattern is typically characterised by three equal or nearly equal lows that bounce off a consistent support level. These lows represent critical points where the price tests the support level and rebounds, showcasing strong buying interest or pressure.
The presence of this consistent support level is a defining feature of the triple bottom pattern, making it highly recognisable among traders. It serves as a key differentiator from other chart patterns, highlighting a significant shift in market sentiment and the potential for a bullish reversal.
Examples of Triple Bottom
S&P 500
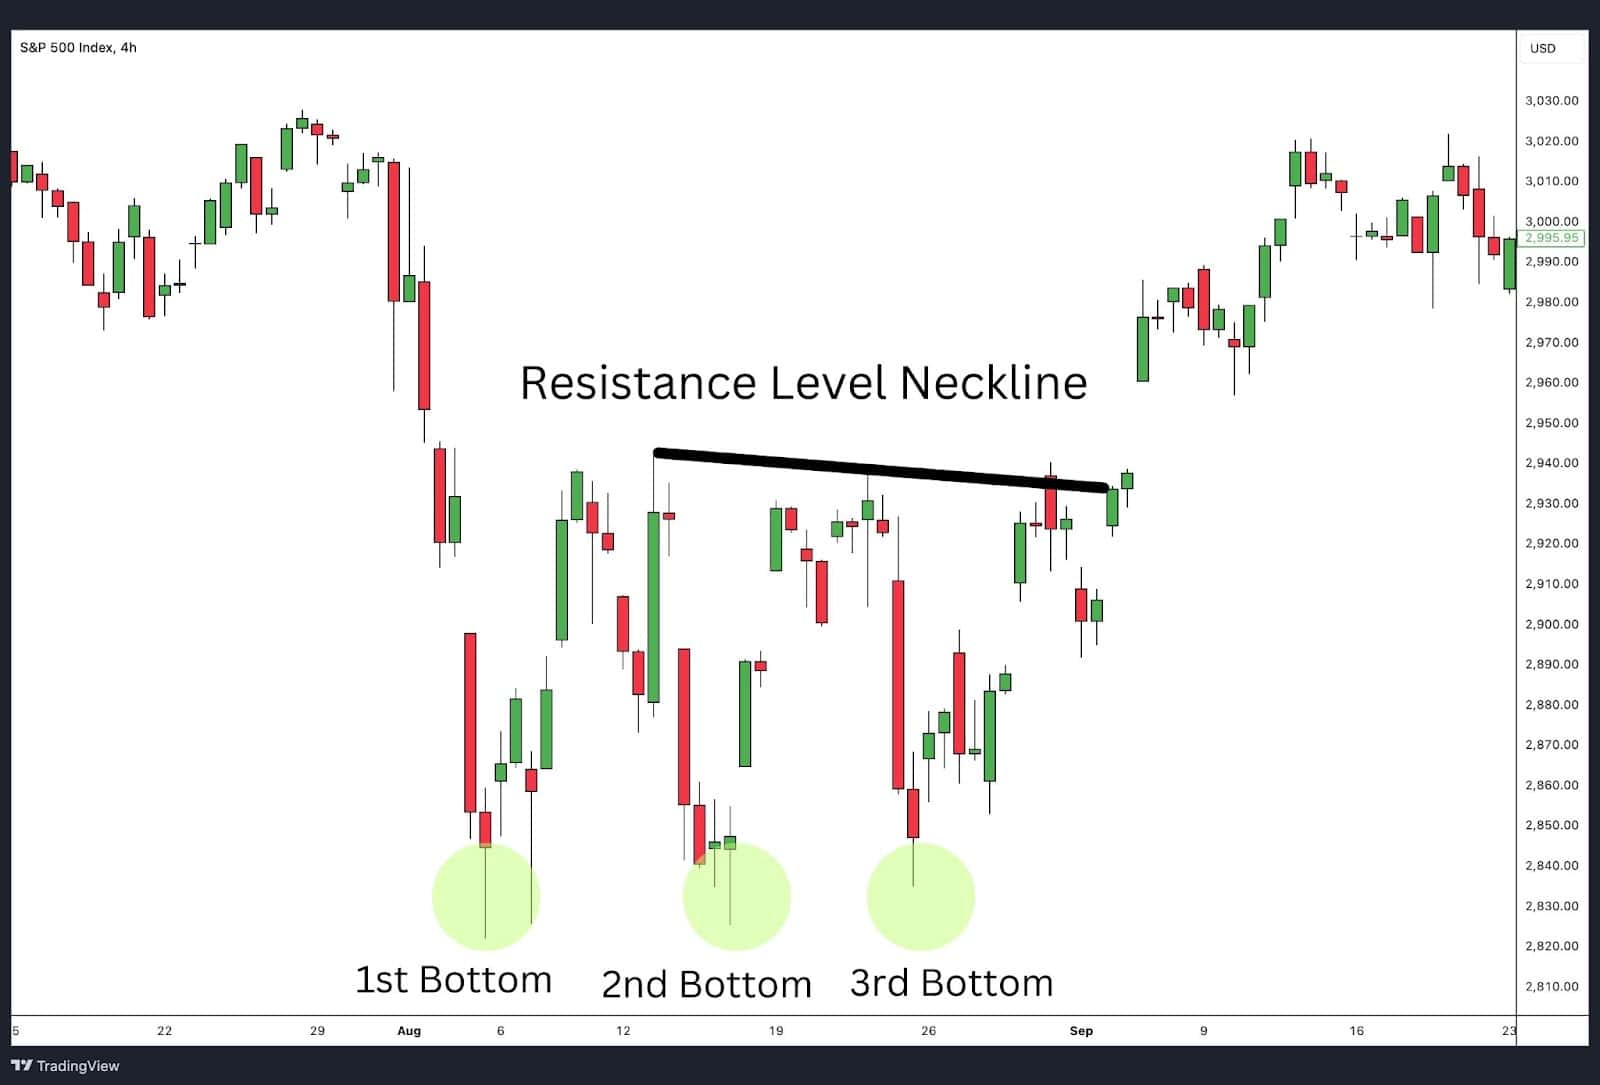
In this 4-hour chart of the S&P 500 Index (SPX), a textbook triple bottom reversal pattern emerged, signalling a potential reversal from a bearish to a bullish trend. The price action established three distinct lows, each forming a strong support level around 2,850. This repetition indicated that the market was struggling to push lower, suggesting a buildup of bullish momentum.
Formation of the Triple Bottom:
- 1st Bottom: The initial low created a significant support level, temporarily halting the ongoing downtrend.
- 2nd Bottom: The second low tested the same support level, reinforcing its importance and indicating the possibility of a reversal.
- 3rd Bottom: The third low further validated the support level, completing the triple bottom reversal pattern and setting the stage for a breakout.
Neckline and Breakout: The neckline, formed by the peaks between the bottoms, represents the critical resistance level. In this example, once the price broke above the neckline at approximately 2,930, it confirmed the bullish reversal. This breakout was followed by a strong upward move, validating the pattern and offering a clear entry point for traders.
Not all breakouts at resistance are successful. This is why it is important to wait for a breakout to appear rather than buying at the support shelf of the three lows.
Key Insights:
- Entry Point: Traders would consider entering a long position after the breakout above the neckline.
- Market Context: The broader market conditions and prior downtrend added weight to the reversal signal provided by the triple bottom reversal. Understanding the market context helps in gauging the potential strength of the reversal and planning trades accordingly.
This example illustrates how the triple bottom chart pattern can be leveraged to identify and trade bullish reversals effectively. By waiting for the neckline breakout, traders can avoid false signals and position themselves to capitalise on the emerging uptrend.
Gold
In this 4-hour chart of Gold (XAU/USD), we see a triple bottom chart pattern that signals a potential bullish reversal. The price formed three distinct bottoms around the $1,620 level, indicating strong support. After the third bottom, the price began to rise, challenging the resistance level formed by the neckline.
Formation of the Triple Bottom:
- 1st Bottom: The first low established the initial support level, suggesting a temporary pause in the downtrend.
- 2nd Bottom: The second low tested the same support level, reinforcing the strength of this area as a key price floor.
- 3rd Bottom: The third low confirmed the pattern, setting up the potential for a bullish reversal.
Neckline and Breakout: The neckline, drawn from the swing highs between the bottoms, represents the resistance level that must be broken for the pattern to confirm a reversal. In this example, the price broke above the neckline, signalling the completion of the triple bottom reversal. This breakout is accompanied by a subsequent rally, validating the pattern and providing a clear entry point for traders.
Key Insights:
- Entry Point: A trader would look to enter a long position shortly after the price breaks above the neckline, ideally on increased volume to confirm the strength of the breakout.
- Market Context: The overall downtrend preceding the pattern and the significant support at the $1,620 level created a strong setup for this reversal. Traders should always consider the broader market context to assess the likelihood of a sustained move higher after the breakout.
Ethereum
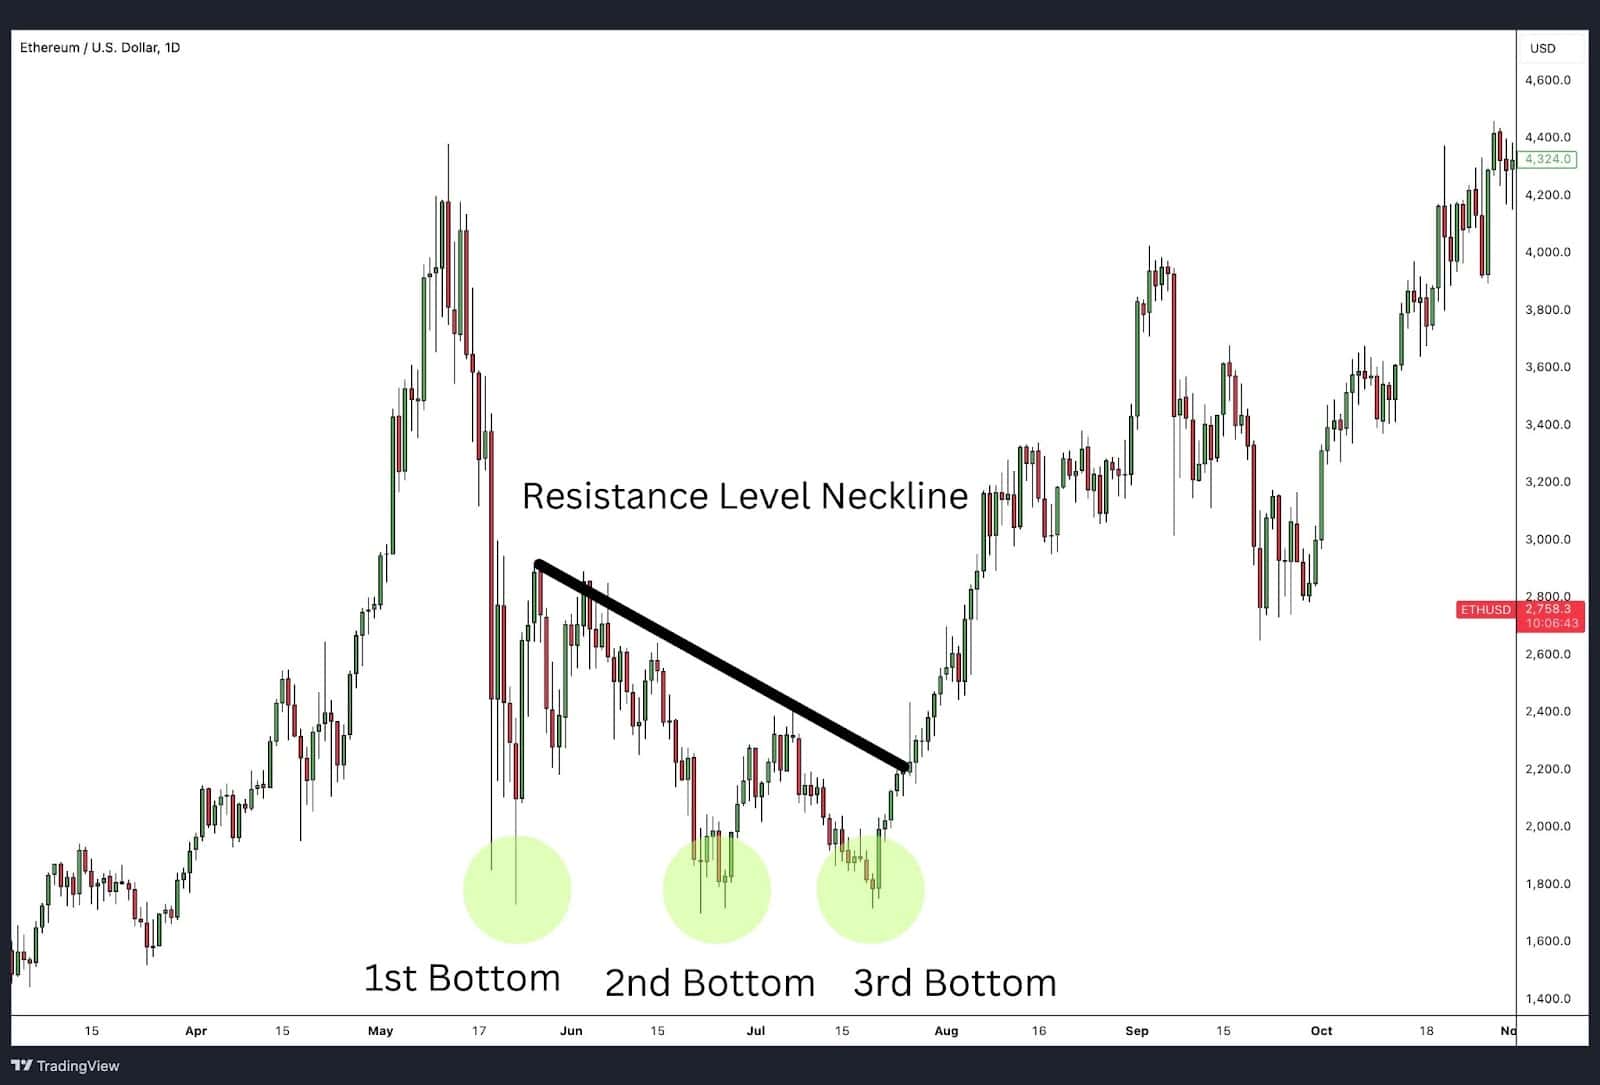
After reaching new highs, Ethereum (ETH/USD) began a sharp bearish trend that peeled back more than 50% of the price. As the market digests those quick losses, ETH/USD began try to form support to build a bullish reversal from In this daily chart of Ethereum (ETH/USD), we observe a well-defined triple bottom chart pattern forming. The frequent test and inability to punch below the support shelf indicates a bullish reversal may be just around the corner.
Formation of the Triple Bottom:
- 1st Bottom: The first low created initial support around $1,700, indicating potential exhaustion in the downtrend.
- 2nd Bottom: The second low tested the same support level, further reinforcing this price zone as a key area where buyers are stepping in.
- 3rd Bottom: The third low confirmed the pattern, as the price again found support at the $1,700 level, setting the stage for a bullish reversal.
Neckline and Breakout: The neckline, formed by the peaks between the bottoms, marks the critical resistance level. In this case, Ethereum’s price eventually broke above the neckline, signalling the completion of the triple bottom chart pattern. The breakout was followed by a strong upward movement, indicating a shift from bearish to bullish sentiment.
Key Insights:
- Entry Point: Traders would look to enter a long position following the breakout above the neckline.
- Market Context: Given the broader context of a strong preceding downtrend, the triple bottom pattern serves as a reliable indicator of a potential reversal, making this setup particularly attractive for bullish trades.
This example of Ethereum illustrates how the triple bottom reversal pattern can be effectively used to anticipate bullish reversals, providing clear signals for entry and allowing traders to capitalise on significant upward price movements following the breakout.
Triple Bottom Trading Strategies
Triple bottom reversals are versatile because they can be applied to a variety of markets, including stock trading. Once you’ve identified a triple bottom chart pattern, the next step is to formulate a trading strategy that incorporates this pattern effectively. Here, we explore three such strategies: trading the neckline breakout, using MACD, and utilising Fibonacci retracement levels.
Breakout of the Neckline: Strategy and Execution
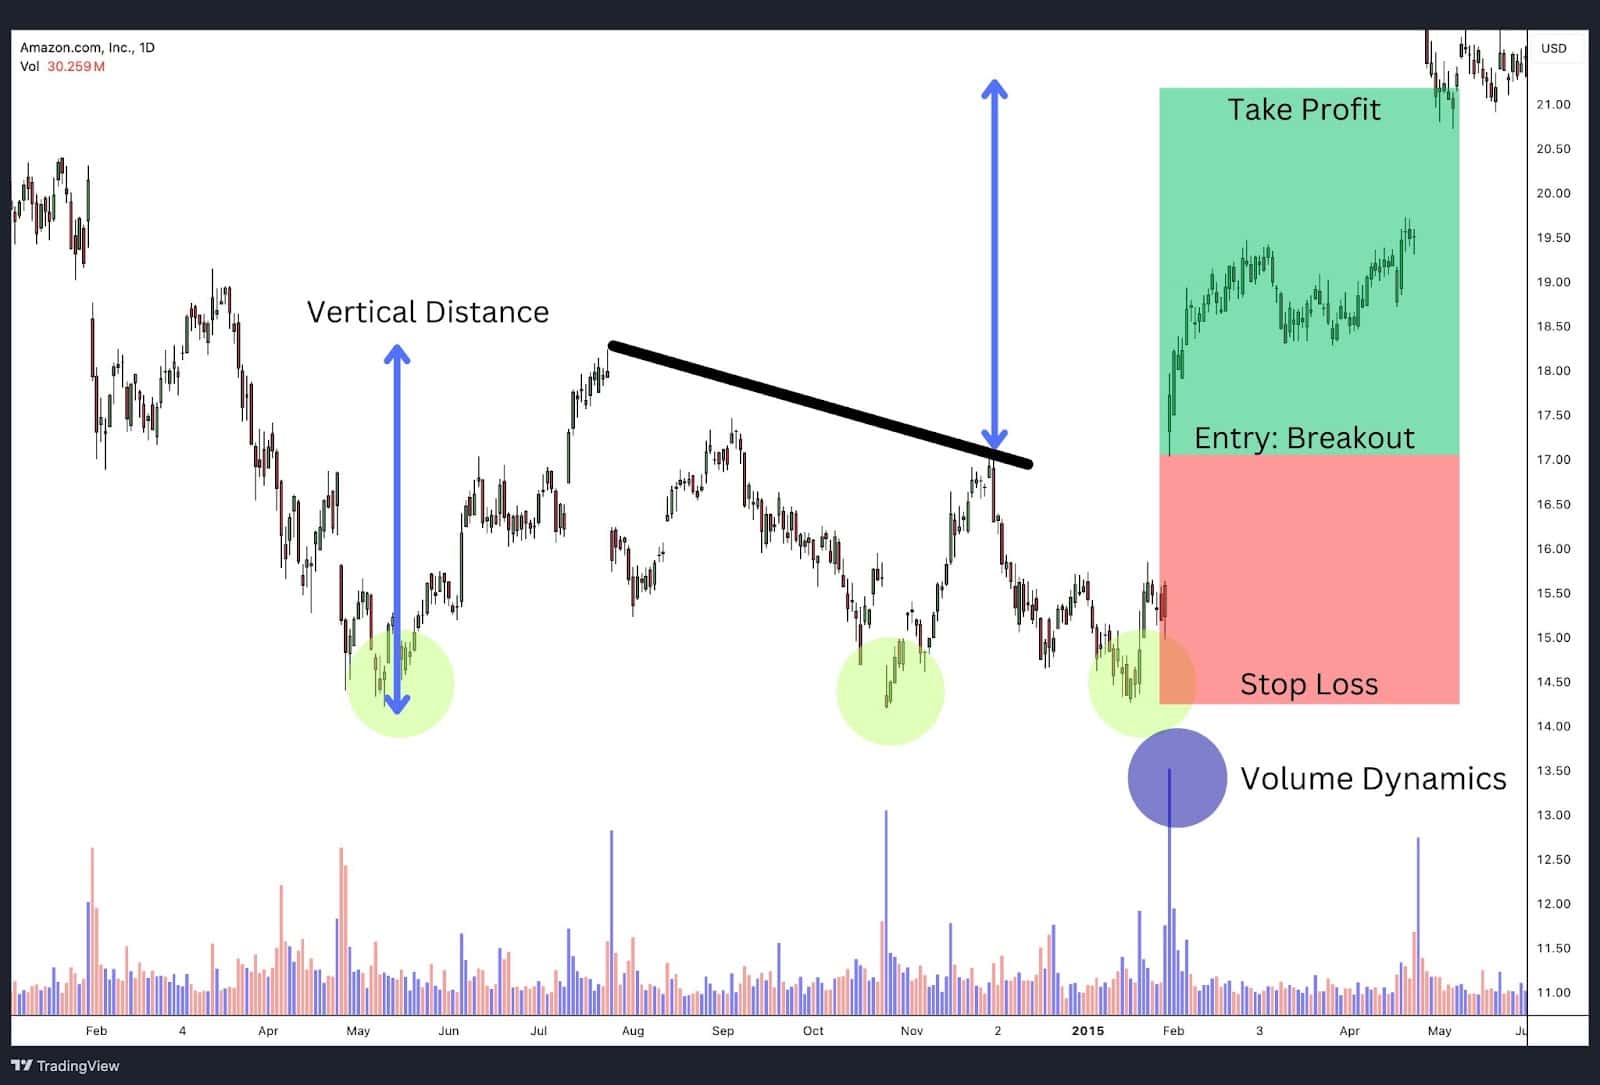
When trading a triple bottom pattern, the breakout of the neckline is a crucial signal that a bullish reversal is likely underway. The neckline represents the resistance level that has formed from the peaks between the three bottoms. Once the price breaks above this level, it confirms the completion of the triple bottom chart pattern and signals a potential upward trend. The example above is using the stock Amazon (AMZN).
Entry Point: Breakout of the Neckline Once the price breaks through the neckline (marked by the black trend line), traders typically enter a long position. This breakout is a strong indicator that the previous downtrend has ended and a new uptrend may be beginning. The breakout should be accompanied by increased volume, which further validates the signal.
Stop Loss Placement To manage risk, traders often place a stop loss just below the lowest of the three bottoms. This helps protect against potential false breakouts or a sudden reversal back into the previous downtrend. In the example, the stop loss is strategically placed below the bottom of the third trough, ensuring that any significant movement against the trade will limit losses.
Take Profit Strategy The take profit target is typically calculated by measuring the vertical distance between the lowest bottom and the neckline (blue arrow). This distance is then projected upwards from the breakout point, providing a clear price target. As shown in the example, the price reaches this target level, allowing traders to secure their profits. For those who wish to maximise gains, a trailing stop-loss can be implemented once the initial target is hit, allowing for additional profit if the price continues to rise.
This approach to trading the triple bottom pattern ensures that traders have a well-defined entry, risk management, and profit-taking strategy, making it an effective tool for capitalising on market reversals.
Trading with MACD
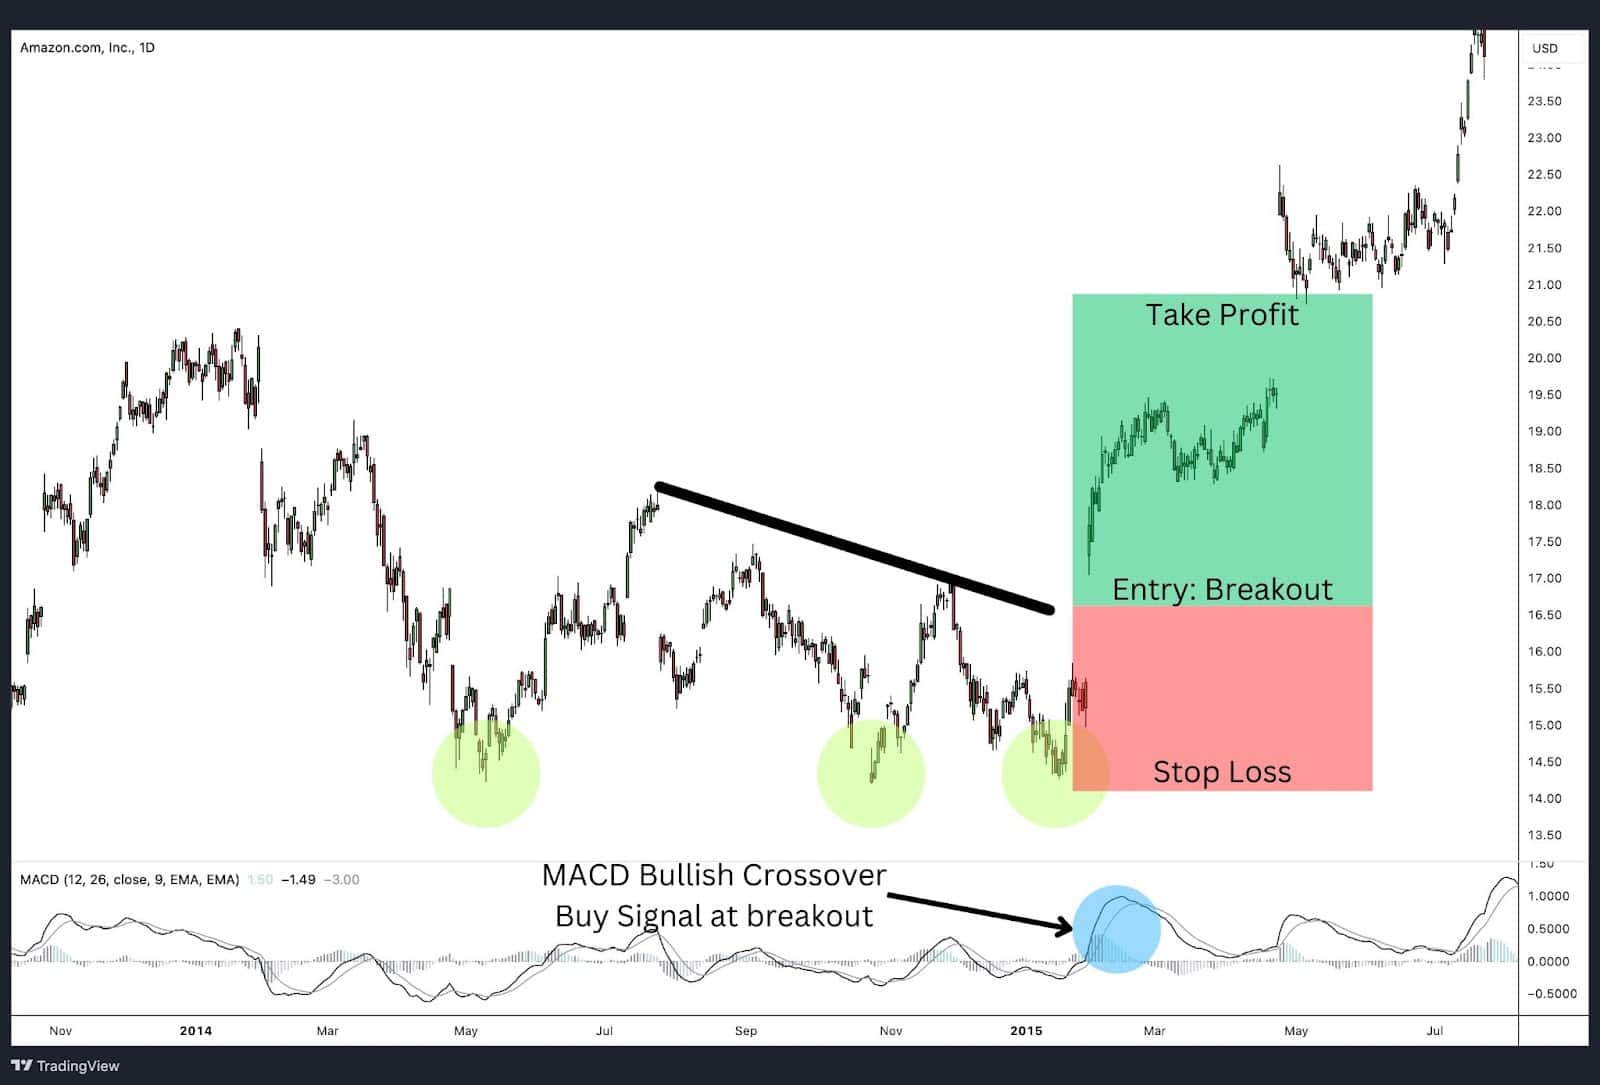
The Moving Average Convergence Divergence (MACD) is a powerful momentum indicator used by traders to identify potential buy and sell signals. When combined with chart patterns like the triple bottom, the MACD can significantly enhance the accuracy of trading decisions, particularly at the critical point of a neckline breakout.
When the MACD line crosses above the signal line, it generates a bullish crossover, signalling a potential buy opportunity. Conversely, when the MACD line crosses below the signal line, it indicates a bearish crossover or a potential sell signal.
Using MACD with Triple Bottom Pattern
- Identify the Triple Bottom Pattern: Begin by identifying the formation of a triple bottom pattern on your chart. Look for three distinct lows at similar price levels, creating a strong support line.
- Wait for the Neckline Breakout: Once the triple bottom is confirmed, wait for the price to break above the neckline (the resistance formed between the peaks of the pattern). This breakout signals a likely trend reversal from bearish to bullish.
- Check for MACD Bullish Crossover: Before entering a trade, look at the MACD indicator. Ideally, the MACD line should cross above the signal line around the time of the neckline breakout. This bullish crossover provides additional confirmation that the uptrend is gaining momentum.
- Enter the Trade: When both the neckline breakout and the MACD bullish crossover align, it provides a strong buy signal. Enter a long position as soon as these conditions are met.
Example Application In the attached chart example above, notice how the MACD bullish crossover occurs just as the price breaks out above the neckline. This synchronisation between the price action and the MACD indicator adds confidence to the trade, making it a highly effective strategy for maximising profits while minimising risks.
By combining the triple bottom pattern with the MACD, traders can filter out false breakouts and confirm the strength of the reversal, thereby enhancing their trading strategy’s overall effectiveness.
Triple Bottom Trading with Bollinger Bands
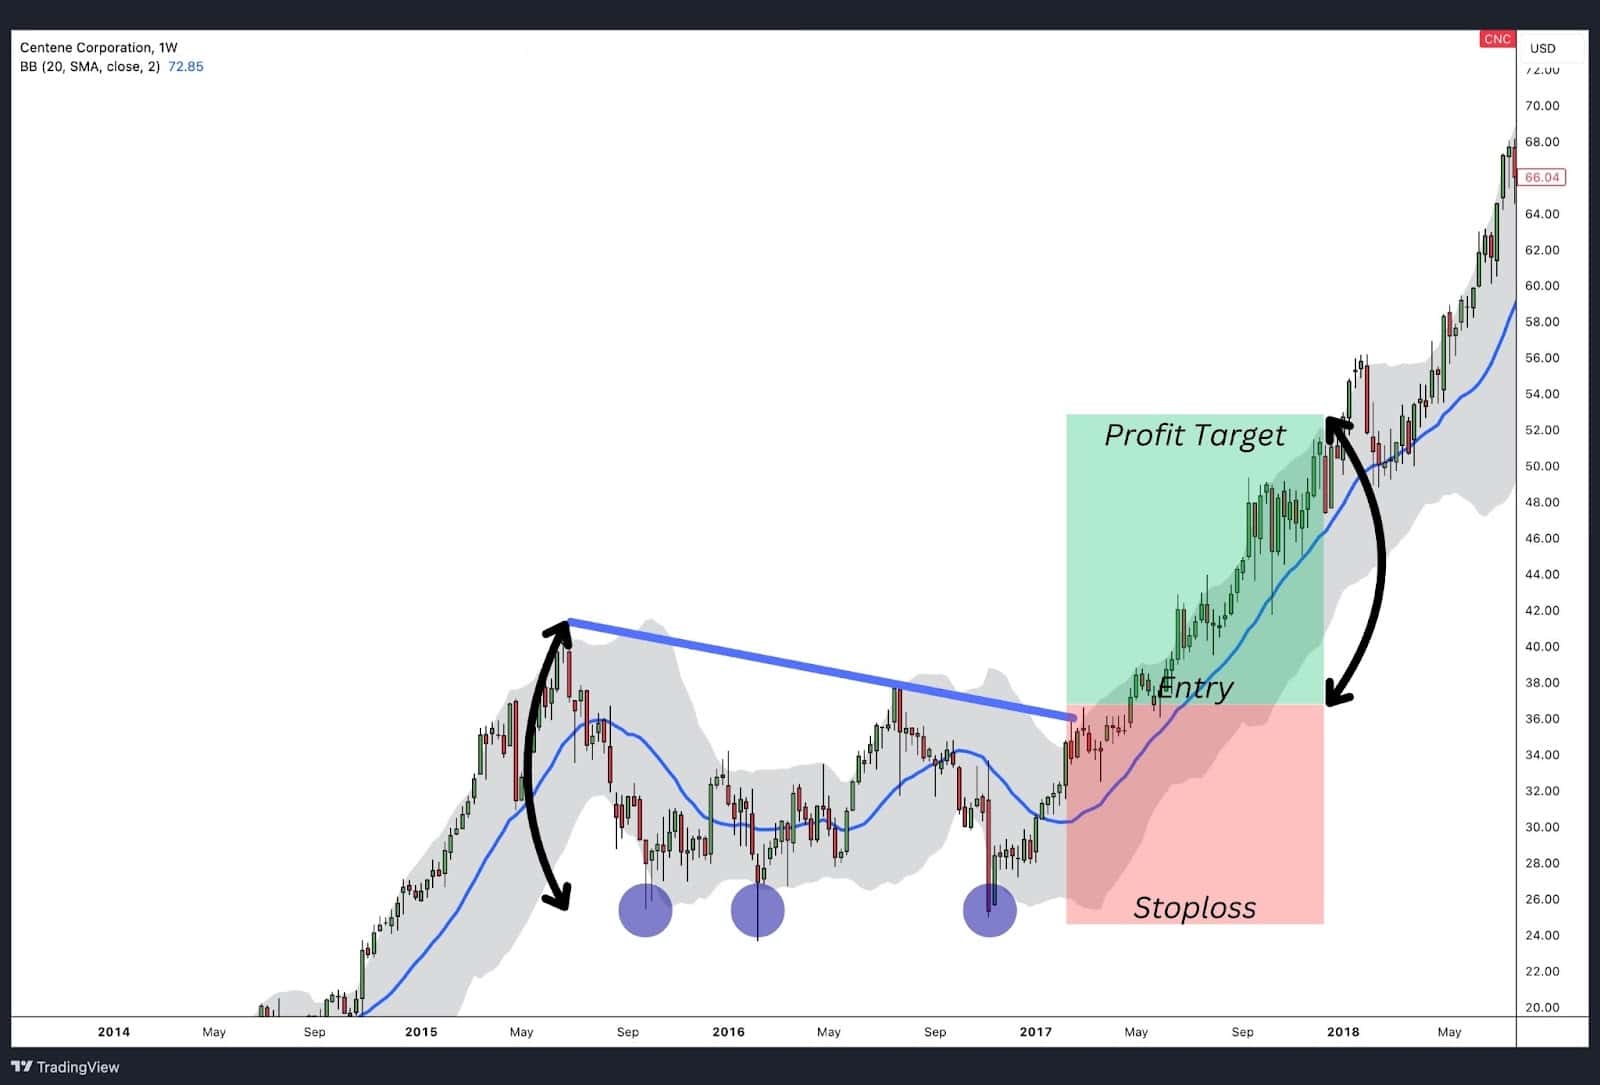
Combining the triple bottom pattern with Bollinger Bands® adds extra confluence to the breakout. Bollinger Bands provide insight into price volatility, and when the price consistently closes near or above the upper band during a breakout, it suggests the move may be impulsive and backed by strong momentum.
Bollinger Bands as Breakout Confirmation
A breakout near the upper Bollinger Band indicates strong buying pressure, signalling that the reversal is likely to continue. If the bands are expanding, this further supports the idea of increased volatility and an impulsive move. In contrast, if the price fails to touch the upper band during the breakout, it might indicate a weaker, less reliable move.
Trade Setup: Stop-Loss and Profit Target
- Stop-Loss: Below the third low to guard against a failed breakout.
- Profit Target: Measure the distance from the neckline to the lowest low of the pattern and project this upward from the breakout point.
In the Centene Corporation chart, the price breaks out above the neckline while touching the upper Bollinger Band, confirming the strength of the move. This alignment between the triple bottom and Bollinger Bands enhances the trade’s conviction, providing additional confidence in the breakout’s success.
Trading using Fibonacci Retracement Levels
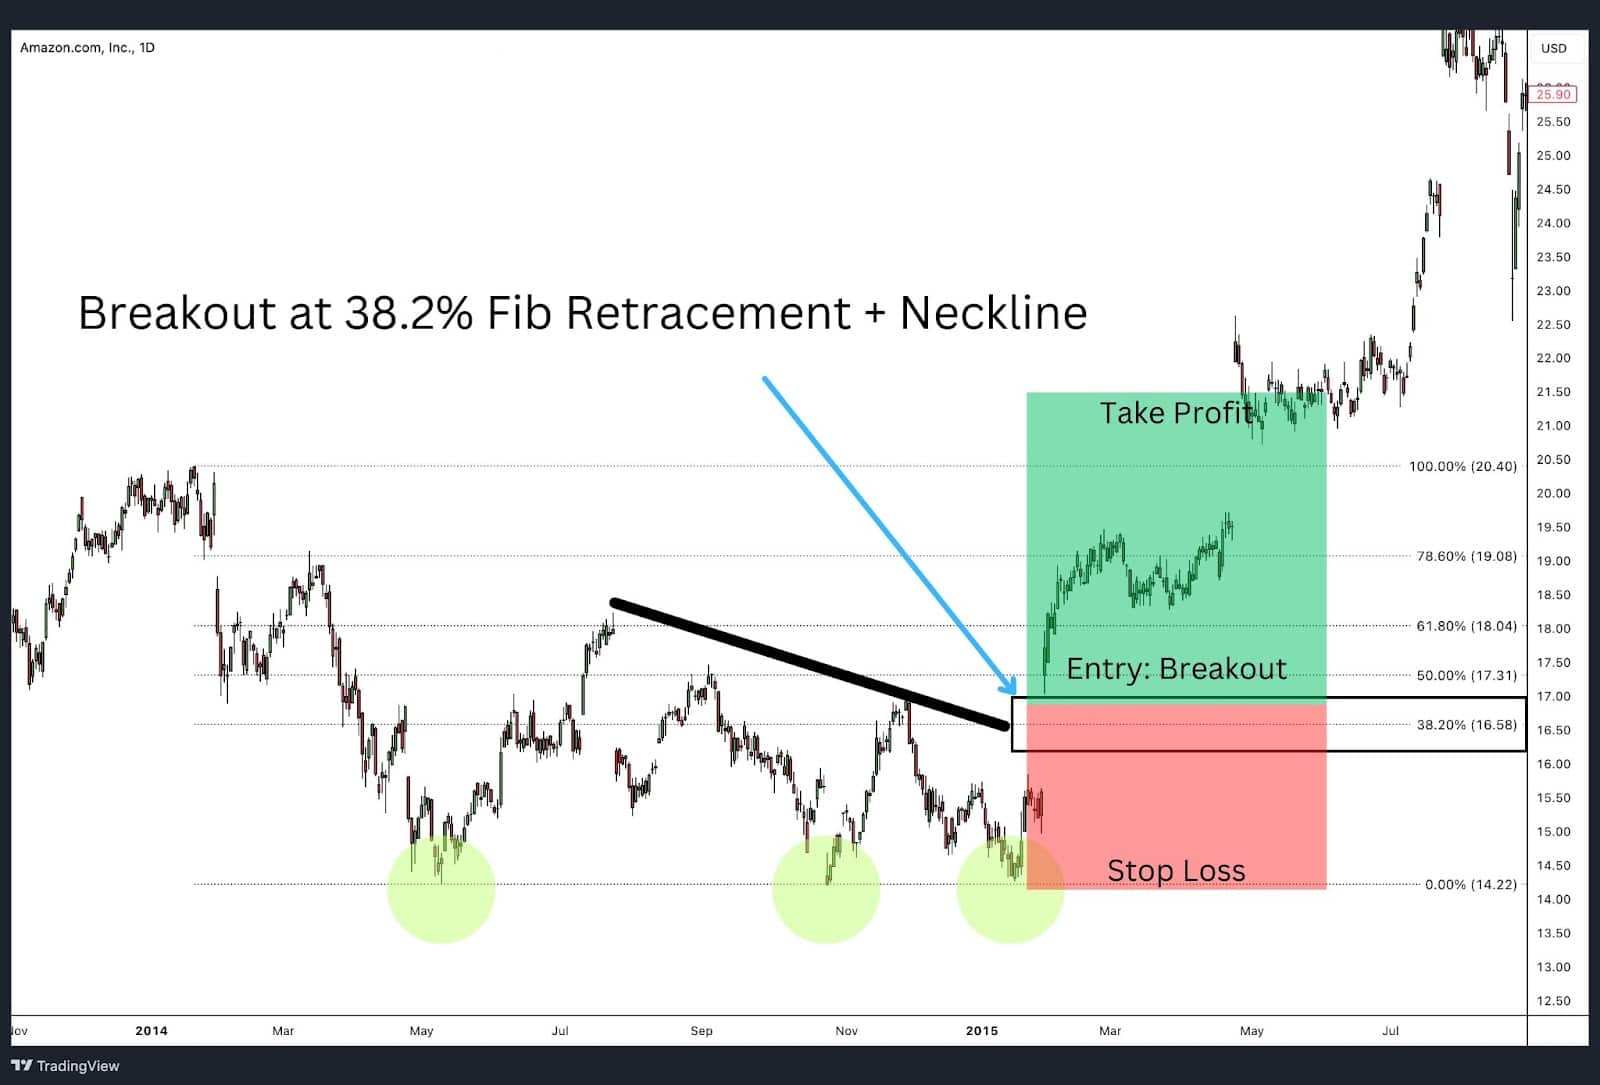
Fibonacci retracement levels are a widely used tool in technical analysis, offering traders a way to identify potential entry points, especially during market pullbacks following a breakout. In the context of a triple bottom pattern, Fibonacci retracement can be instrumental in refining entry strategies after the price breaks above the neckline.
Understanding Fibonacci Retracement Levels: Fibonacci retracement levels are horizontal lines that indicate potential support and resistance levels where the price could reverse or stall. These levels are derived from the Fibonacci sequence, specifically the key ratios: 38.2%, 50%, and 61.8%. Traders use these levels to anticipate where the price might pull back after a breakout and before continuing in the direction of the trend.
Entry Strategy Using Fibonacci Retracement: In the attached example, the price of Amazon (AMZN) forms a triple bottom pattern and eventually breaks out above the neckline. After the breakout, instead of immediately entering a trade, a trader could use the Fibonacci retracement tool to plan a more precise entry.
- Apply the Fibonacci Retracement Tool:
- After the breakout, draw the Fibonacci retracement from the highest point before the pattern started forming (swing high) to the lowest point of the triple bottom (swing low). This will plot the key Fibonacci levels on your chart.
- Wait for the Price to Retrace to a Key Fibonacci Level:
- Instead of entering immediately after the breakout, observe if the price retraces to one of the key Fibonacci levels, particularly the 38.2% or 50% levels. In the attached example, the price retraces back to the 38.2% level, which coincides with the neckline of the triple bottom pattern, providing a high-probability entry point.
- Enter the Trade at the Retracement Level:
- Once the price touches or slightly dips to the 38.2% retracement level, it can be an optimal point to enter a long position. This level often acts as a strong support in an uptrend, allowing for a better risk-reward ratio compared to entering at the breakout point.
Why This Strategy Works: By waiting for a pullback to a Fibonacci retracement level after a breakout, traders can avoid entering a trade at potentially overextended prices. Instead, they enter at a point where the price has corrected, providing a more favourable entry and reducing the likelihood of getting caught in a false breakout. The alignment of the 38.2% retracement with the neckline in the attached example further strengthens the entry signal, as it suggests the neckline is now acting as a support level.
Incorporating Fibonacci retracement into your trading strategy, particularly after a breakout in a pattern like the triple bottom, allows for more precise entries that can improve your trading outcomes.
Advantages of the Triple Bottom Chart Pattern
The triple bottom pattern is a powerful technical analysis tool used by traders to identify potential market reversals from a bearish to a bullish trend. Its effectiveness lies in several key advantages that make it a reliable pattern for traders seeking to capitalise on trend reversals. Here are some of the primary advantages:
- Strong Reversal Signal:
- The triple bottom pattern is known for its reliability in signalling a reversal. After forming three distinct lows at similar levels, the pattern indicates that the market has found a strong support zone. Once the price breaks above the neckline, it typically confirms a reversal, making it a strong buy signal.
- Clear Entry and Exit Points:
- One of the significant benefits of the triple bottom pattern is the clarity it provides in terms of trading decisions. The breakout above the neckline offers a clear entry point, while the measurement of the pattern’s height can be used to set profit targets. Additionally, the consistent formation of the three lows gives traders a natural level for placing stop-loss orders, thus helping in risk management.
- High Success Rate:
- The triple bottom pattern boasts a relatively high success rate when predicting trend reversals, especially in bullish market conditions. Studies and trading research indicate that this pattern can have a success rate of up to 87%, making it one of the more reliable chart patterns in technical analysis.
- Easy to Identify:
- Compared to more complex patterns, the triple bottom is relatively easy to spot on a chart. Its formation—three lows at approximately the same price level, followed by a breakout—makes it accessible even to novice traders. This simplicity adds to its popularity and effectiveness as a trading tool.
- Versatility Across Timeframes:
- The triple bottom pattern can be applied across various timeframes, from intraday to weekly charts. This versatility allows traders to use the pattern in different trading strategies, whether they are day trading, swing trading, or even long-term investing.
- Enhanced Predictive Power with Indicators:
- When used in conjunction with other technical indicators like Moving Average Convergence Divergence (MACD) or Fibonacci retracement levels, the predictive power of the triple bottom pattern is further enhanced. These indicators can confirm the pattern and provide additional insights, making the trading setup even more robust.
Overall, the triple bottom pattern offers traders a reliable and straightforward method to identify potential trend reversals, with clear entry and exit points and a high probability of success. Its combination of ease of use and effectiveness makes it a favoured tool among both novice and experienced traders.
Disadvantages of the Triple Bottom Chart Pattern
While the triple bottom pattern is a reliable tool for identifying potential bullish reversals, it is not without its limitations. Understanding these disadvantages is crucial for traders to use the pattern effectively and avoid common pitfalls.
- Time-Consuming to Form:
- The triple bottom pattern can take a long time to fully develop, particularly on higher timeframes such as daily or weekly charts. This extended formation period can be frustrating for traders who prefer quicker trades or those who are looking to capitalise on shorter-term market movements.
- False Breakouts:
- One of the significant risks associated with the triple bottom pattern is the potential for false breakouts. The price may break above the neckline temporarily but then fail to sustain the upward momentum, leading to a pullback. This can trap traders who entered based on the initial breakout, resulting in losses. Those losses can be mitigated with a stop loss placed below the pattern’s lows.
- Requires Confirmation with Other Indicators:
- While the triple bottom pattern is a strong reversal signal, relying on it alone can be risky. It often requires confirmation from other technical indicators, such as volume analysis, Moving Average Convergence Divergence (MACD), or Fibonacci retracement levels, to increase the probability of success. Without such confirmation, the pattern may not perform as expected, leading to missed opportunities or losses.
- Difficulty in Identifying True Triple Bottoms:
- Distinguishing a true triple bottom from other similar patterns, such as a double bottom or a broader consolidation phase, can be challenging. In some cases, what appears to be a triple bottom may simply be a prolonged consolidation before the price continues in the original direction, rather than reversing. This can lead to incorrect trading decisions if not carefully analysed.
- Limited Upside Potential:
- While the triple bottom pattern indicates a reversal, the upside potential may be limited, especially if the breakout occurs in a weak market or during a broader downtrend. Traders should be cautious about setting overly ambitious profit targets without considering the overall market context and other resistance levels that might limit the upward movement.
- Vulnerability to Market Volatility:
- The triple bottom pattern can be particularly vulnerable in volatile markets. Sudden news events or economic data releases can cause sharp price movements that invalidate the pattern or lead to unpredictable outcomes, making it difficult to trade effectively based on the pattern alone.
Understanding these disadvantages helps traders to approach the triple bottom pattern with a balanced perspective, ensuring that they incorporate additional analysis and risk management techniques when using it in their trading strategies.
Common Mistakes in Triple Bottom Pattern Trading
Trading the triple bottom pattern effectively requires not only understanding its basic principles but also avoiding some of the more nuanced mistakes that can undermine a strategy. Here, we’ll discuss both the obvious and more advanced mistakes traders make, focusing on how misinterpreting key signals can lead to suboptimal trading decisions.
1. Entering Too Early

- Obvious Mistake: Many traders enter the market prematurely, often mistaking an incomplete pattern for a fully-formed triple bottom. This typically happens after the second bottom, where traders assume the pattern is already confirmed and jump in before the crucial neckline breakout occurs.
- Advanced Tip: Patience is key. Wait for the price to decisively break above the neckline, ideally accompanied by increased volume, to confirm the pattern’s completion. Entering too early increases the risk of being caught in a prolonged downtrend or a sideways market that can erode capital.
2. Misidentifying the Pattern
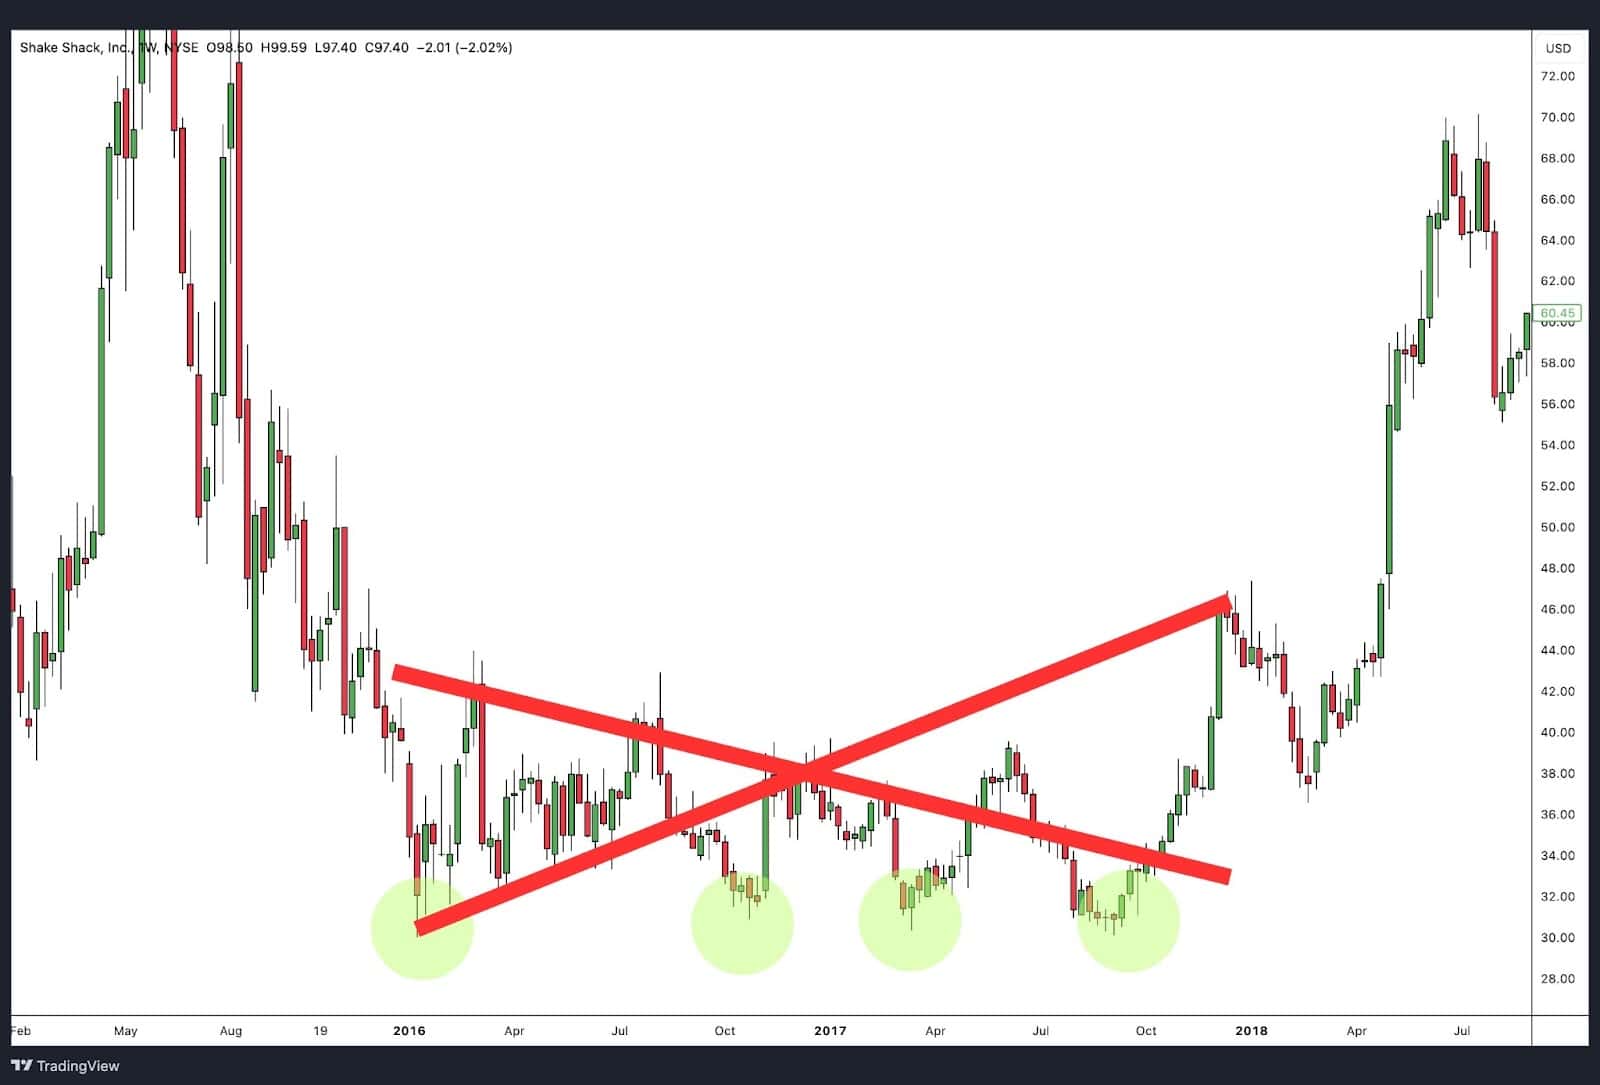
- Obvious Mistake: Traders often mistake other patterns, such as double bottoms or simple consolidation phases, for a triple bottom. This misidentification can lead to entering trades with a poor risk-reward ratio.
- Advanced Tip: Verify that the three bottoms are relatively equal in depth and that the price action forms a clear resistance line (neckline) at the same level after each bottom. Additionally, consider the broader market context—sometimes a triple bottom may just be part of a larger consolidation phase rather than a true reversal signal.
3. Selling at Resistance Rather Than Buying the Breakout
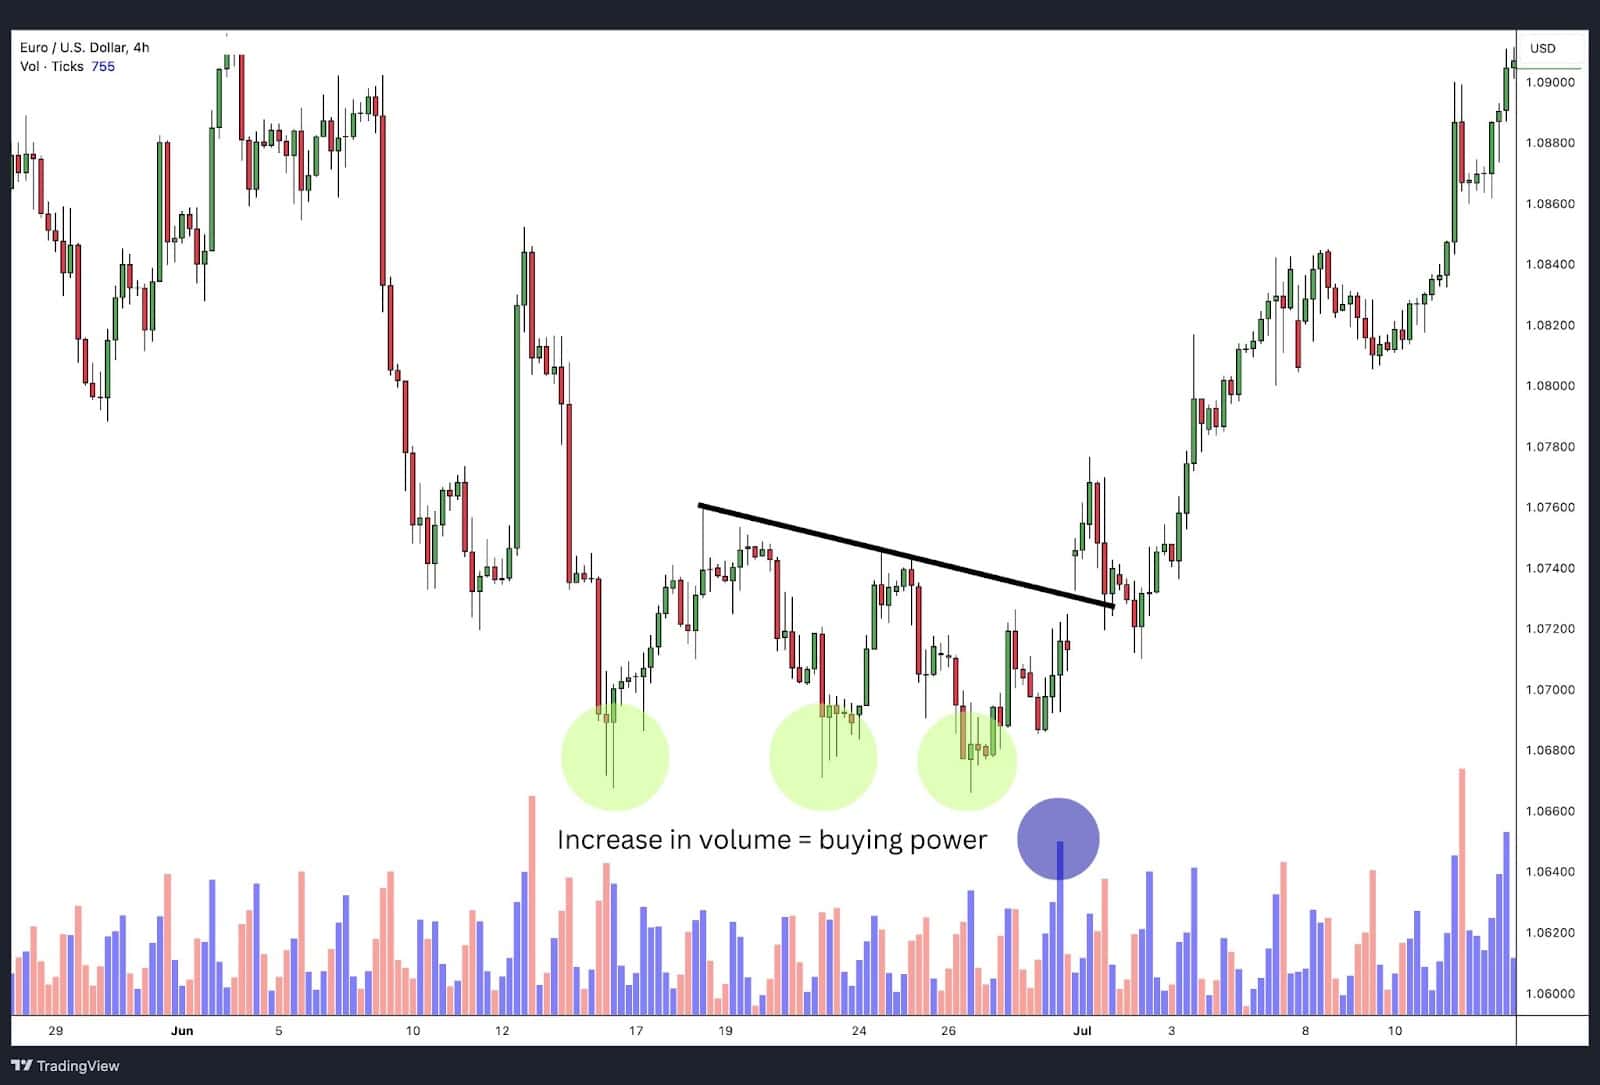
- Unique Advanced Mistake: Some traders misread the pattern entirely, anticipating that the resistance (neckline) will hold and the price will continue downward. As a result, they mistakenly sell at resistance instead of preparing to buy a breakout. This not only prevents them from capitalising on the upward momentum but also positions them against the trend at a critical juncture.
- Advanced Tip: Understand that a triple bottom pattern suggests a bullish reversal. Selling at resistance, assuming it will hold, ignores the pattern’s reversal implication. Instead, focus on setting a buy order slightly above the neckline and look out for a surge of volume for red flags if intending to sell. Surge in volume means buying pressure.. If the breakout doesn’t occur, your buy order remains untriggered, saving you from a potentially losing trade.
4. Overlooking the Broader Market Context
- Obvious Mistake: Traders sometimes isolate their analysis to the pattern alone, without considering the overall market trend. Trading a triple bottom during a strong downtrend or in a volatile market can result in the pattern failing.
- Advanced Tip: Always analyse the broader market conditions before trading a triple bottom. In a strong bearish market, the pattern might only provide a temporary rally. Align your trade with the overall market trend for better results.
5. Setting Unrealistic Profit Targets
Unrealistic Target
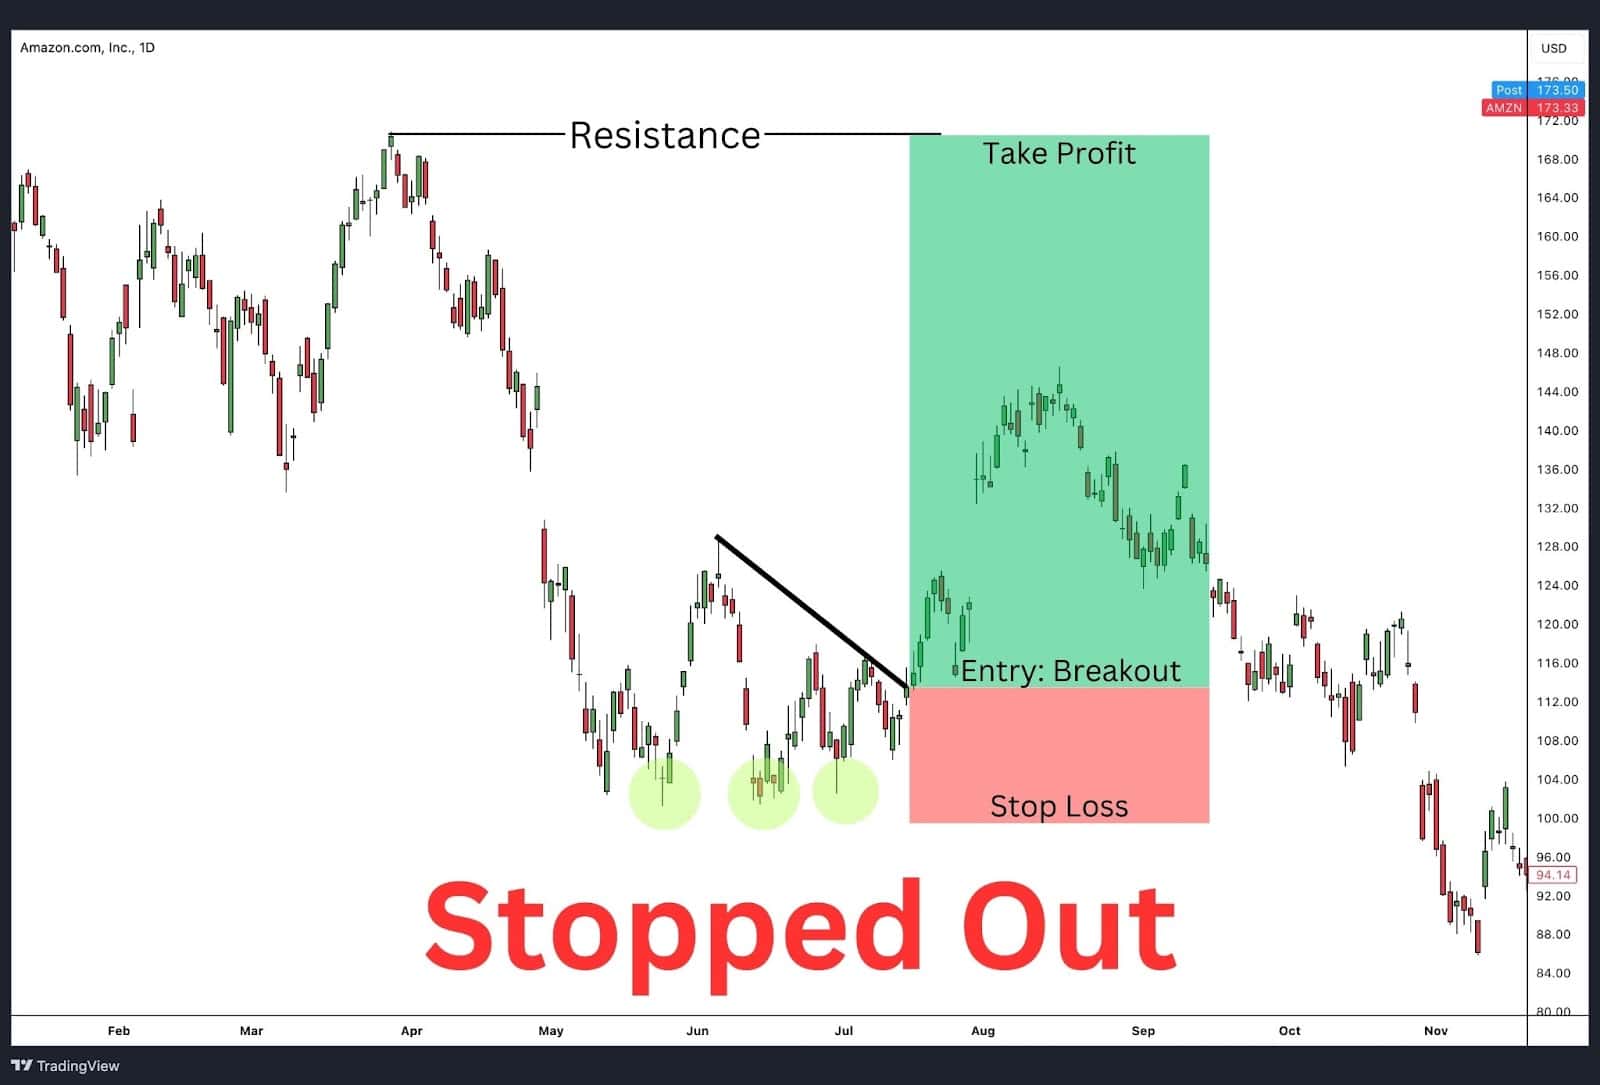
- Obvious Mistake: Traders often set their take profit target at major resistance levels after a breakout of the triple bottom pattern. While using resistance levels as targets can be common, it can also be risky. If the target is too ambitious, it might be out of reach before a reversal happens, as shown in the stopped out image. In this scenario, the price action reversed before hitting the resistance, triggering the stop loss and missing the potential profits.
Realistic Target
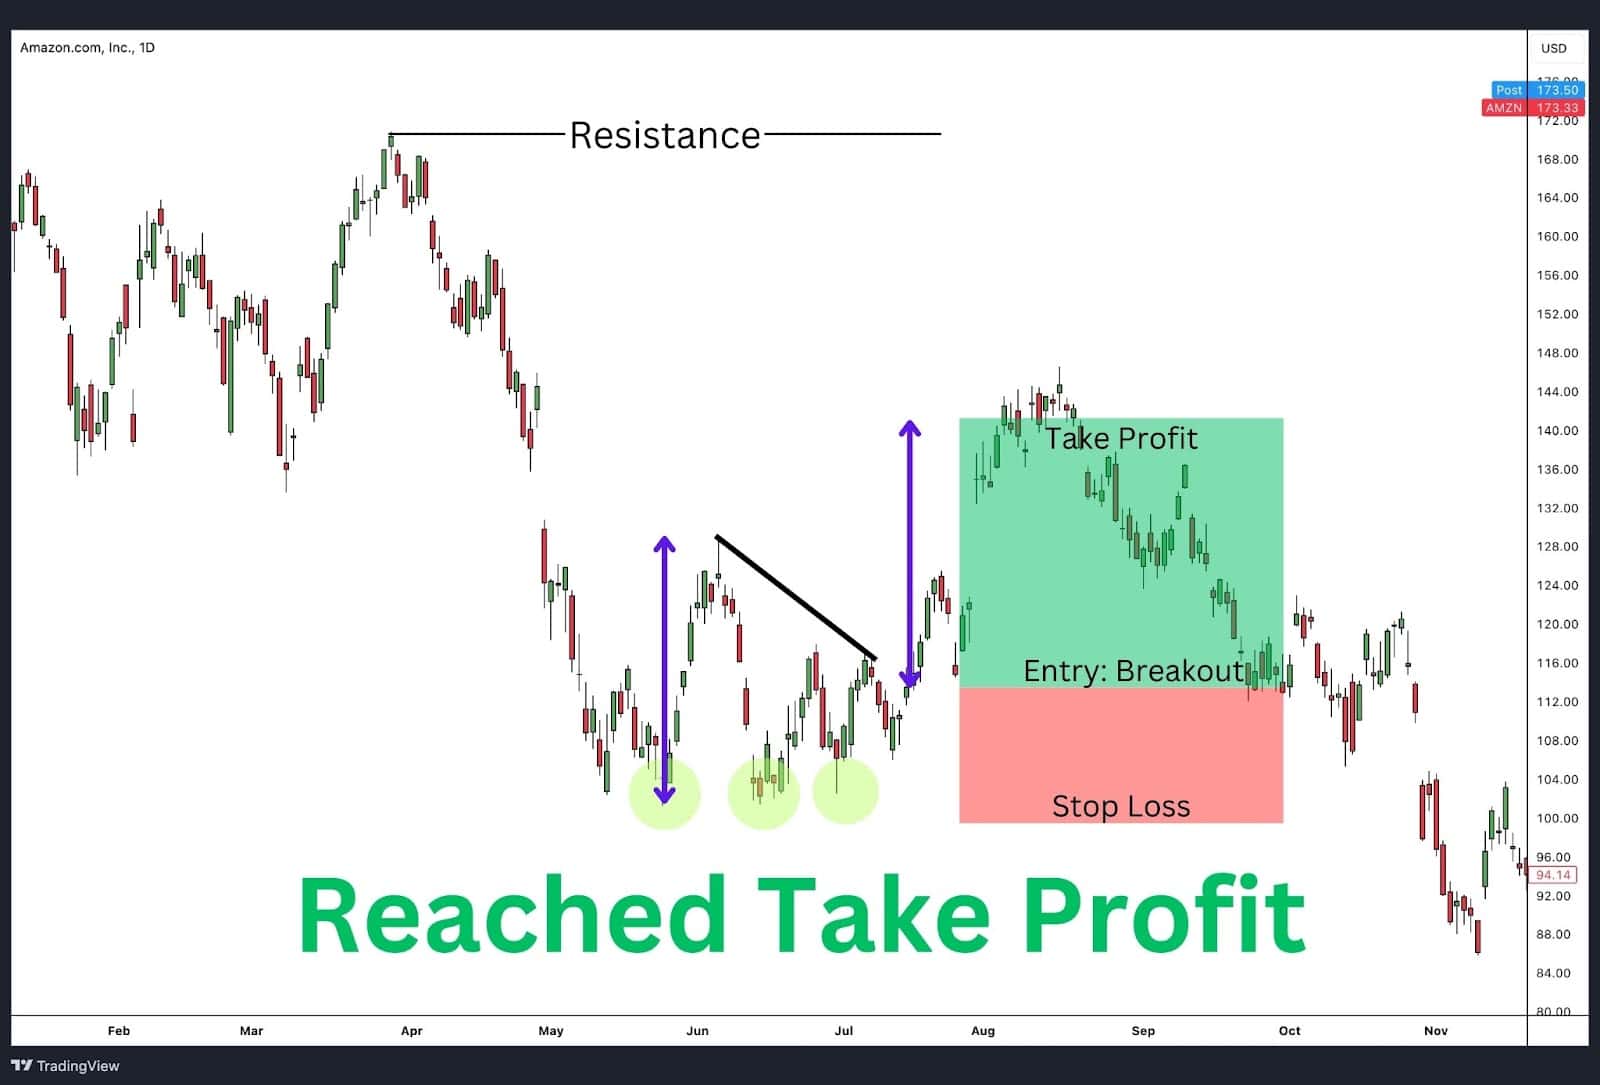
- Advanced Tip: Instead of using distant resistance levels as targets, a more strategic approach is to base the take profit on the vertical distance between the lowest bottom and the neckline of the triple bottom chart pattern. This method, shown in the reached take profit image, offers a conservative and achievable price target. Additionally, by keeping an eye on key resistance levels beyond the neckline, traders can better anticipate where the price rise might stall, helping to lock in profits without being stopped out too early.
6. Neglecting to Use a Stop-Loss
Obvious Mistake: Trading without a stop-loss or setting it too close can lead to significant losses. The market can be unpredictable, and even well-formed patterns can fail.
- Advanced Tip: Place your stop-loss just below the lowest bottom in the pattern. This gives the trade some breathing room while protecting against major losses if the market turns against you.
7. Trading on Lower Timeframes
- Obvious Mistake: Attempting to trade a triple bottom pattern on very low timeframes (e.g., 1-minute or 5-minute charts) often results in increased noise and false signals, leading to pattern failures.
- Advanced Tip: Use higher timeframes, such as 4-hour or daily charts, to identify and trade the triple bottom pattern. These timeframes reduce the impact of short-term volatility and provide a clearer picture of the market structure.
8. Over-Reliance on the Pattern Without Additional Confirmation
- Obvious Mistake: Some traders rely solely on the triple bottom pattern without seeking additional confirmation from other technical indicators, increasing the likelihood of entering weak trades.
- Advanced Tip: Combine the triple bottom with indicators such as MACD, RSI, or Fibonacci retracement levels to confirm the strength of the breakout and overall trend direction. This layered approach enhances the reliability of your trades.
By being aware of these common and advanced mistakes, traders can improve their use of the triple bottom pattern, leading to more informed decisions and better trading outcomes.
Failed Triple Bottom Pattern

While the triple bottom pattern often signals a bullish reversal, not all patterns succeed. A failed triple bottom occurs when the price fails to break out above resistance or loses momentum after the third low. In the Ford Motor Company chart, we see a clear example of this. Although the price formed three lows, it failed to sustain an upward move after the third low, leading to a potential breakdown.
No Bounce After the Third Low
Typically, the price should rally after the third low. When it doesn’t, it signals a lack of buying pressure. This could lead to a descending triangle, where the support holds, but the highs get lower, indicating weakness. If the support breaks, the price may continue downward.
Failure to Follow Through
Sometimes, the price breaks above the resistance but fails to hold. This false breakout can lead to bearish patterns like a bearish symmetrical triangle or a flat pattern in Elliott Wave Theory, indicating a potential continuation of the downtrend.
Bearish Continuation
If the price falls below the third low, the pattern is invalidated, often leading to a continuation of the downtrend. In the Ford chart, a break below the third low ($11–$12) would likely lead to further declines.
Managing Risk in a Failed Pattern
- Use stop-losses just below the third low to limit losses.
- Wait for confirmation of a strong breakout before entering.
- Exit early if signs of failure appear, such as weak follow-through or a false breakout.
A failed triple bottom can lead to bearish outcomes, so traders should manage risk carefully when patterns don’t play out as expected.
Triple Bottom vs Double Bottom

While both the triple bottom and double bottom patterns are bullish reversal indicators, they differ in structure and reliability. A double bottom pattern features two lows at similar levels, while a triple bottom, as the name implies, consists of three lows.
The triple bottom is generally considered more reliable due to the added confirmation provided by the third low, though double bottoms are more common and provide more frequent opportunities. Choosing between these patterns can be likened to selecting between a readily available but less substantial snack and a rarer, more satisfying one.
Triple Bottom vs Triple Top

The triple bottom and triple top patterns are similar patterns but in opposite directions. In contrast to the bullish triple bottom pattern, the triple top pattern signals a bearish reversal.
The bearish triple top reversal pattern marks price action that fails to break through resistance after three attempts, leading to a significant price drop. While the triple bottom suggests a bullish trend, the triple top indicates a potential shift towards a bearish trend.
Triple Bottom vs Inverse Head and Shoulders

Both the triple bottom and the inverse head and shoulders patterns indicate a bullish reversal, signalling a transition from a downtrend to an uptrend. Both patterns include a neckline and can be traded in similar methods. However, they differ structurally.
The triple bottom features three equal lows, whereas the inverse head and shoulders has a central low flanked by two higher lows, resembling a head and shoulders formation. Traders often confuse these patterns; in such cases, a line chart can provide a clearer view of the pattern formation. Despite these differences, both patterns are valuable for identifying potential trend reversals.
Triple Bottom vs Descending Triangle

The triple bottom and descending triangle are both continuation and reversal patterns, but they signal different outcomes. A triple bottom indicates a bullish reversal after the price forms three equal lows, suggesting the end of a downtrend. In contrast, a descending triangle typically signals a bearish continuation pattern, where the price forms lower highs against a horizontal support, often leading to a breakdown below support.
Triple Bottom vs Falling Wedge

Both the triple bottom and falling wedge are bullish reversal patterns, but they differ in structure and implications. A triple bottom forms with three equal lows, indicating strong support and a likely reversal upward. The falling wedge, however, is characterised by converging trend lines that slope downward, signaling a gradual loss of selling momentum before a breakout to the upside. The three lows in the falling wedge are not horizontal in price.
Triple Bottom vs Quasimodo Pattern

The Triple Bottom pattern is characterised by three equal-level support zones, where the price tests a horizontal support line three times without breaking lower. This structure indicates strong buying interest at the support level, creating a base for a reversal. In contrast, the Inverse Quasimodo pattern operates in a flow sequence of lower lows and lower highs, with the final lowest low (head) forming an impulsive move that breaks and closes below both the left and right shoulders. This critical break of structure confirms the start of a potential new trend.
In terms of entry, the Triple Bottom requires a neckline break for confirmation, making it a delayed but safer setup. The Inverse Quasimodo, however, allows for an earlier entry at a price similar to the left shoulder or 78.6% Fibonacci retracement of the new impulsive move. This offers a better risk-to-reward ratio. This earlier entry reflects a trader’s confidence in the new trend continuing after the reversal has already occurred. While both patterns are effective, the Quasimodo’s dynamic structure provides an opportunity to capture moves earlier than the static nature of the Triple Bottom.
FAQ
Is a Triple Bottom Bullish or Bearish?
A triple bottom pattern is considered a bullish signal in technical analysis. It serves as a bullish reversal pattern, indicating a potential shift from a downtrend to an uptrend. This pattern suggests that selling pressure is diminishing while buying pressure is gaining strength, leading to a likely increase in price.
How Reliable Is a Triple Bottom Pattern?
The triple bottom pattern is recognised as one of the most reliable chart patterns in technical analysis. It boasts a success rate of approximately 75%, and in some cases, as high as 87%, according to data from Liberated Stock Trader and Bullish Bears.
This high degree of reliability, coupled with the pattern’s relatively straightforward identification process, makes it a popular choice among technical traders. However, like all trading strategies, the effectiveness of the triple bottom pattern can vary based on overall market conditions and the specific asset being analysed.
What Timeframes Work Best with the Triple Bottom Pattern?
The triple bottom pattern is typically more reliable on longer timeframes, such as daily, weekly, or monthly charts. These longer timeframes help filter out the noise often present in shorter timeframes, which can lead to false signals and unreliable pattern formations.


