


Written by:

Reviewed by:

Bearish
- August 27, 2025
- 14 min read
Understanding the Long Squeeze: Impact on Your Investment Strategy
Long squeezes are volatile, dangerous moves that can punish bullish traders, and they happen when we’re at critical price levels. Understanding how they happen is extremely helpful in your ability to stay afloat, even during black swan events.
In this guide, we break down what they are, why they happen, and how to spot them early. Learn how long squeezes trap bullish traders and trigger brutal sell-offs.
What is a Long Squeeze?
A long squeeze is a sharp, rapid drop in price that often catches both retail investors and institutions off guard. Understanding how it unfolds is crucial for managing risk — especially since emotional exits often make the squeeze even worse.
It starts when the price of an asset suddenly declines, forcing long-position holders to sell. This initial drop triggers panic, accelerating the sell-off as more traders rush to exit. Selling pressure intensifies, and sentiment turns sharply bearish — often triggering stop-losses across the board, including those of institutional players.
In some markets, call options can add fuel to the fire. When many traders are holding leveraged call positions and price turns, those options can rapidly lose value. As premiums decay or margin calls hit, options traders are forced to exit too — adding even more pressure. This is especially common in equities, where retail traders often chase upside through short-dated calls.
How Does a Long Squeeze Work?
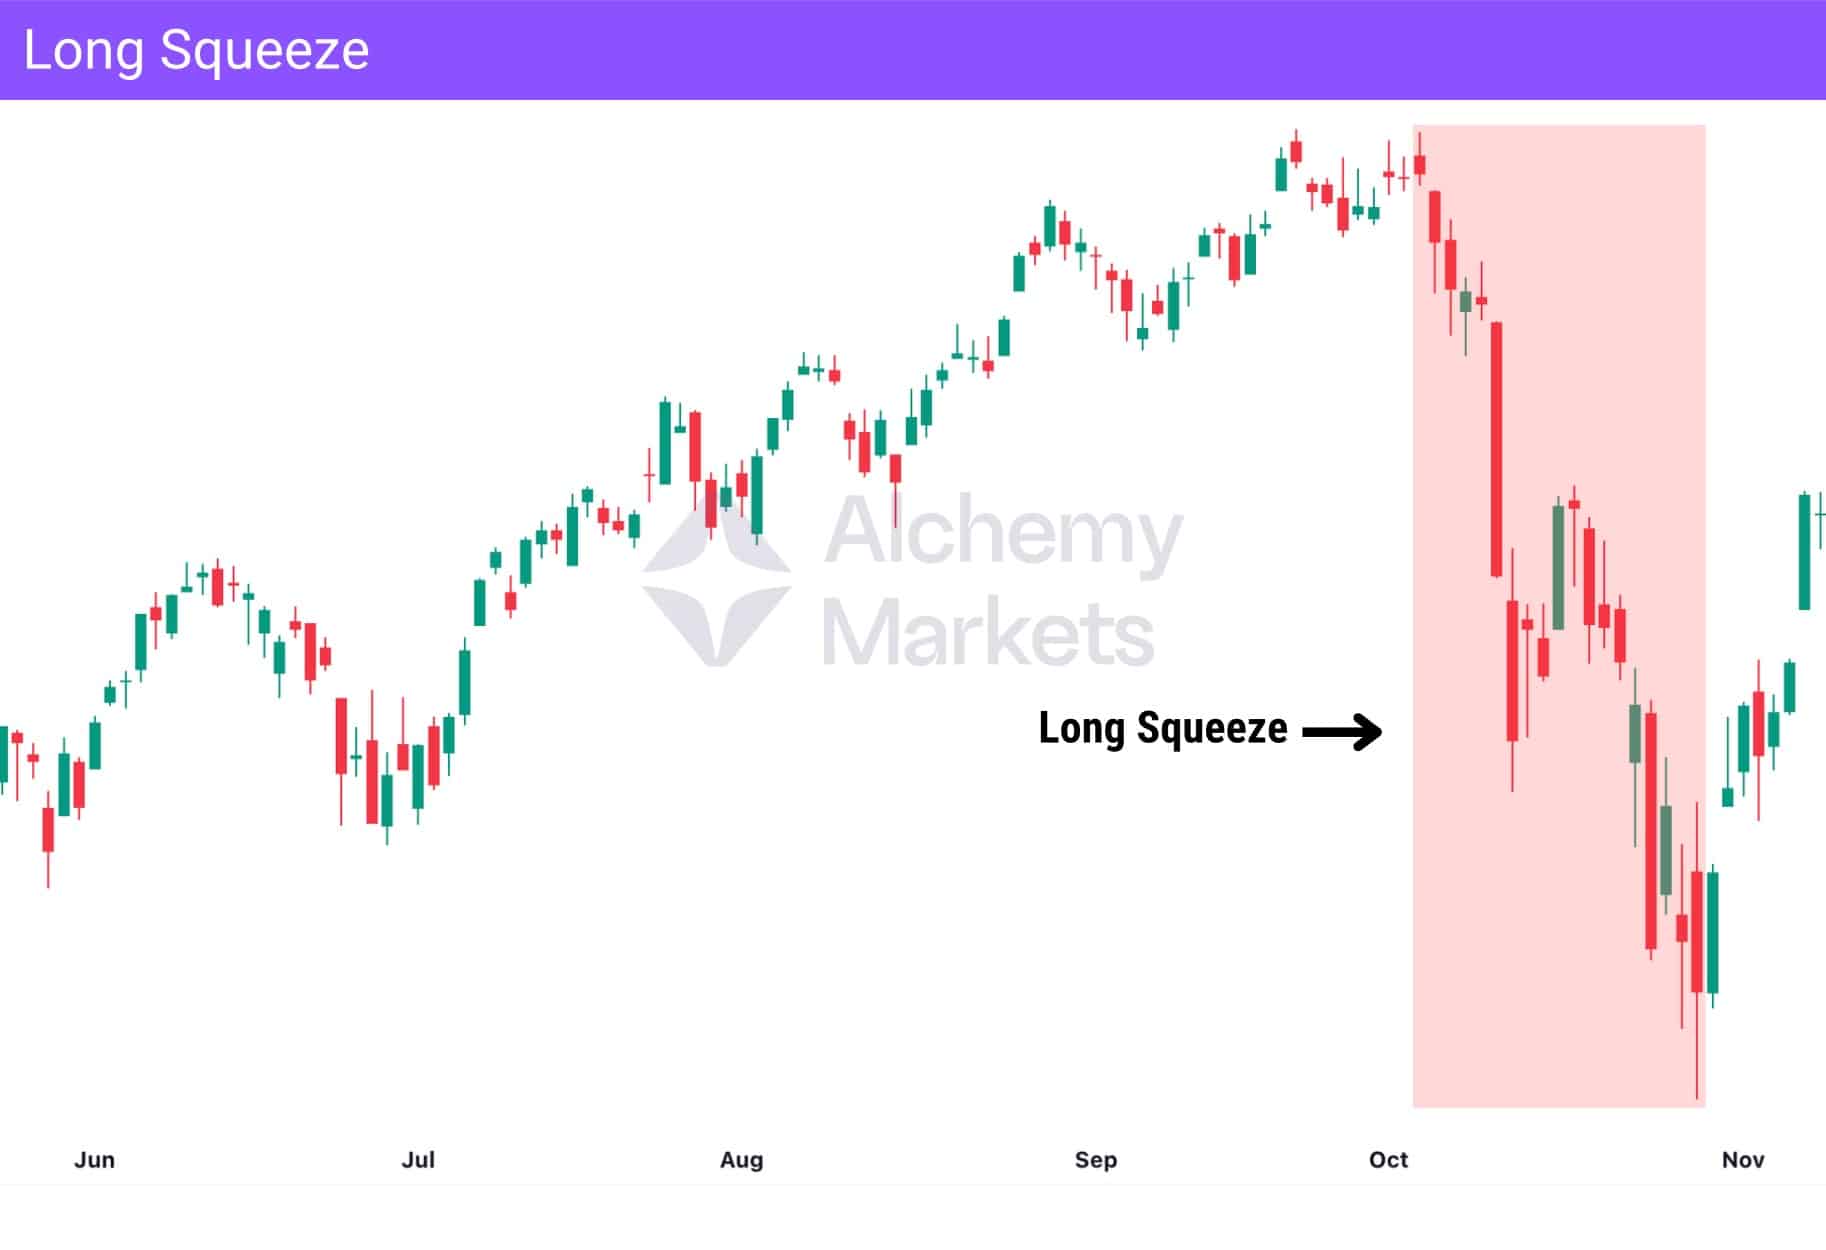
A long squeeze essentially works by triggering a chain reaction in the market. This happens when a significant number of investors and traders are bullish and holding long positions in a particular asset, and then the asset’s price suddenly declines, triggering panic selling.
This wave of sudden selling pressure drives the price even lower, creating a self-reinforcing cycle. In more severe and prolonged cases, this scenario is also referred to as ‘capitulation,’ as investors collectively abandon their positions in fear.
For example, in an equities market, a specific stock may have been on a prolonged bullish rally when the stock’s price suddenly dips. Since the stock has been on the rise, many traders and investors have entered into long positions, expecting the stock to continue its bullish trajectory, but a rapid drop can catch them off guard, triggering panic selling that amplifies the decline, resulting in a brutal selloff as a downward spiral ensues.
What Causes Long Squeeze?
The long squeeze is caused by panic selling among long holders as they scramble to close their positions. As more long investors rush to dump their holdings, the sell-off gains momentum as the wave of sell orders creates intense one-sided market pressure.
In futures markets, open interest data can offer early clues — if long positions dominate the open interest, it increases the risk of a long squeeze should sentiment suddenly flip. A crowded long side means there’s more potential for forced exits when price turns against them.
This rapid decline in price then leads to further significant losses for those investors and traders still holding long positions, as they become ‘squeezed’ the lower the price goes.
Long Squeeze Real-Life Example
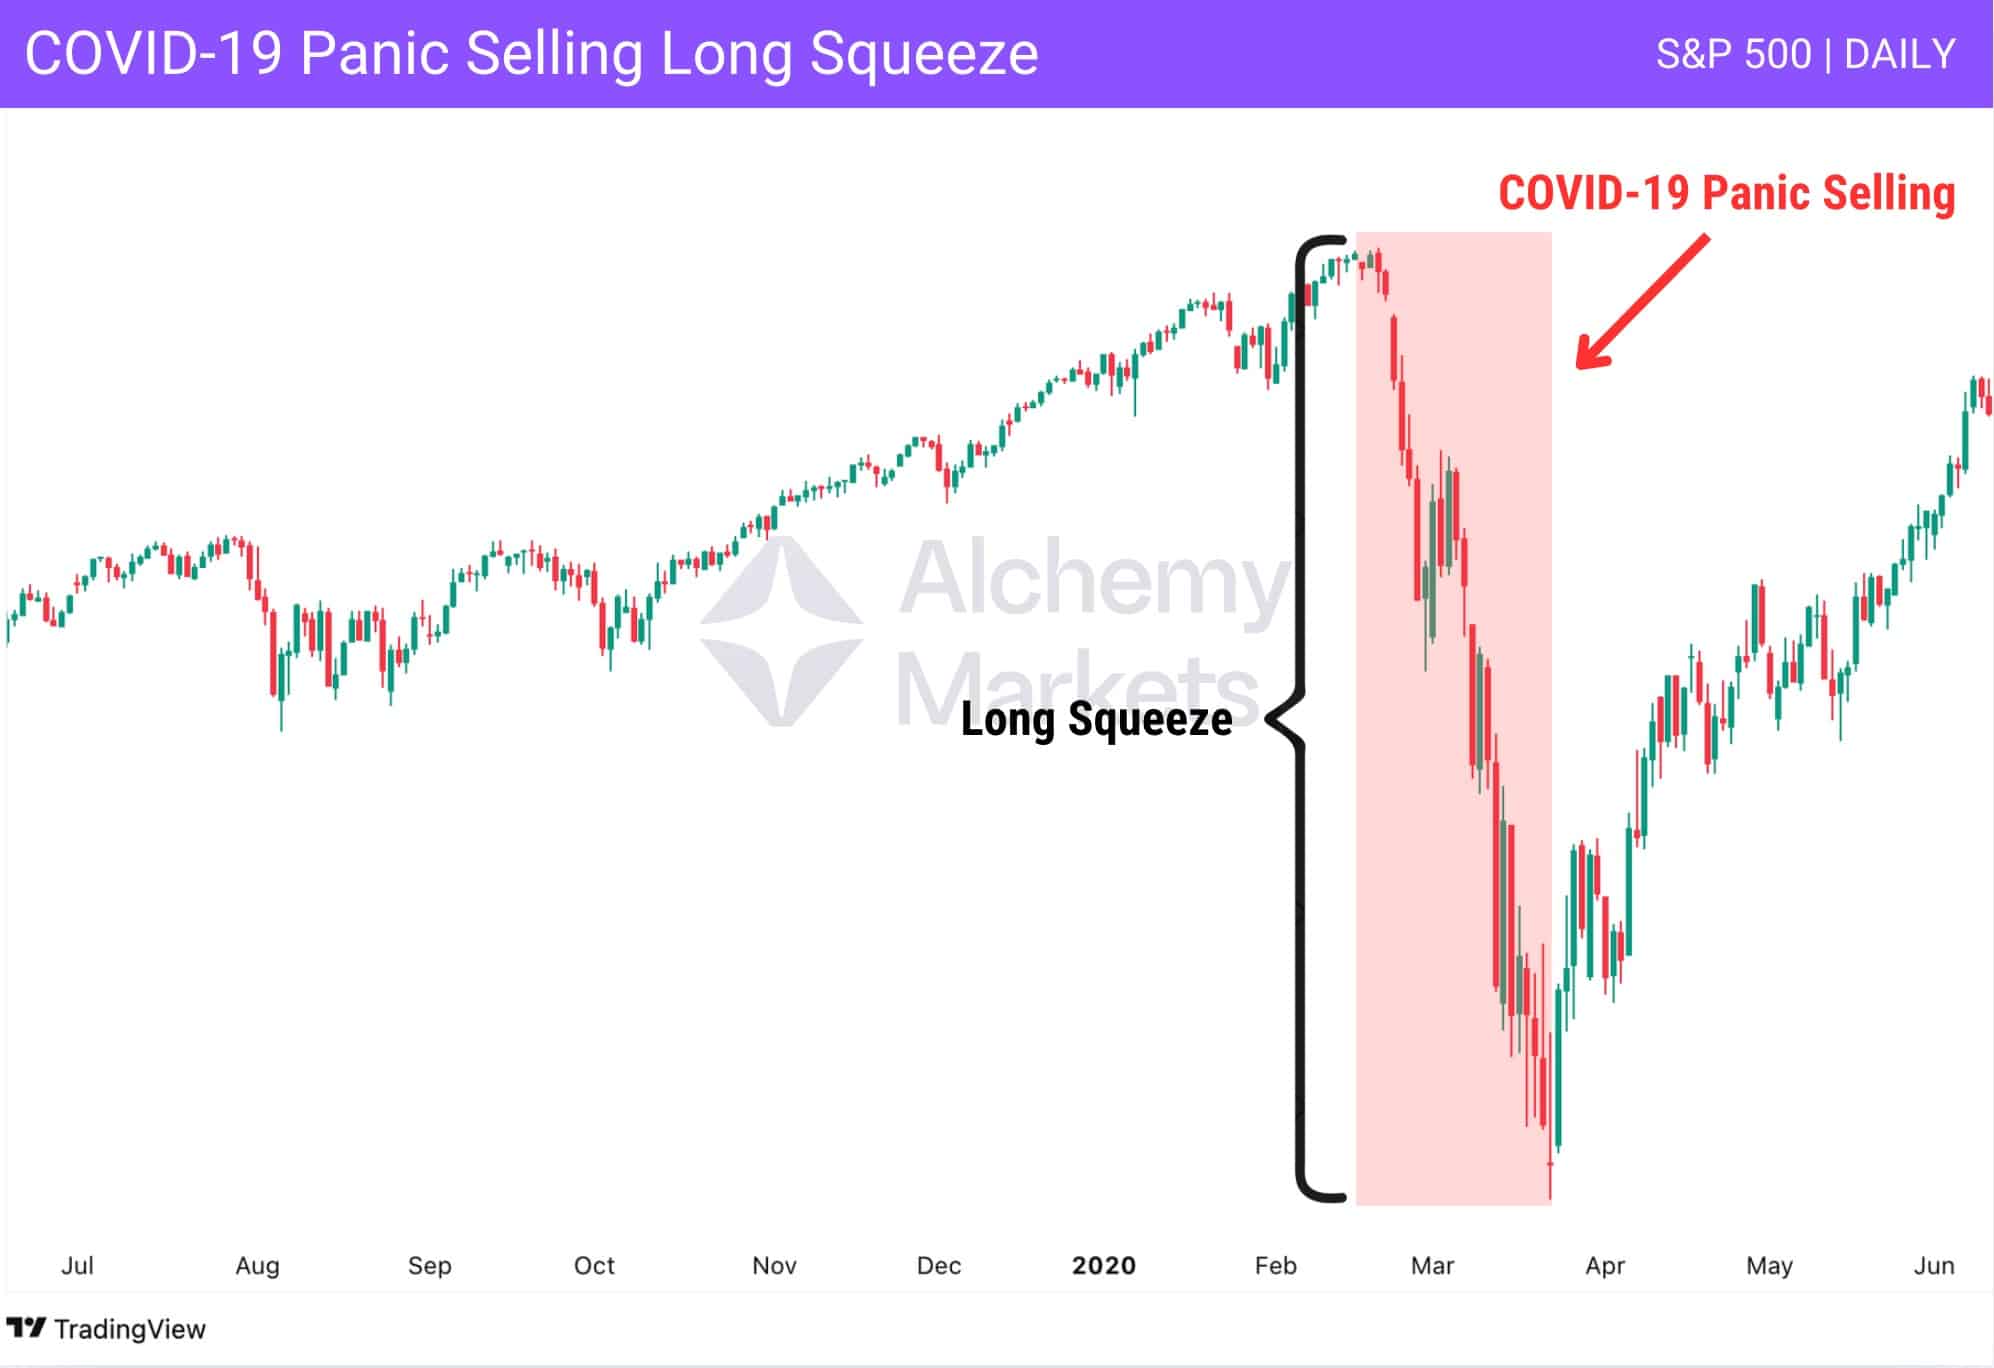
The COVID crash in early 2020 is one of the clearest examples of a long squeeze. The S&P 500 had been in a steady uptrend, making higher highs right into February.
Then, panic hit.
As the world realised how big of a deal COVID-19 was, the virus’s spread and lockdown fears grew. Traders and institutions immediately began dumping their positions fast.
In just a month, the S&P 500 dropped over 30%. Around 42% of retail investors sold at least one stock during that crash — not to take profits, but out of fear. That panic selling made the drop even worse, triggering more exits and feeding the freefall.
By late March, the selling pressure dried up. Traders began realising the market had likely overreacted. From April onwards, the S&P started bouncing back, eventually returning to its bullish trend. Almost all of those 42% of investors regretted selling their stock holding.
This shows how brutal long squeezes can be — fast, emotional, and dangerous. They often don’t last long, but they hit hard. And for less experienced traders, that kind of volatility can lead to costly mistakes.
How to Identify a Long Squeeze
To help you identify a valid long squeeze, this example clearly illustrates how a long squeeze unfolds.
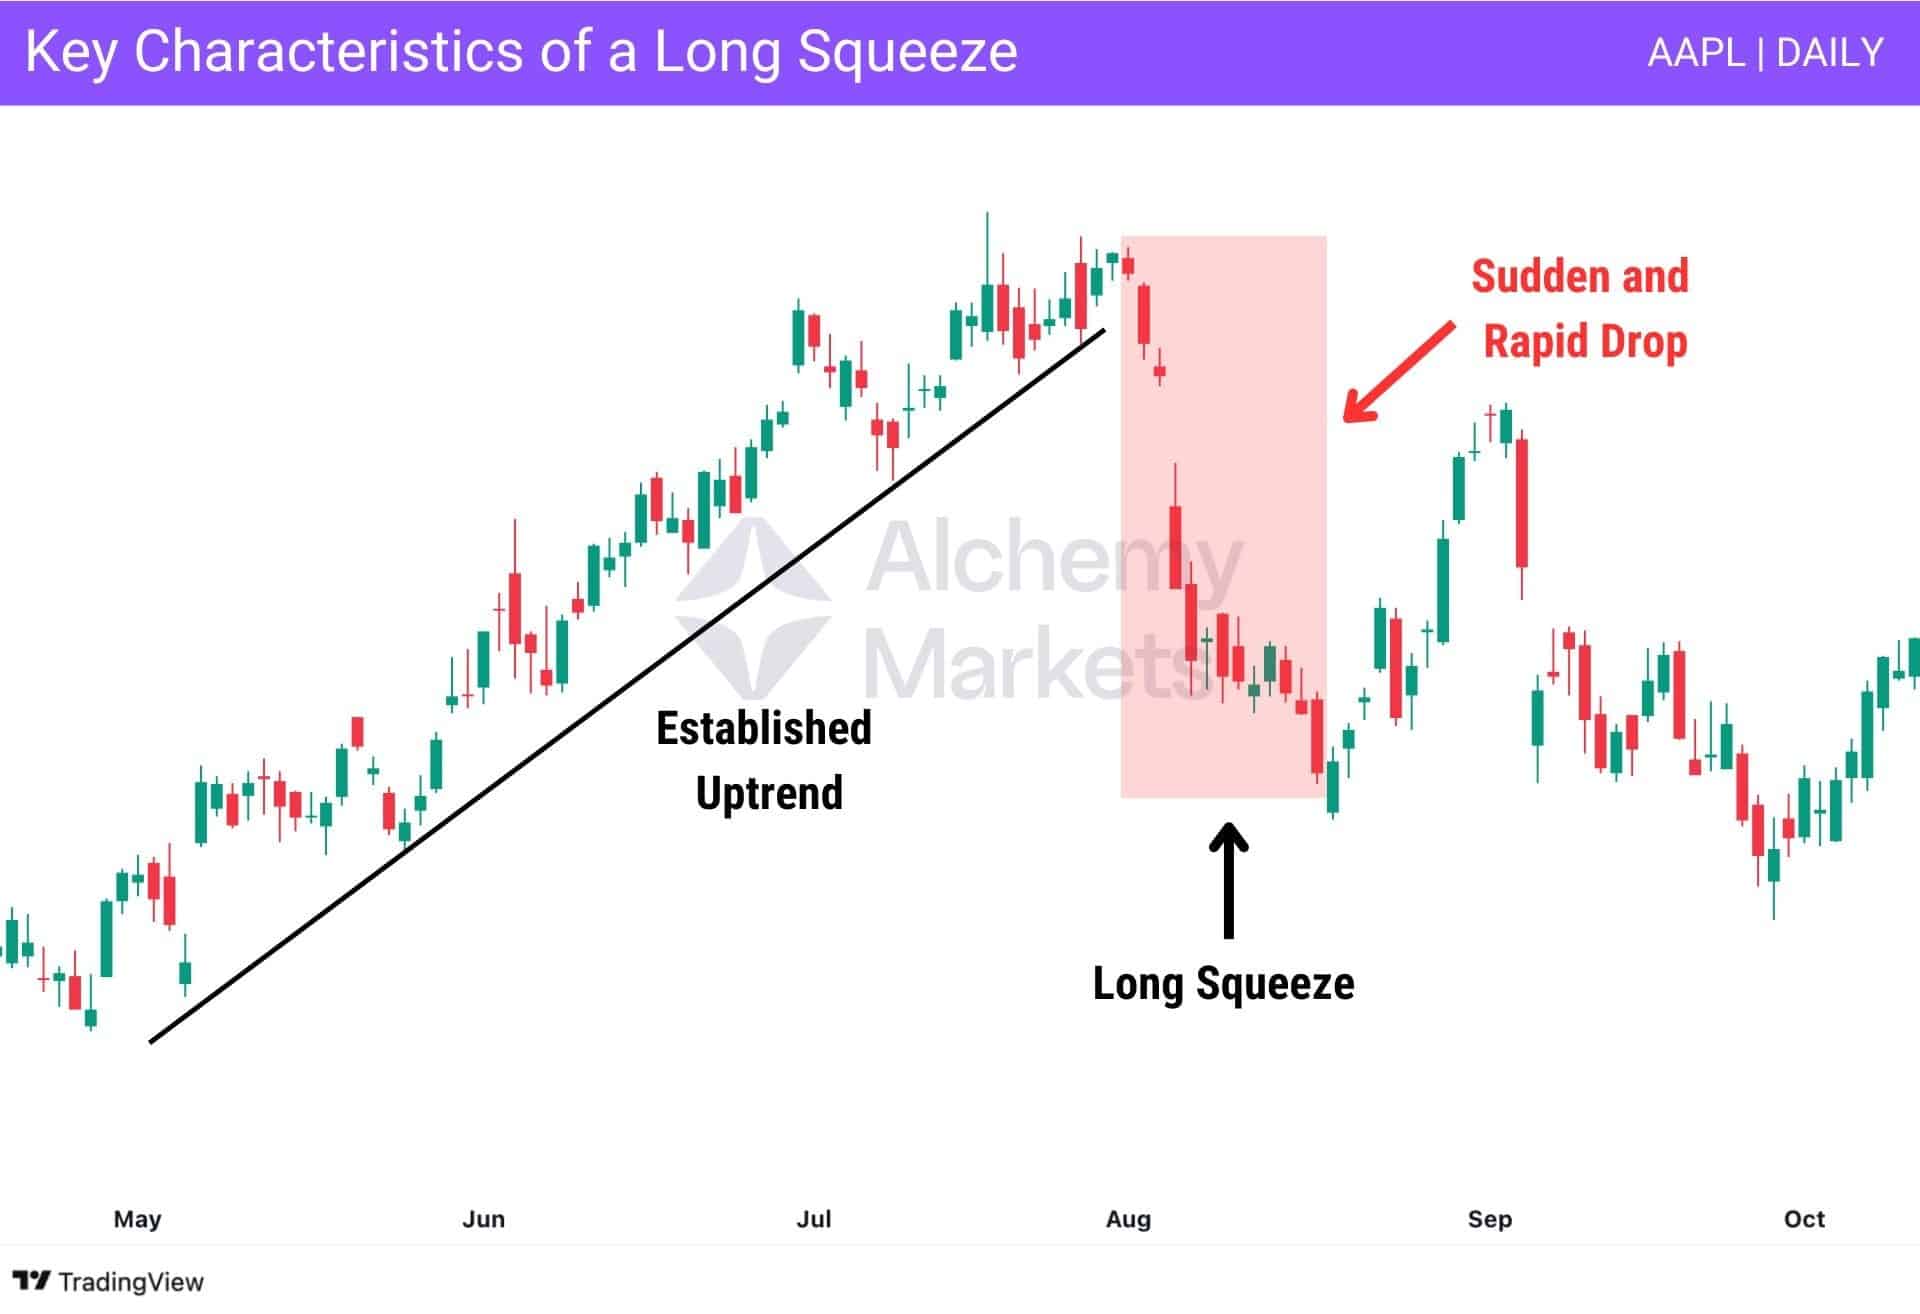
Essentially, to successfully identify one, the asset must meet the following three key conditions:
First, the asset must be coming off a strong bullish trend. For a long squeeze to be considered valid, there must be clear evidence of a prevailing rally, as this reflects the dominant and decisive bullish market sentiment. Without this initial condition, a long squeeze cannot develop.
Second, after enjoying continued upward momentum, the price declines sharply. This unexpected drop triggers panic selling among investors and traders, as it catches them off guard, given the perceived bullish momentum the price was supposed to maintain. Some try to secure their gains (if they’ve been in the trade for a while), while others attempt to cut losses quickly (especially newer entrants to the asset). Both actions, however, fuel the sell-off and contribute to even lower prices.
Third, while the price declines sharply during a long squeeze, it’s important to note that the move is often short-lived. In fact, once the panic selling is exhausted, the price typically stabilises – or even bounces back. Remember that a long squeeze is intense, yet it cannot sustain itself for long. Sure, the downward pressure builds quickly, but once the selling slows down, the bearish momentum usually fades, and the price stops making sharp downward moves.
Note: The chart above highlights all three conditions of a long squeeze: a clear uptrend, followed by a sudden and rapid drop, and finally, a sharp bounce once the panic selling fades.
Long Squeeze Trading Strategies
The long squeeze can be difficult to trade in the heat of the moment. Hence, here are some approaches we recommend you consider:
Short selling using CFDs or Spread Bets
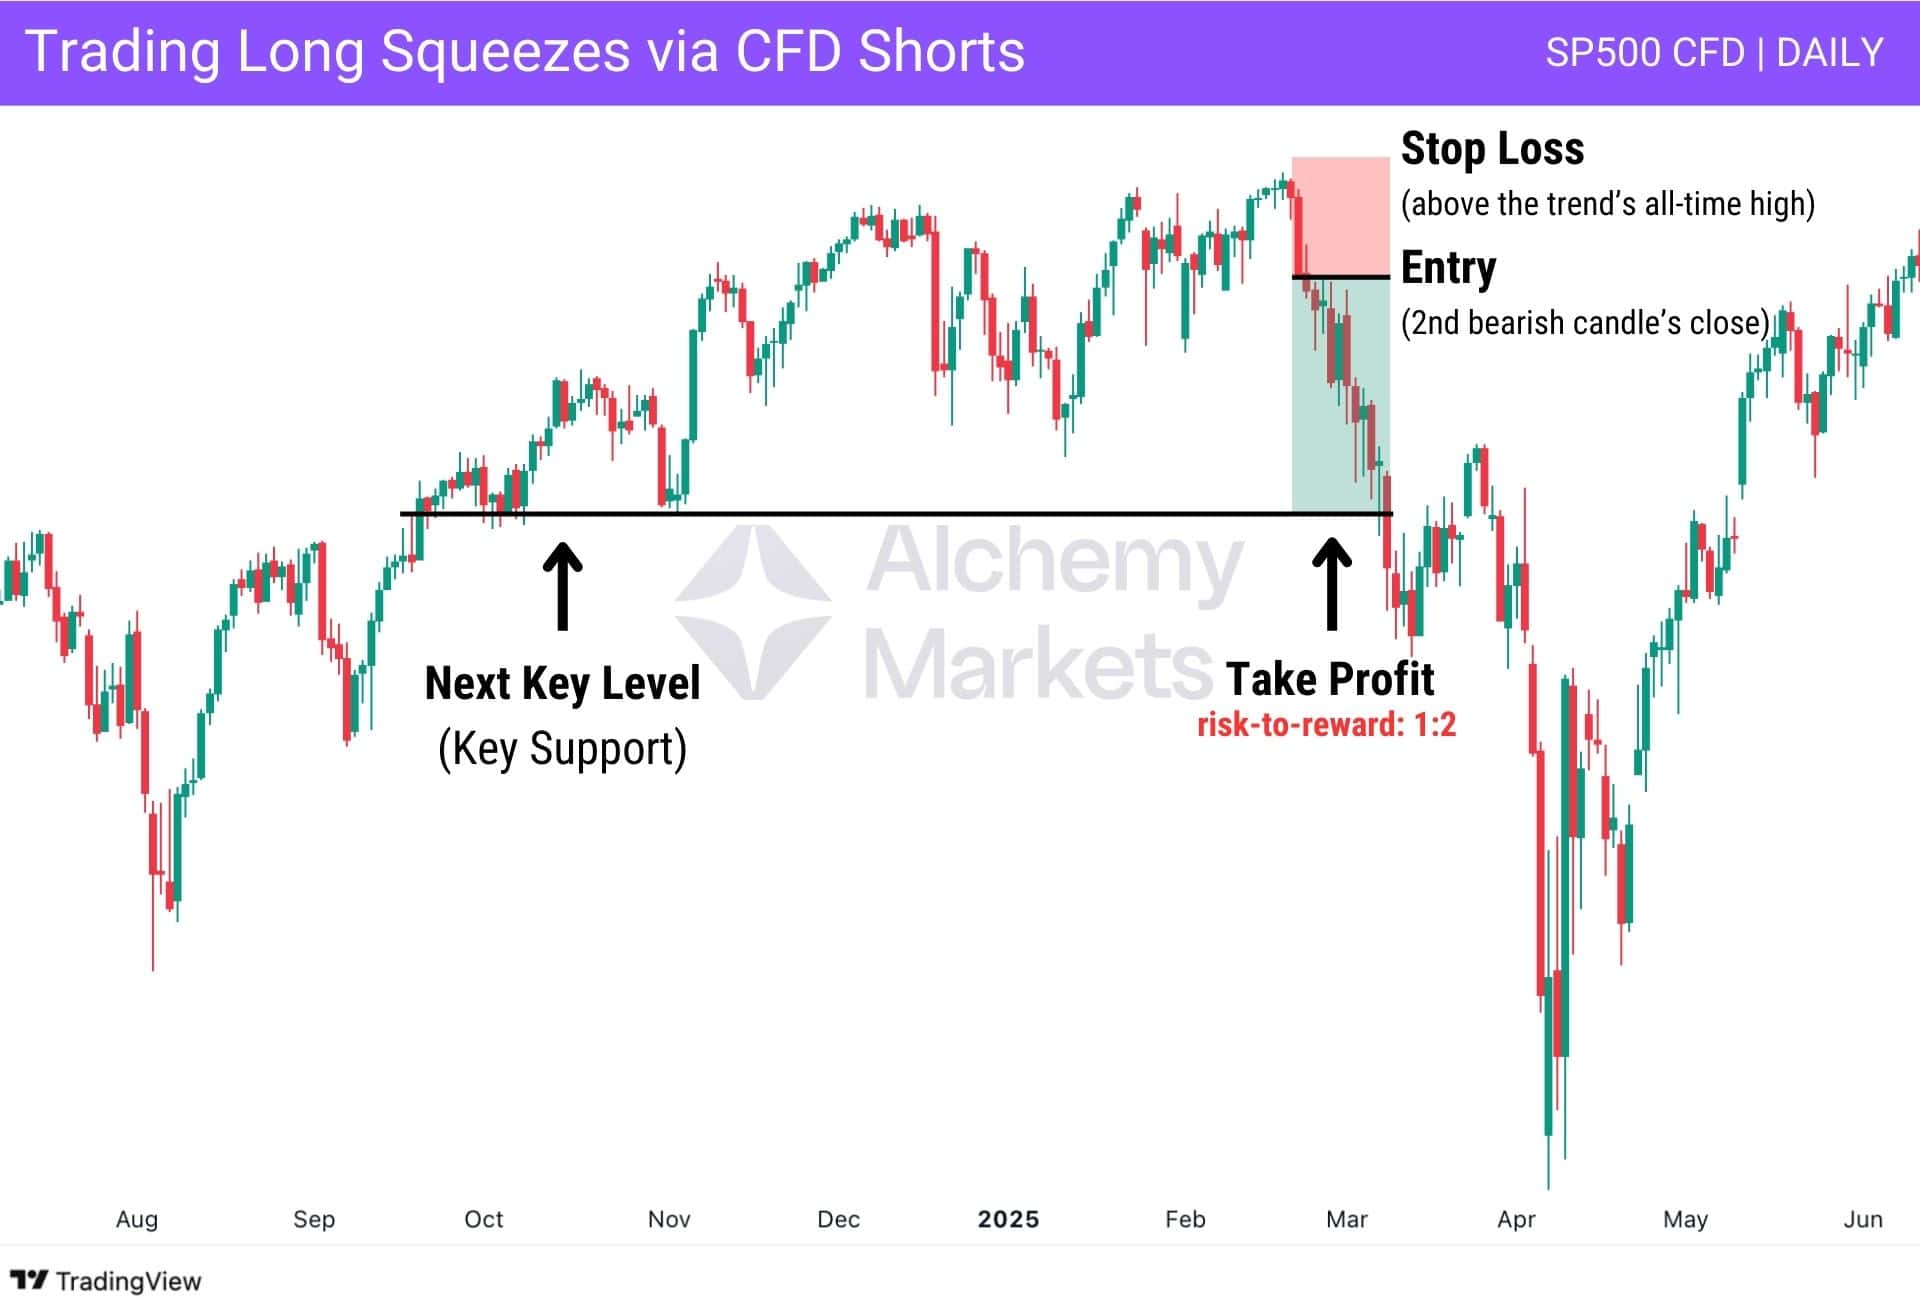
The first strategy for trading a long squeeze is to use short selling with Contracts for Difference (CFDs) or spread bets. CFDs are financial derivatives that enable traders to bet on an asset’s price movements without directly buying or owning the underlying asset (e.g. shares). Suppose the CFD is based on a share; in this particular setup, you can profit from a falling price by speculating on its decline. For example, when a long squeeze starts to unfold, you can then open a short position to capture potential gains as panic selling unfolds and the price dips.
That said, this strategy carries significant risk, as a short squeeze may unexpectedly follow or credit squeezes may tighten liquidity, wiping out your potential profits as the price rises.
| Credit squeeze: Refers to a situation where financial conditions tighten and borrowing becomes more difficult — making it harder for traders and institutions to access margin or capital. In the context of a long squeeze, this can make things worse, as fewer participants have the leverage to hold their positions or buy the dip, amplifying the selling pressure. |
Hence, we recommend maintaining a risk-to-reward ratio of at least 1:2. In other words, your potential upside should be at least twice the amount you’re willing to lose if the trade doesn’t go in your favour.
How you can trade it:
- Entry: Enter as price breaks below the support line.
- Stop Loss: Just above the high of the candle before the breakdown.
- Take Profit: Aim for the next key structure level — or just above it for a safer exit.
Stop-Loss Orders
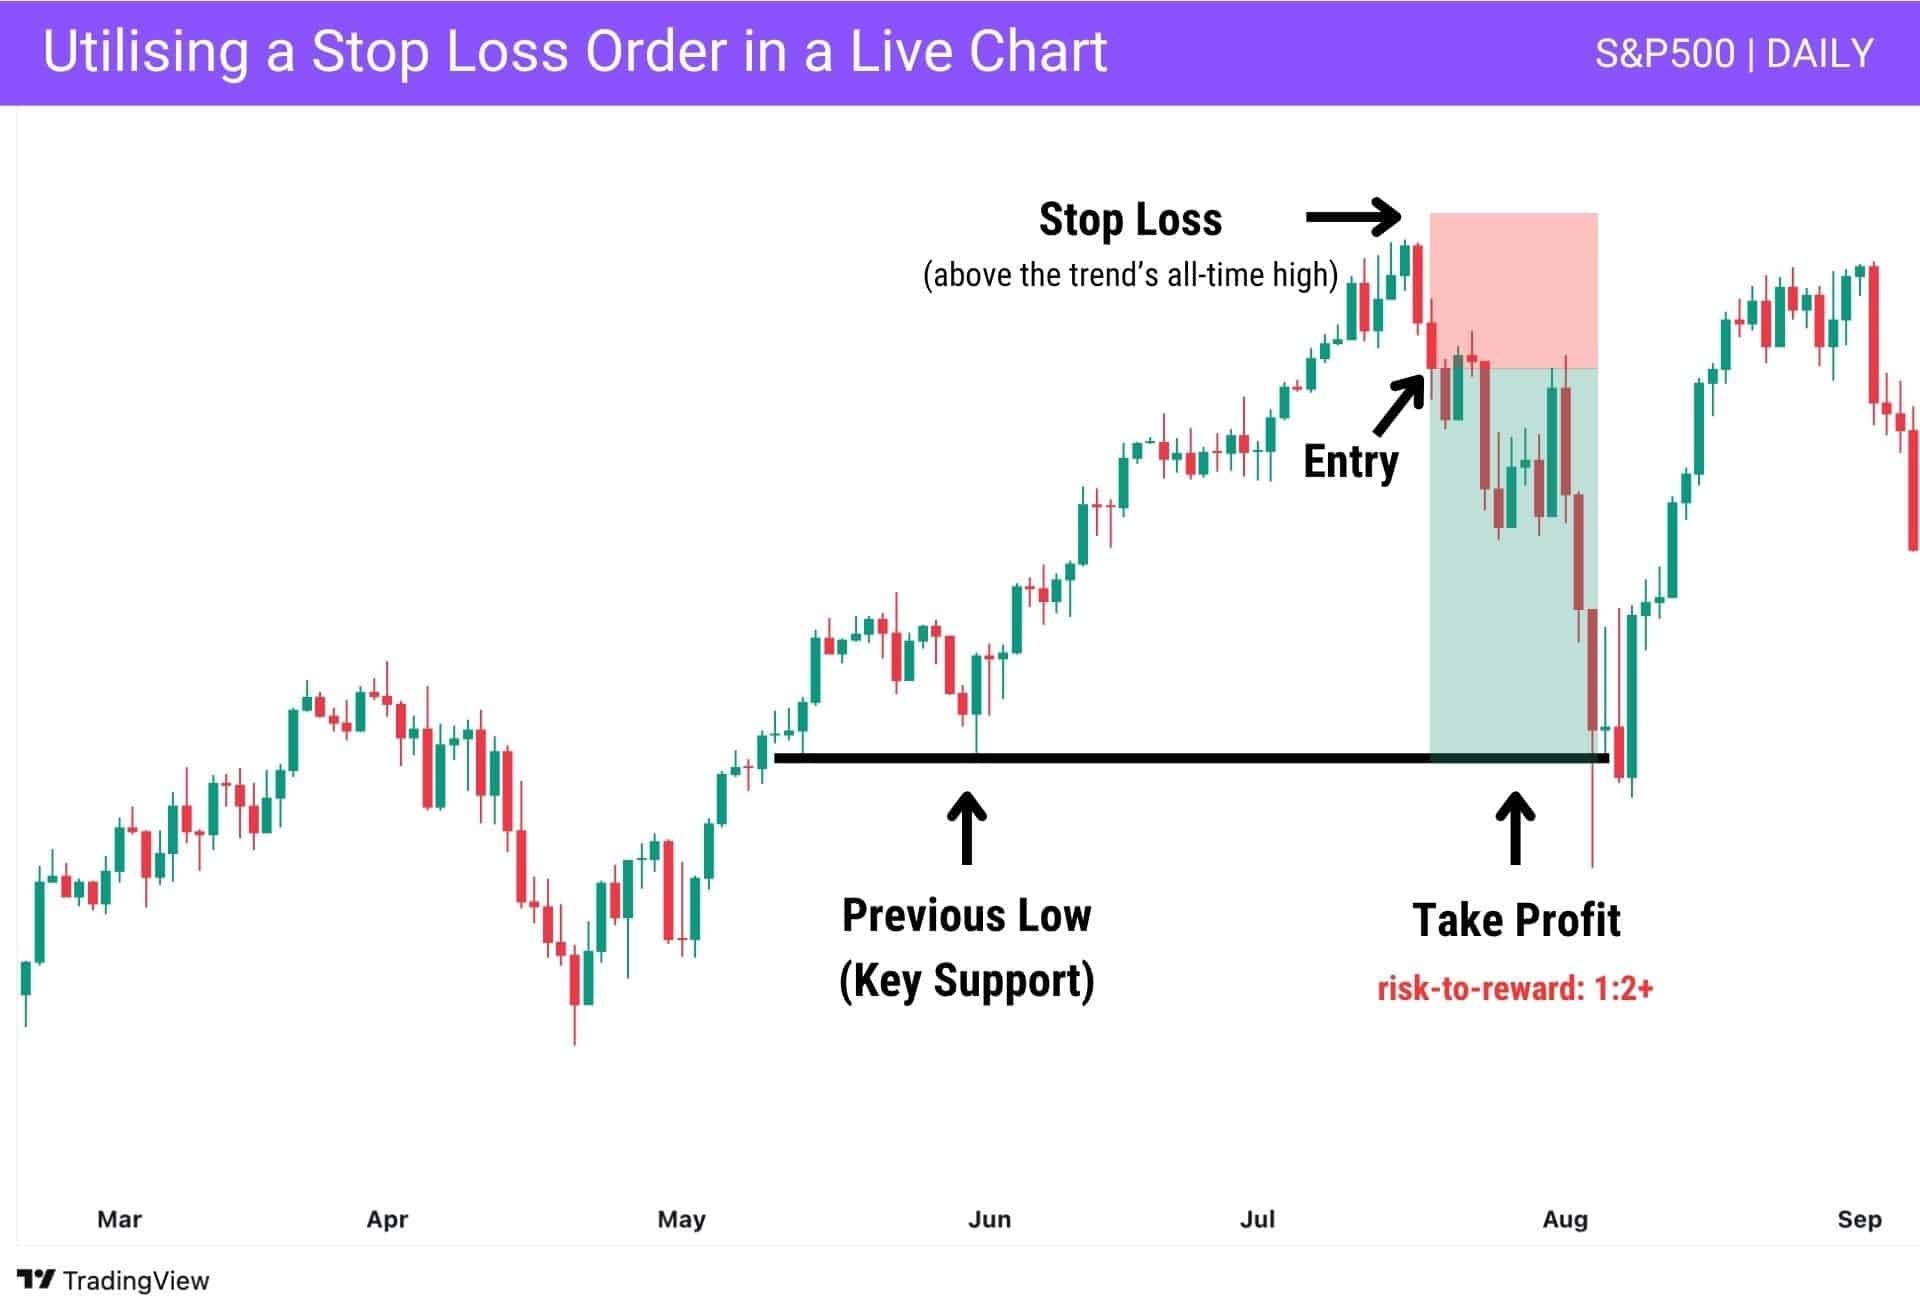
Another strategy that is primarily focused on risk management is placing a well-defined stop-loss order to manage your risk during a long squeeze.
This approach essentially removes emotion from your decision-making process, helping you stay disciplined. To illustrate, the image above shows a hypothetical trade where you can place your entry (based on the current market price) after confirming a possible long squeeze. However, before you even place your entry, it is crucial to pinpoint your stop-loss – the price level where you will definitively, no-questions-asked, exit your trade when the price moves against your favour.
For your stop-loss order, we highly recommend using the asset’s price structure as your basis. For instance, if you plan to trade a potential long squeeze, it’s prudent to place your stop-loss just above the previous high. This is because if the price reaches this level – especially if it closes above the previous high – then the long squeeze setup is likely invalidated. This approach protects you from taking excessive risk relative to the potential upside. Again, we recommend only taking trades with a risk-to-reward ratio of at least 1:2.
How you can trade it:
Entry: Consider entering on the second bearish candle, or at the presence of a long-bodied bearish candle, as this can signal the start of the long squeeze.
Stop Loss: Place your stop-loss just above the previous high of the uptrend, as a break above this level may invalidate the long squeeze setup.
Take Profit: Place your take profit just before a key structural level, as this price zone can often halt the downward move and trigger a potential reversal or bounce.
Monitor Market News and Sentiment
Another key strategy is to stay on top of market news and sentiment shifts. Sudden rate changes, inflation data, earnings shocks, or geopolitical headlines can quickly flip market direction — often triggering a long squeeze.
At Alchemy Markets, clients can access Trading Central’s professional-grade tools directly from the user dashboard — including an Economic Calendar and Market Buzz sentiment indicator.
While external tools like the Fear and Greed Index or Google Trends aren’t part of our platform, they’re still useful for spotting shifts in crowd behaviour.

For instance, in the example above, global tariff news made headlines through Google Top Stories — a clear bearish catalyst. Yet the Fear and Greed Index showed extreme greed, signalling that retail investors were still overly optimistic. When sentiment stays bullish despite worsening fundamentals, the market becomes more vulnerable to a long squeeze.
This divergence is a red flag. Retail traders may continue buying while price shows signs of exhaustion or bearish RSI divergence — creating the perfect storm for a sharp sell-off. Monitoring both sentiment and macro drivers helps you catch these disconnects early, and react accordingly.
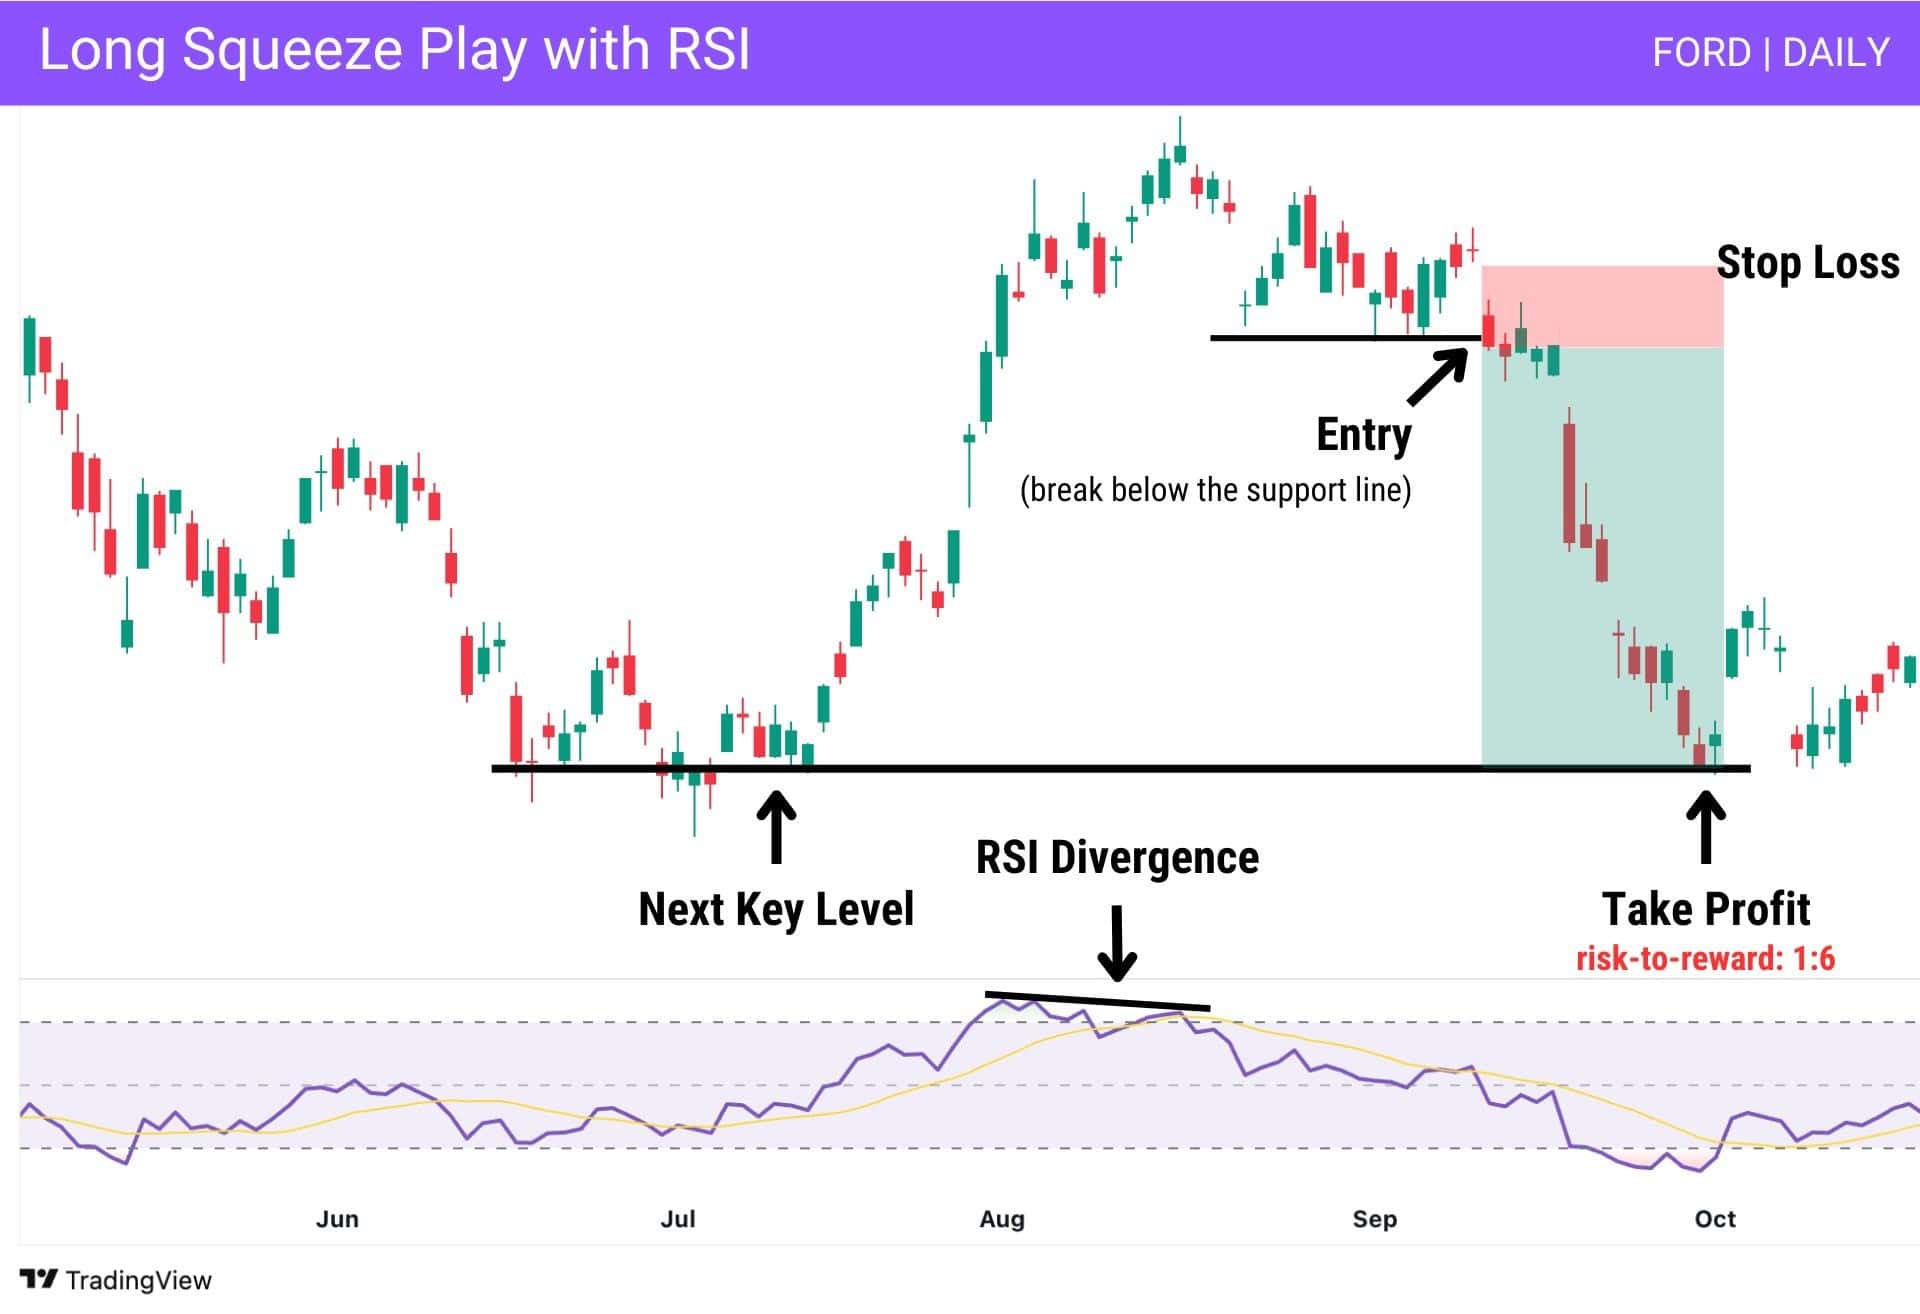
In addition to monitoring sentiment, it’s also important to back up your idea with technical confirmation. One of the best tools for this is the Relative Strength Index (RSI) — especially when used to spot bearish divergence.
Bearish RSI divergence occurs when price pushes sideways or slightly higher, but momentum weakens in the background. This often happens when retail investors are still bullish, blindly buying into the top— even as the market is running out of steam. That kind of overconfidence, paired with fading momentum, sets the stage for a potential long squeeze.
In the chart above, we can see price stalling at the top with a clear support level forming. RSI prints a bearish divergence, suggesting momentum is no longer supporting the move up. Then, news breaks — in this case, a bearish inflation announcement in September 2022 — and price breaks support with a sharp gap down.
This setup shows both sides of the squeeze:
- Fundamentals: Negative inflation data triggers fear.
- Sentiment: Retail remains long and optimistic despite warning signs.
- Technical: RSI divergence plus a clean support break.
All together, these factors build a strong short case.
Long Squeeze vs Short Squeeze
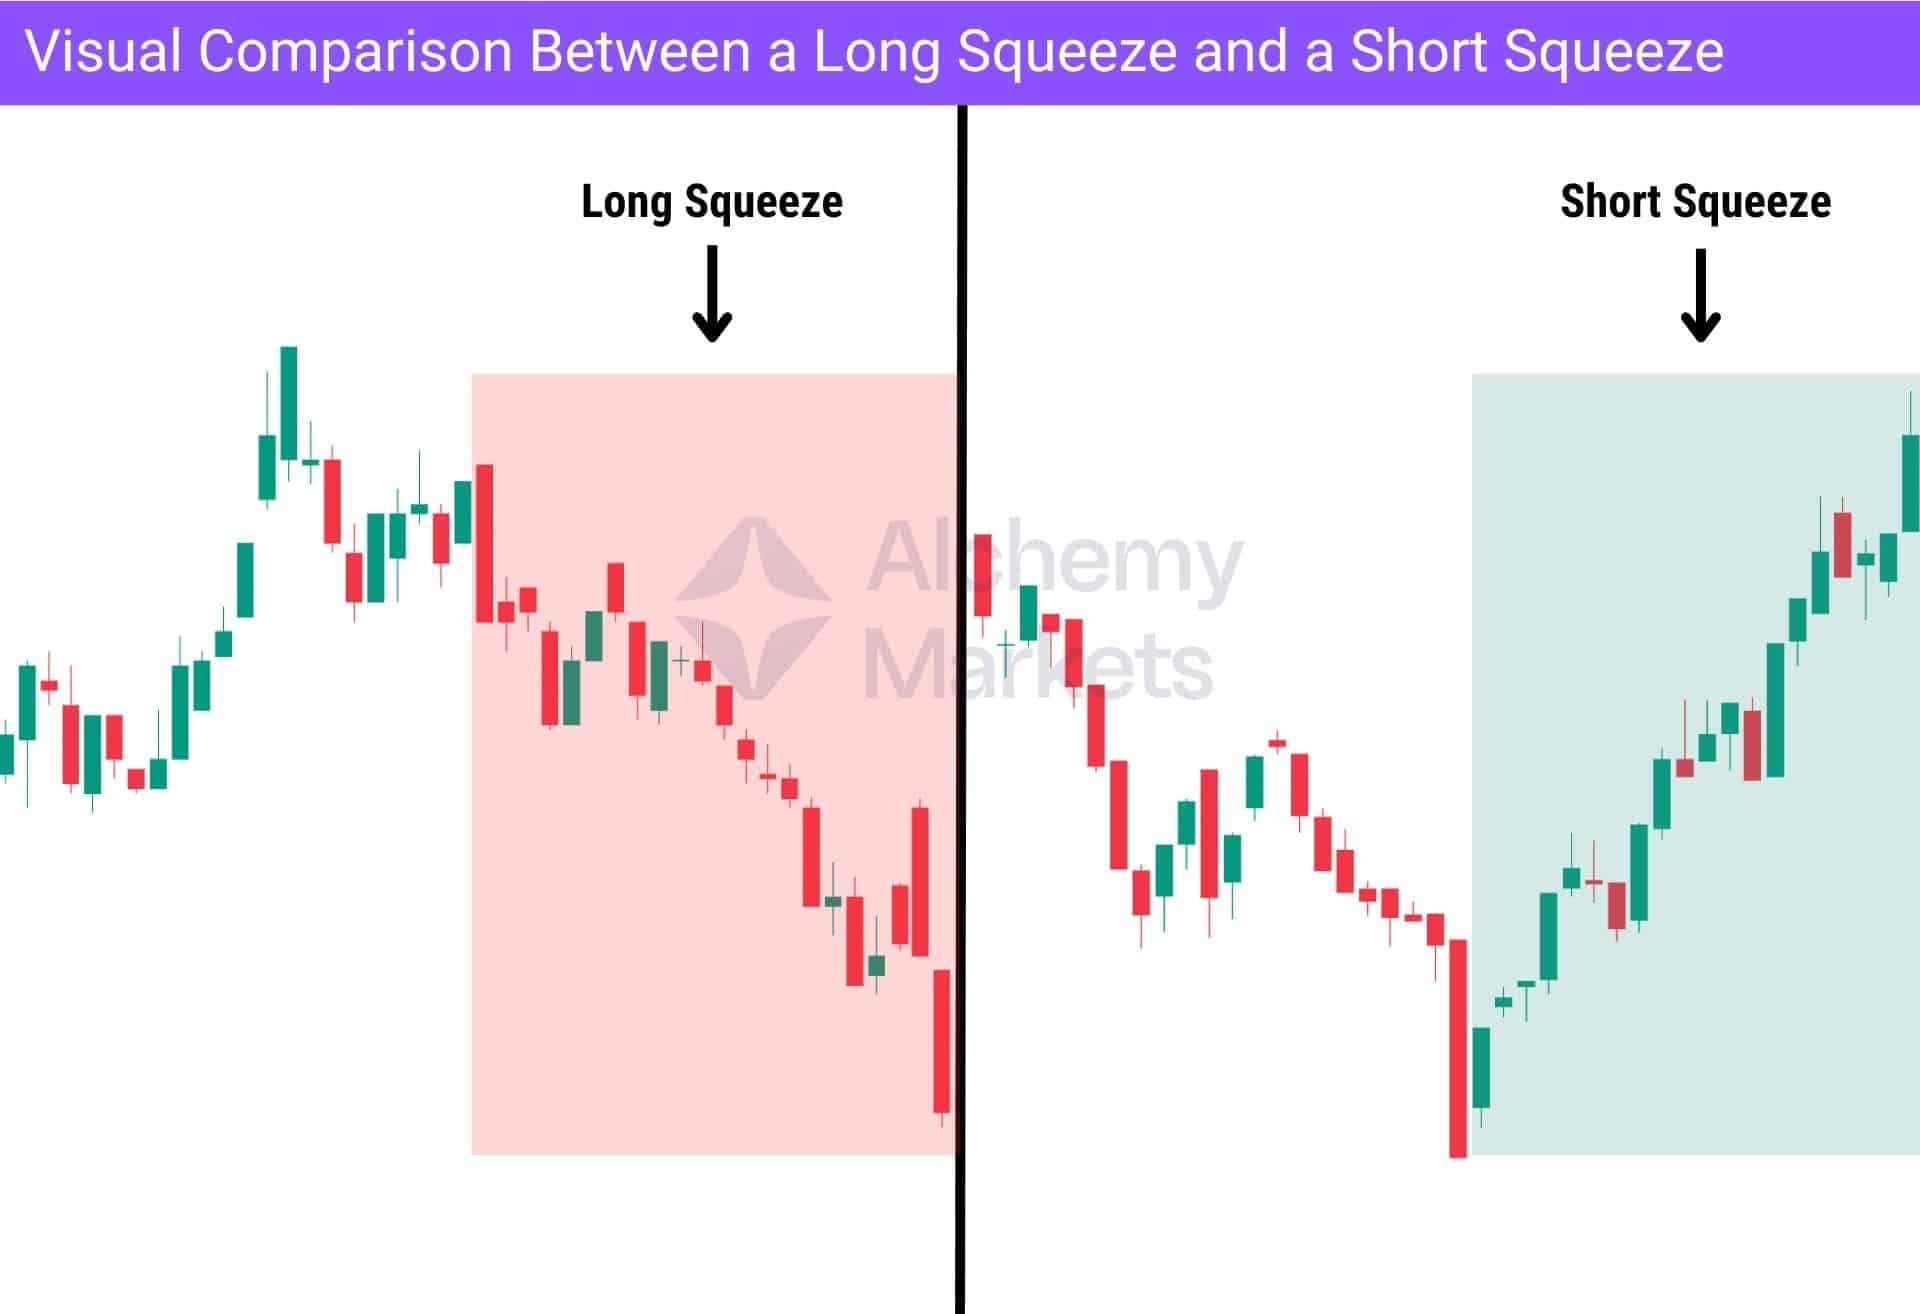
As covered earlier, a long squeeze happens during a strong uptrend, when traders are overly bullish and heavily positioned long. Then, price suddenly drops. This triggers stop-losses, panic selling, and a cascading exit of long positions. This creates a feedback loop of further decline — where selling fuels more selling.
A short squeeze is quite the opposite. It’s more well-known thanks to events like the 2021 GameStop squeeze, where retail traders piled into long positions on a heavily shorted stock (indicated by high short interest). As the price climbed, so did short sellers covering — they were forced to buy back shares to avoid losing even more margin, driving prices even higher.
It’s also worth noting that short interest plays an important role in both scenarios. When short interest is high, it can actually soften a long squeeze — since short sellers may take profits and buy into the drop. But when short interest is low, there’s less buying on the way down, leaving long positions even more exposed.
The image above illustrates this well: a long squeeze typically ends an uptrend, while a short squeeze kicks off a reversal at the end of a downtrend.
Gamma Squeeze vs Long Squeeze
A gamma squeeze occurs when market makers are forced to buy large amounts of an asset due to rising demand for call options. As traders buy calls, market makers hedge by buying the underlying asset — and as the asset’s price rises, they need to buy even more to stay delta-neutral. This feedback loop can push prices up rapidly.
While gamma squeezes are typically associated with bullish price spikes, they can also interact with long squeezes in more complex ways. For instance, if a market has seen aggressive call buying followed by a sudden shift in sentiment, the unwind of those hedges can amplify downside pressure — effectively intensifying a long squeeze.
These dynamics are far more common in equities and options-heavy markets, where retail participation in weekly calls and low-float stocks can create extreme positioning and volatility.
Frequently Asked Questions (FAQs)
Here are some of the most frequently asked questions about the long squeeze event:
Can a Long Squeeze lead to market volatility?
Yes, a long squeeze can, and often does, lead to increased or heightened market volatility. This is due to a panic-driven sell-off that often leads to significant (or large) price swings. Also, the forced liquidation of such long positions magnifies price instability, often triggering wilder market reactions.
How long does a Long Squeeze last?
Usually just a few sessions. Intense selling drives a quick drop before stabilisation or reversal.
What Triggers a Long Squeeze?
A long squeeze is triggered, more often than not, by an unexpected drop in price during a supposedly bullish trend. Alternatively, it’s triggered when a retracement entices many long positions, creating ample conditions to liquidate long trades.
What is the best Long Squeeze settings?
When many traders are long after a rally and price stalls near resistance with high volume. This creates ideal conditions for a squeeze.
How reliable is Long Squeeze?
It’s useful as a short-term signal but timing is crucial. Quick rebounds can easily trap late entries because they can look deceptively like bullish traders are succesfully fighting back. Always remember that no trade setup is 100% reliable – including long squeezes.
Is Long Squeeze a Leading or Lagging Indicator?
Lagging. It only becomes obvious after panic selling starts, confirming sentiment rather than predicting it.
What Common Mistakes Should Traders Avoid When Using the Long Squeeze?
Traders should avoid ignoring position sizing or skipping stop-losses, especially in assets with limited float. Another common mistake is holding losers too long, hoping to recover losses instead of cutting early. Chasing a squeeze after most of the move has played out also increases risk while shrinking potential gains. These errors turn a high-reward setup into an unfavourable risk–reward trade.
What is a Market Squeeze and How to Start Trading It?
It’s a broad term for forced exits from sudden moves. Long squeezes force selling; short squeezes force buying.
What are the different types of squeezes?
There are several types of squeezes traders should be aware of:
| Long Squeeze | Happens when long traders are forced to sell rapidly due to falling prices. |
| Short Squeeze | Occurs when short sellers scramble to cover positions during a rapid price rise. |
| Gamma Squeeze | Driven by options market makers hedging their exposure, which can push prices rapidly in either direction. |
| Credit Squeeze | When liquidity tightens and access to borrowing or margin dries up, worsening forced selling. |
| Liquidity Squeeze | Related to market depth, where small orders move the market more than usual due to low liquidity. |


