


Written by:

Reviewed by:

Bullish
- March 18, 2025
- 24 min read
Golden Cross Explained with Ease
What is a Golden Cross?
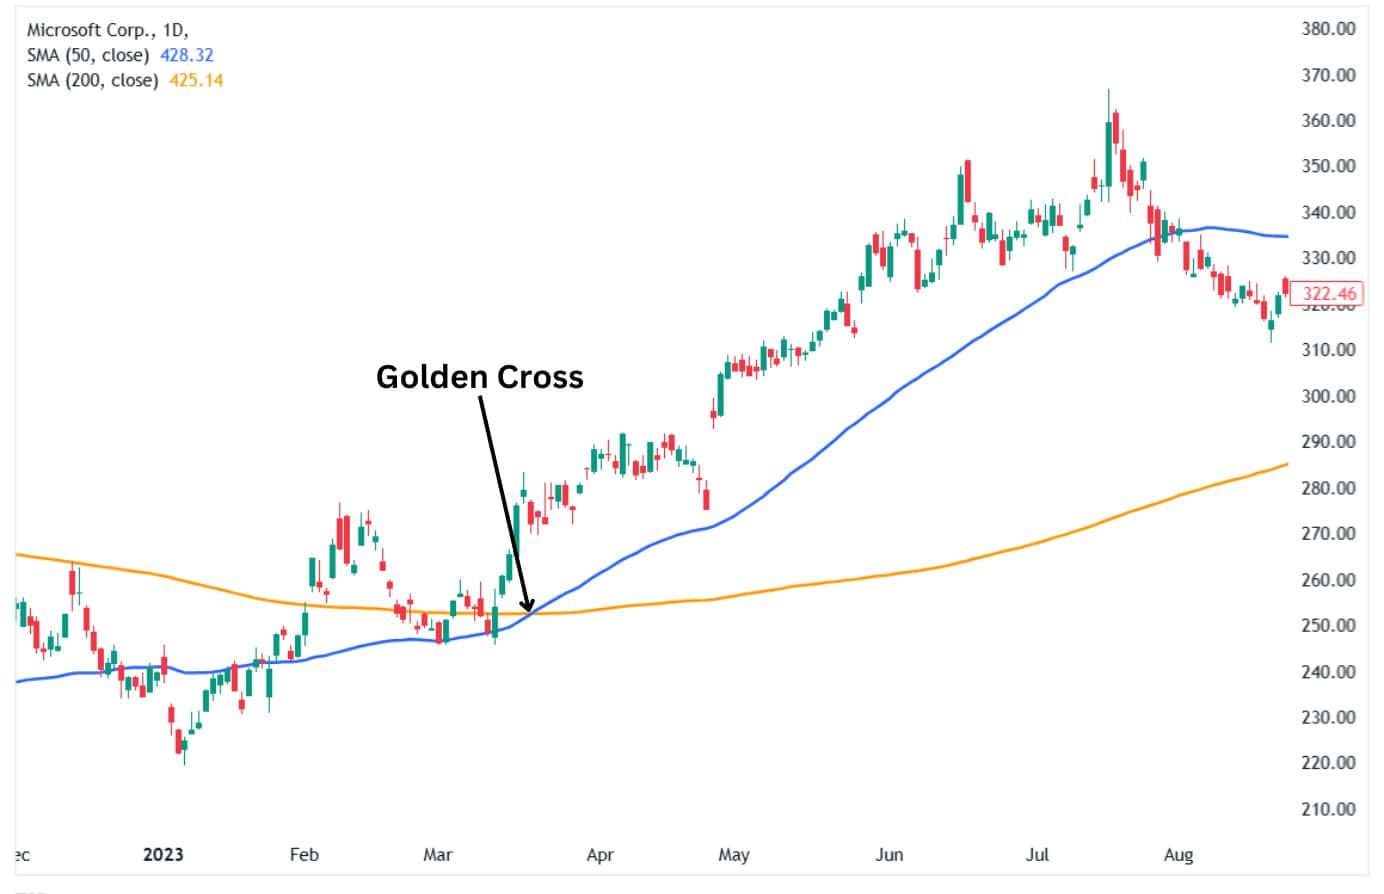
A golden cross is a technical chart pattern where a fast moving average crosses above a slow moving average and signals a bullish phase. The golden cross chart pattern helps traders identify when a market is in a bullish phase. However, due to its lagging nature, it is not a good signal of when to enter bullish trades. Investors use other methods to determine when to capitalise on bullish market trade opportunities and execute bullish trades apart from the golden cross.
How Does a Golden Cross Form?
The golden cross chart pattern forms when a short-term moving average crosses above a long-term moving average, signalling a bullish trend’s continuation. The most commonly used representation of the golden cross chart is when a 50-day moving average crosses over the 200-day moving average.
The golden cross forms after a bearish market trend where the shorter moving average was below the longer MA. Then, as the asset’s price begins to rally, the short-term moving average starts rising as well.
Given enough time in a strong enough rally, the short-term moving average eventually crosses above the longer moving average, signalling that the bearish momentum has ended and buyers have taken control of the price. The bullish trend is confirmed as the two moving averages remain aligned, with the short MA above the longer moving average.
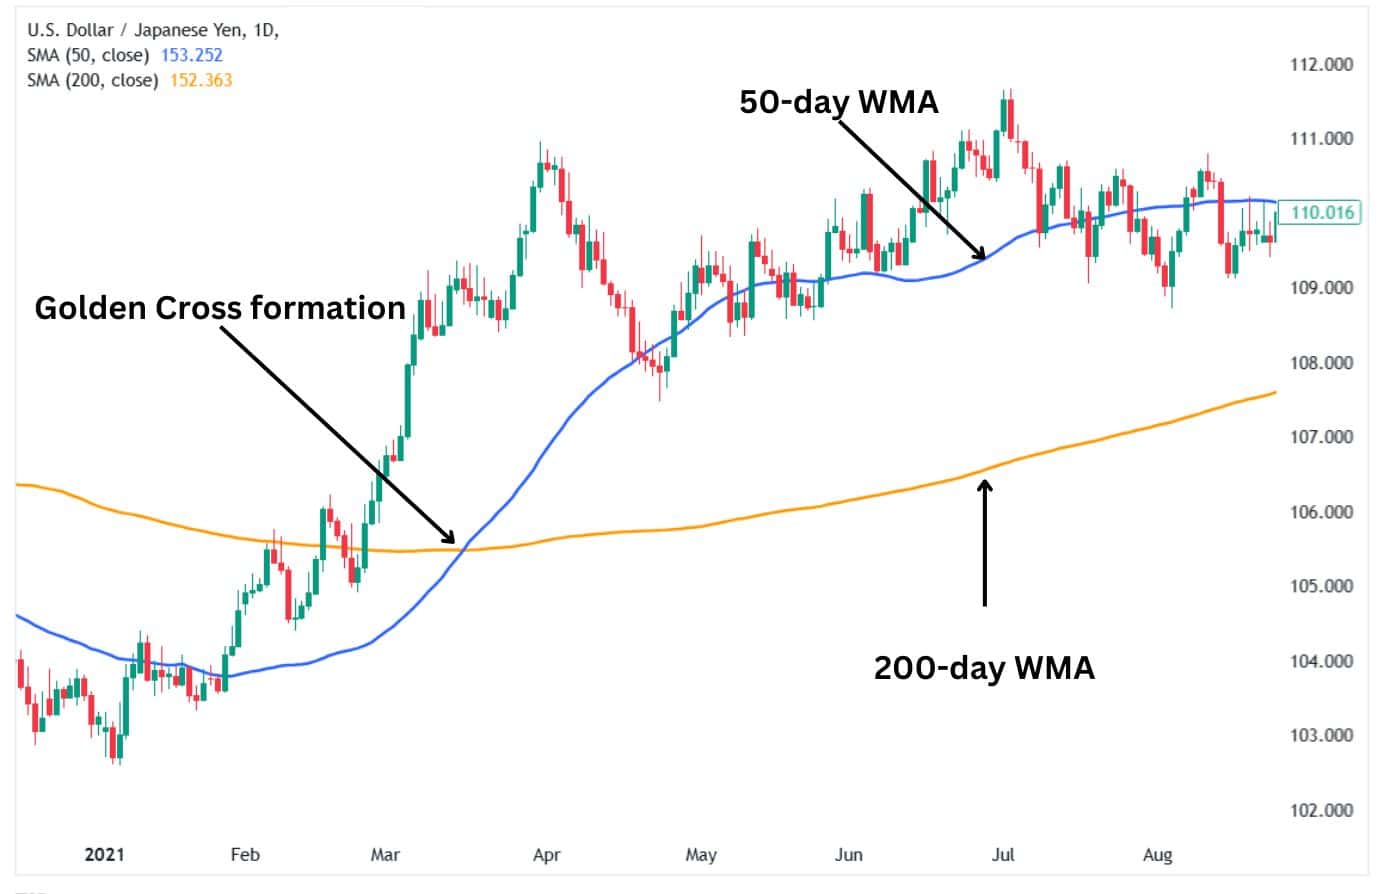
Alt text: The golden cross formation on the USDJPY daily chart.
The Three Stages of a Golden Cross
The golden cross is a unique chart pattern showing that an asset is now in a bullish phase. In reality, the pattern usually unfolds in three crucial stages.
Downtrend stage: The first stage represents a downward trend that loses momentum and bottoms out. The price might move sideways at this stage as buyers and sellers fight to take over the price. At this stage, the longer moving average will start showing a lesser downward slope as it moves sideways.

Alt text: The golden cross downtrend stage.
Crossover stage: The second stage occurs when the shorter-term moving average crosses above the long-term moving average, indicating that the prices are rising and a bullish phase could be underway. This is the most crucial stage of the golden cross, as it signals that a new trend has begun.
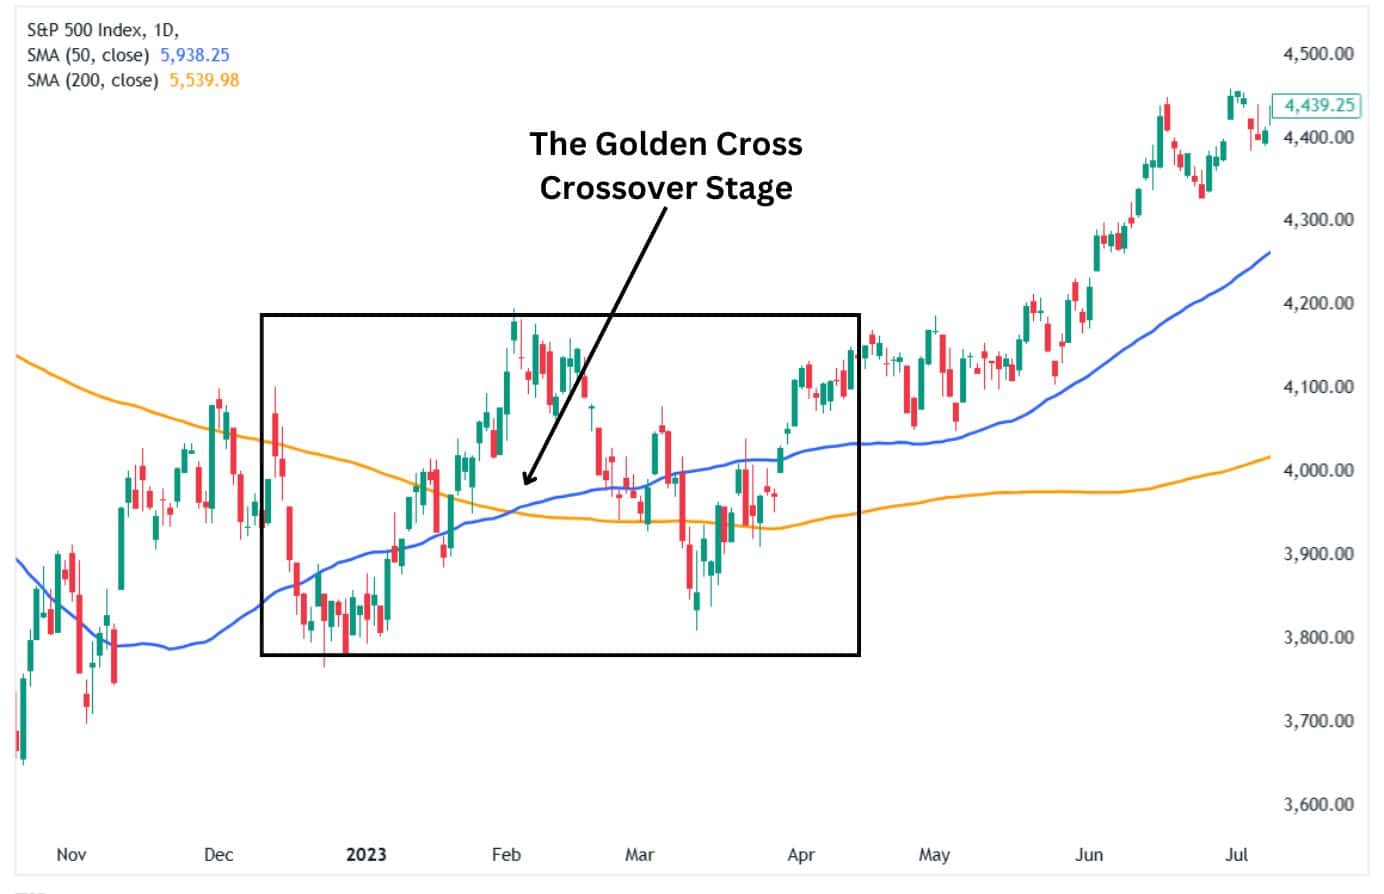
Alt text: The golden cross crossover stage.
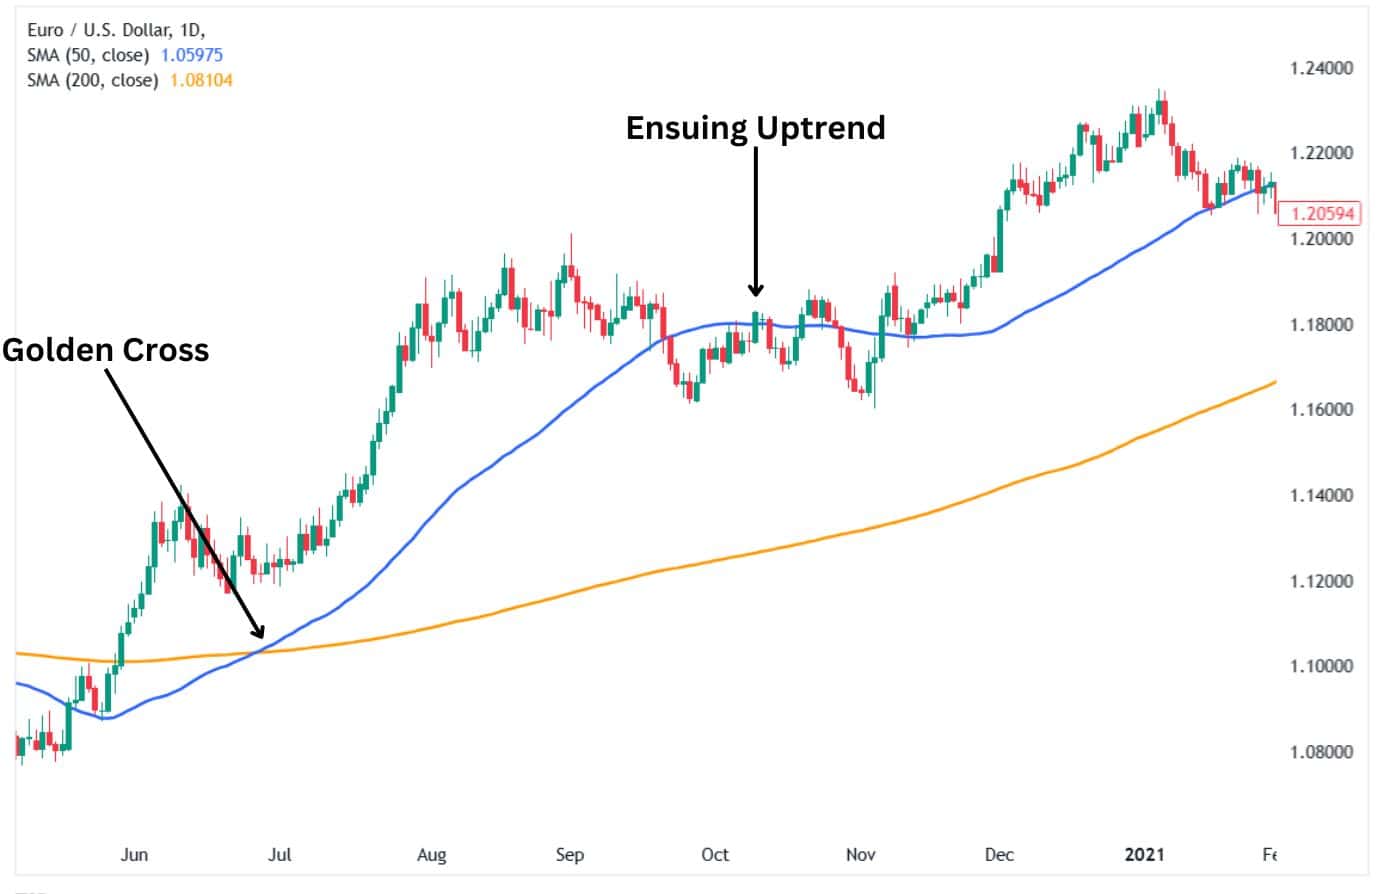
Uptrend stage: The third stage continues the uptrend that began with the crossover of the short-term moving average above the long-term MA. At this stage, the short-term moving average remains above the long-term MA, confirming and supporting the new uptrend. In scenarios where the uptrend is strong, the separation between the fast MA and the slow MA widens, indicating that the uptrend is gathering momentum.
The progression through the three stages helps traders identify the correct entry points in a rising market.
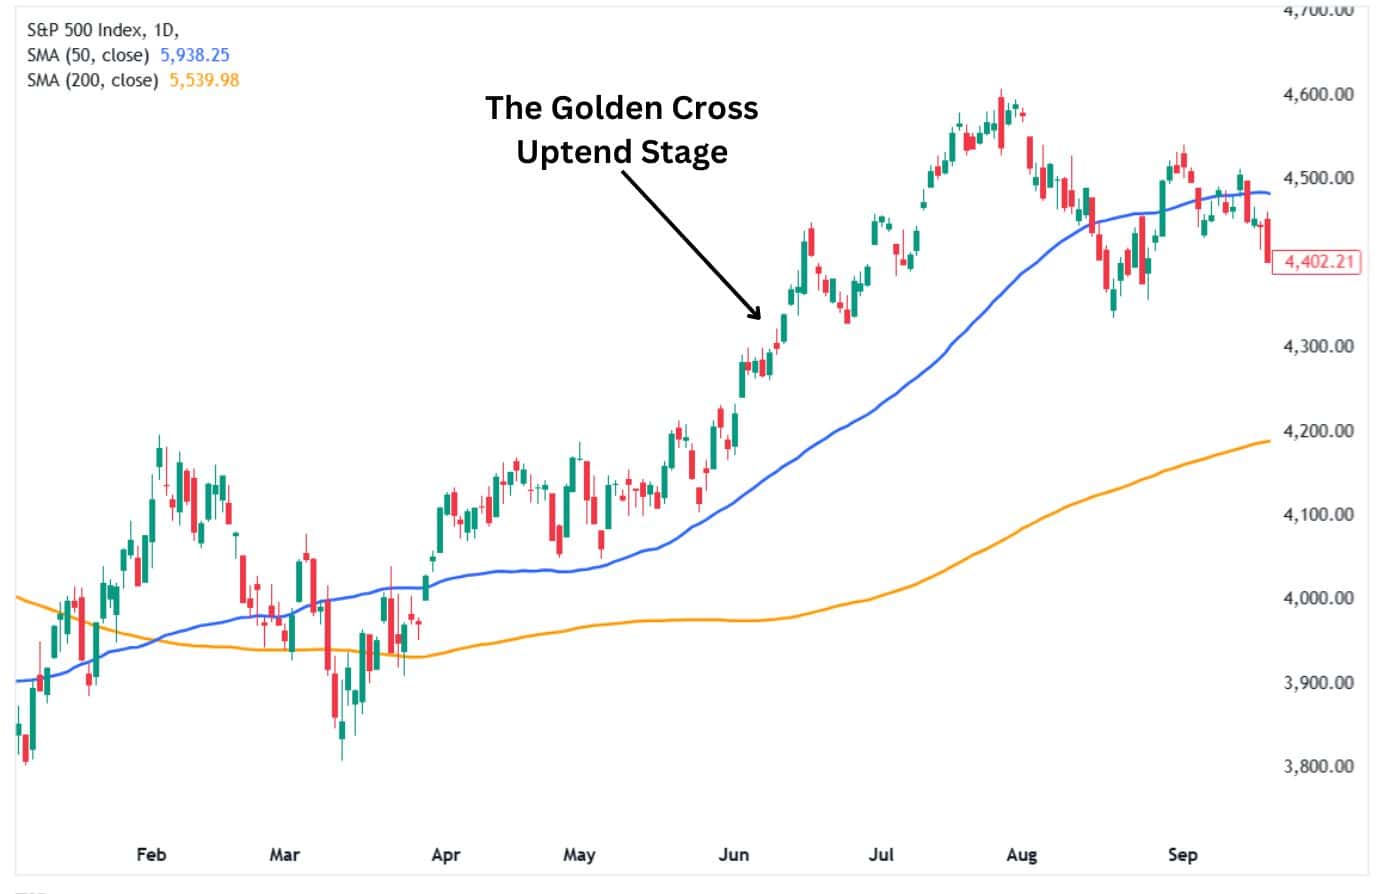
Alt text: The golden cross uptrend stage.
What Can a Golden Cross Identify?
A golden cross alerts you to a potentially developing long-term bullish trend. The most popular MAs used in a golden cross chart are the 50-period (day) SMA as the short-term moving average and the 200-period (day) SMA as the long-term moving average. The golden cross chart can identify a bullish trend phase and can be used as a trend filter to help pinpoint bullish signals.
Within the stock market, the first sector or industry making a golden cross may signal relative strength compared to the rest of the market. This signal would be key and alert traders of a sector to consider finding high quality stocks.
The golden cross is also used on stock market indices to identify bullish phases, as outlined in the DAX Index chart below.
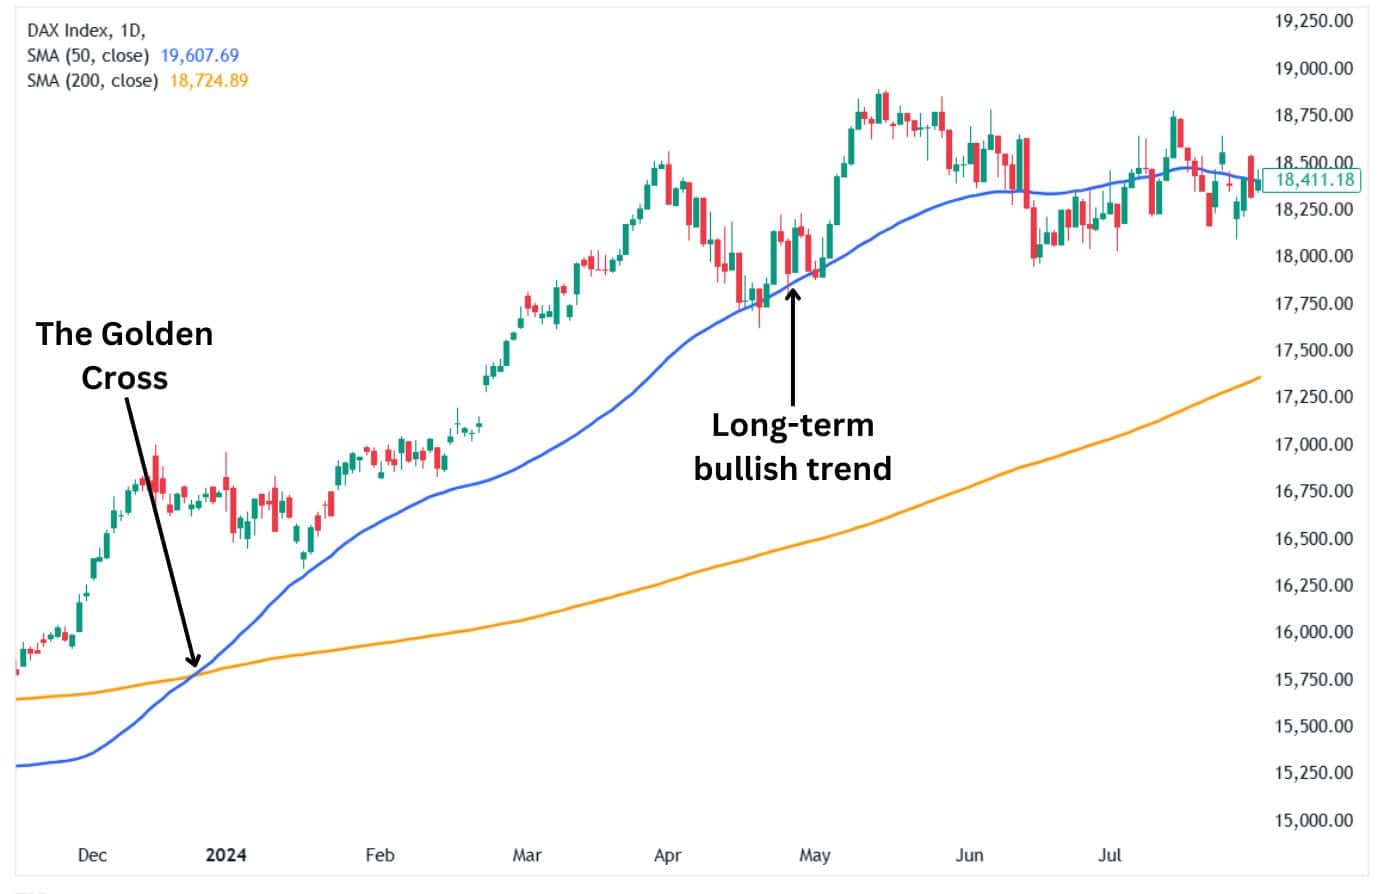
Alt text: The golden cross identifies a long-term bullish trend.
The golden cross chart can also identify the end of a downtrend as marked by the crossover of the shorter MA over the longer MA.
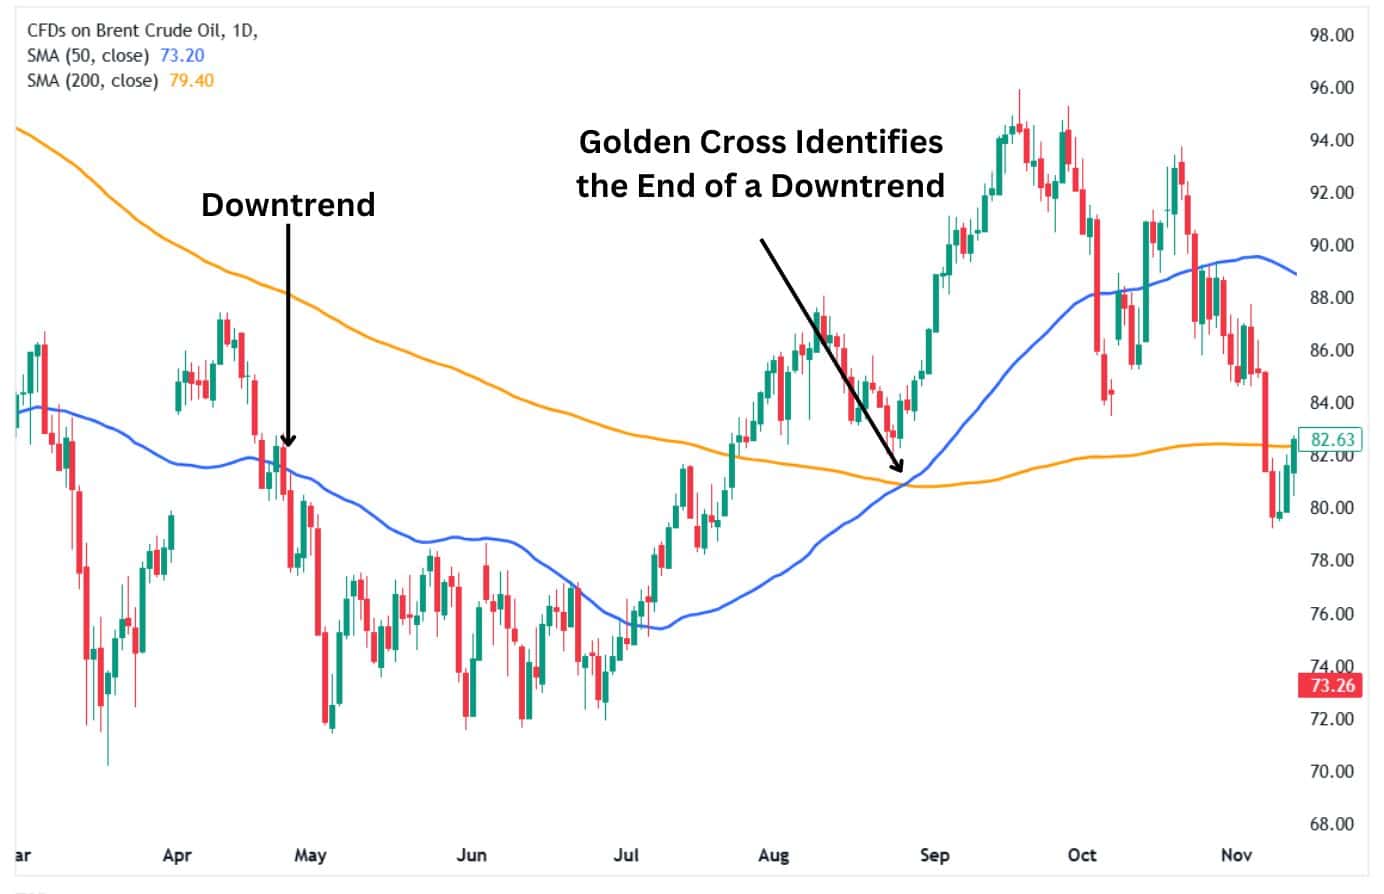
Alt text: The golden cross identifies the end of a downtrend.
How Do You Calculate a Golden Cross?
To calculate the golden cross chart pattern, you must individually calculate the two moving averages that create the chart pattern.
First, calculate the fast simple moving average. In this case, we’ll use the 50-period moving average as the fast-moving average.
Second, calculate the slow-moving average. Since the most common golden crosses use the 200-period simple moving average, we’ll figure that one too.
After you have calculated and plotted the two moving averages on a price chart, you can identify the golden cross. However, these calculations are always automated by most charting platforms used by traders.
Short-Term Moving Average (SMA): Calculate the moving average for a shorter period, such as 50 days:
Short-term SMA = Sum of closing prices over 50 days / 50
Long-Term Moving Average (SMA): Calculate the moving average for a longer period, such as 200 days:
Long-term SMA = Sum of closing prices over 200 days / 200
Golden Cross Trigger: When the short-term SMA crosses above the long-term SMA:
Short-term SMA [1 period ago] < Long-term SMA [1 period ago]
AND
Current Short-term SMA > Current Long-term SMA
Key Characteristics of the Golden Cross
Here are some of the defining characteristics of the golden cross chart pattern.
Crossover: The short-term moving average crosses above the long-term moving average. The crossover commonly includes the 50 and 200-period SMAs.
Timeframe: The golden cross can be used on any chart timeframe, but it’s commonly followed using the daily and weekly charts.
Bullish Sentiment: Indicates a potential long-term uptrend phase, attracting buyers and building market confidence.
Importance of the Golden Cross
The golden cross chart helps traders identify when a bearish trend might be reversing, signalling an opportunity to enter a bullish trade. Its reliability increases when confirmed by other indicators, such as higher trading volume.
When to Trade the Golden Cross
Traders typically look to bullish signals once the golden cross is confirmed. The golden cross is confirmed after the short-term moving average has crossed above the long-term average.
Traders often wait for additional confirmation, like higher trading volume or a strong price breakout, for better accuracy. The better trades tend to occur when the trader aligns their signals with the overall market trends. The golden cross alerts the trader when the market is entering a bullish phase.
Alt text: Conditions that dictate when to trade the golden cross.
How to Use the Golden Cross
The golden cross chart is a bullish trading signal that shows when the market might be moving higher. While it is not the most reliable short-term bullish trade entry indicator, it does identify long-term trends in the market.
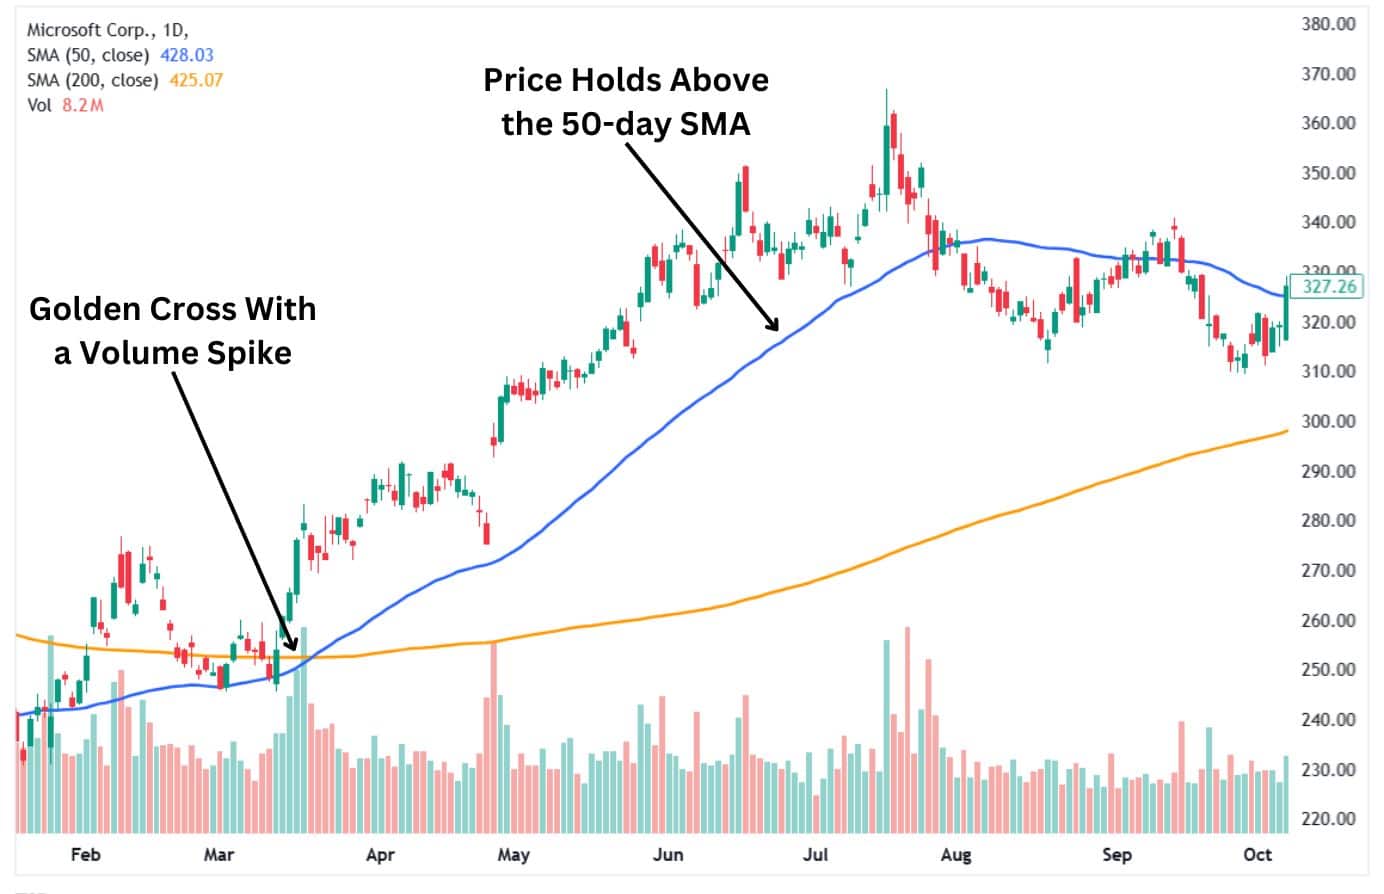
The golden cross chart pattern occurs when the 50-day MA crosses above the 200-day MA, indicating the beginning of a long-term bullish trend. The golden cross confirms a bullish phase within the market. This is especially true if the crossover is accompanied by increased volume on up days and decreasing volume on down days.
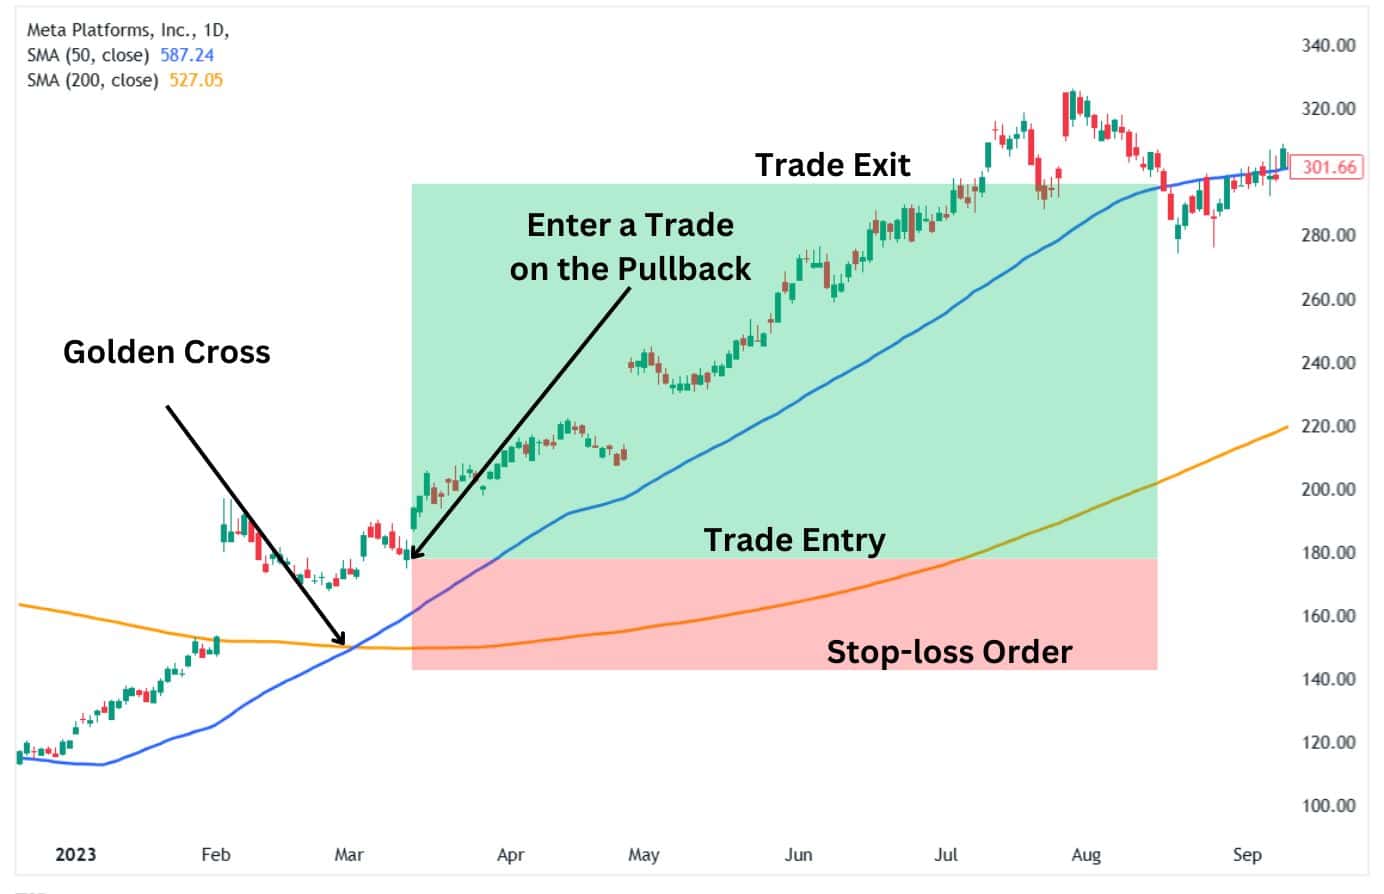
The golden cross can also be used to enter a trade, primarily if it occurs after a pullback, which leads to the ideal trade entry. The golden cross can also help set a stop-loss order below the recent lows to protect your trades.
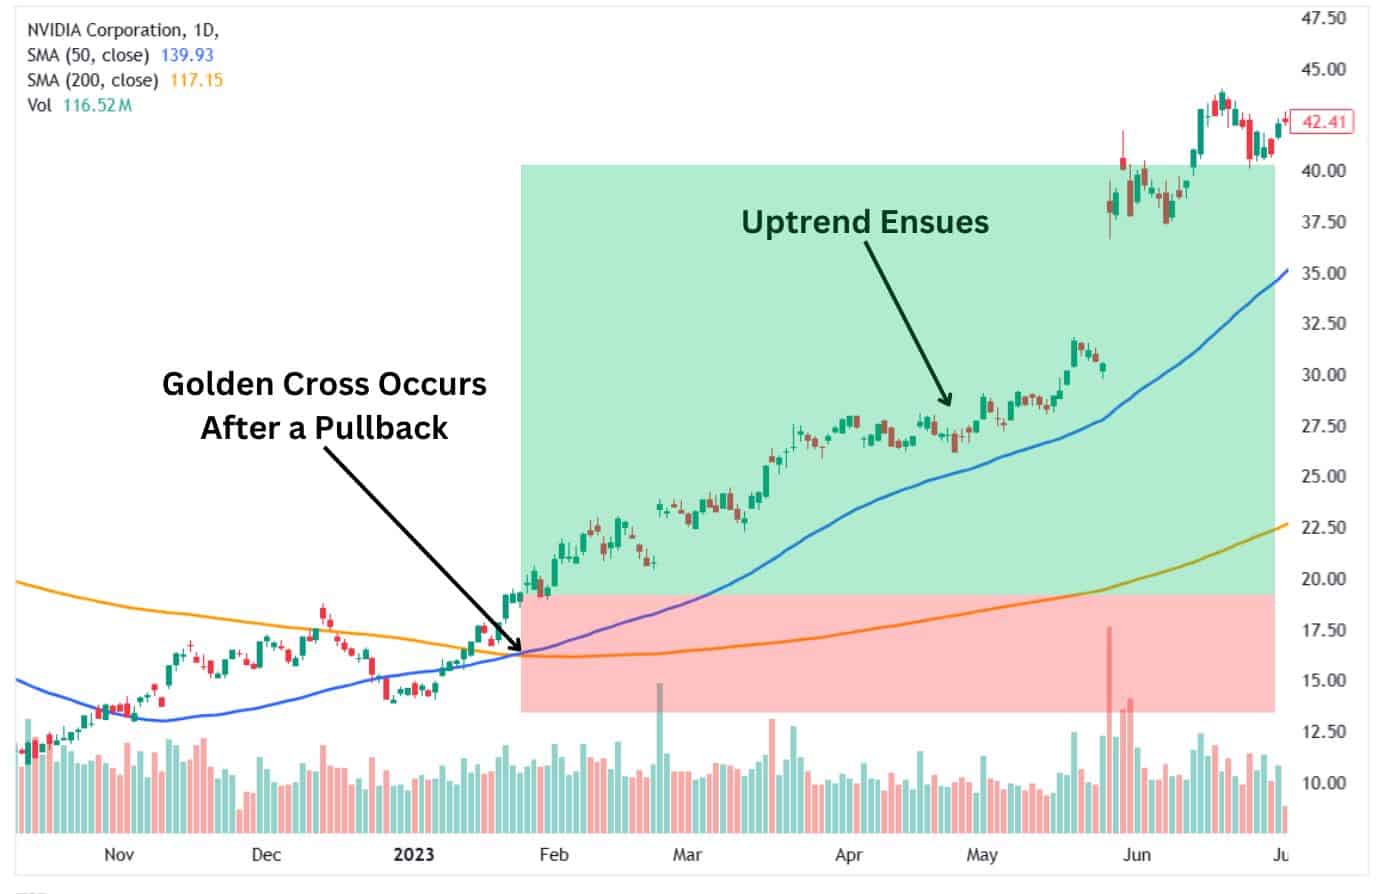
Alt text: golden cross trade setup after a pullback.
Use the golden cross alongside other indicators like the RSI and the MACD. When combined with RSI, traders can look for instances where the crossover occurs, accompanied by the RSI being out of oversold territory, above 50, and heading higher.
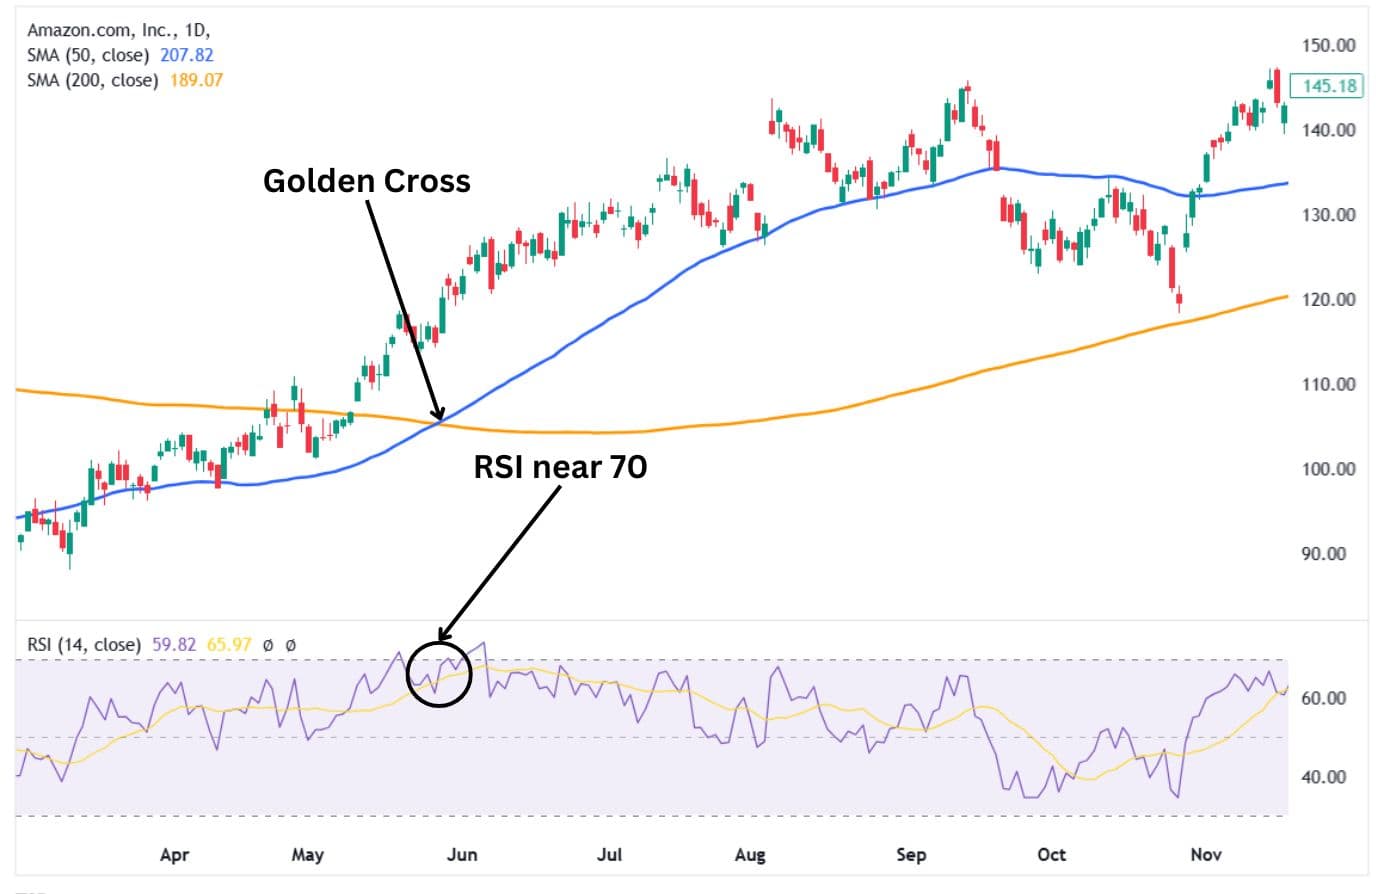
Alt text: The golden cross occurs with the RSI near 70.
As for the MACD, the golden cross can be confirmed by the MACD line crossing above the signal line. This usually signals the beginning of an uptrend, which could confirm the golden cross trading signal.
The Significance of Moving Averages in the Golden Cross Trading
Moving averages are the backbone of the golden cross chart pattern. The short-term moving average tracks recent price trends, while the long-term moving average reflects broader market direction. When the short-term crosses above the long-term:
- It signals that bullish momentum is overtaking bearish pressure.
- It serves as a reliable indicator of a potential bullish phase.
- Combining moving averages smooths out price fluctuations, making trends more apparent.
These averages help traders filter out noise and focus on the market’s real direction, providing a clearer view of when to open or exit trades.
Golden Cross Example
Imagine a stock whose 50-day moving average has been below its 200-day moving average during a downtrend. Over time, the stock stabilises and starts rising steadily. The golden cross chart occurs when the 50-day moving average crosses above the 200-day moving average, signalling that the bulls are gaining control. Traders often interpret this as a sign of a sustained uptrend and look for buying opportunities.
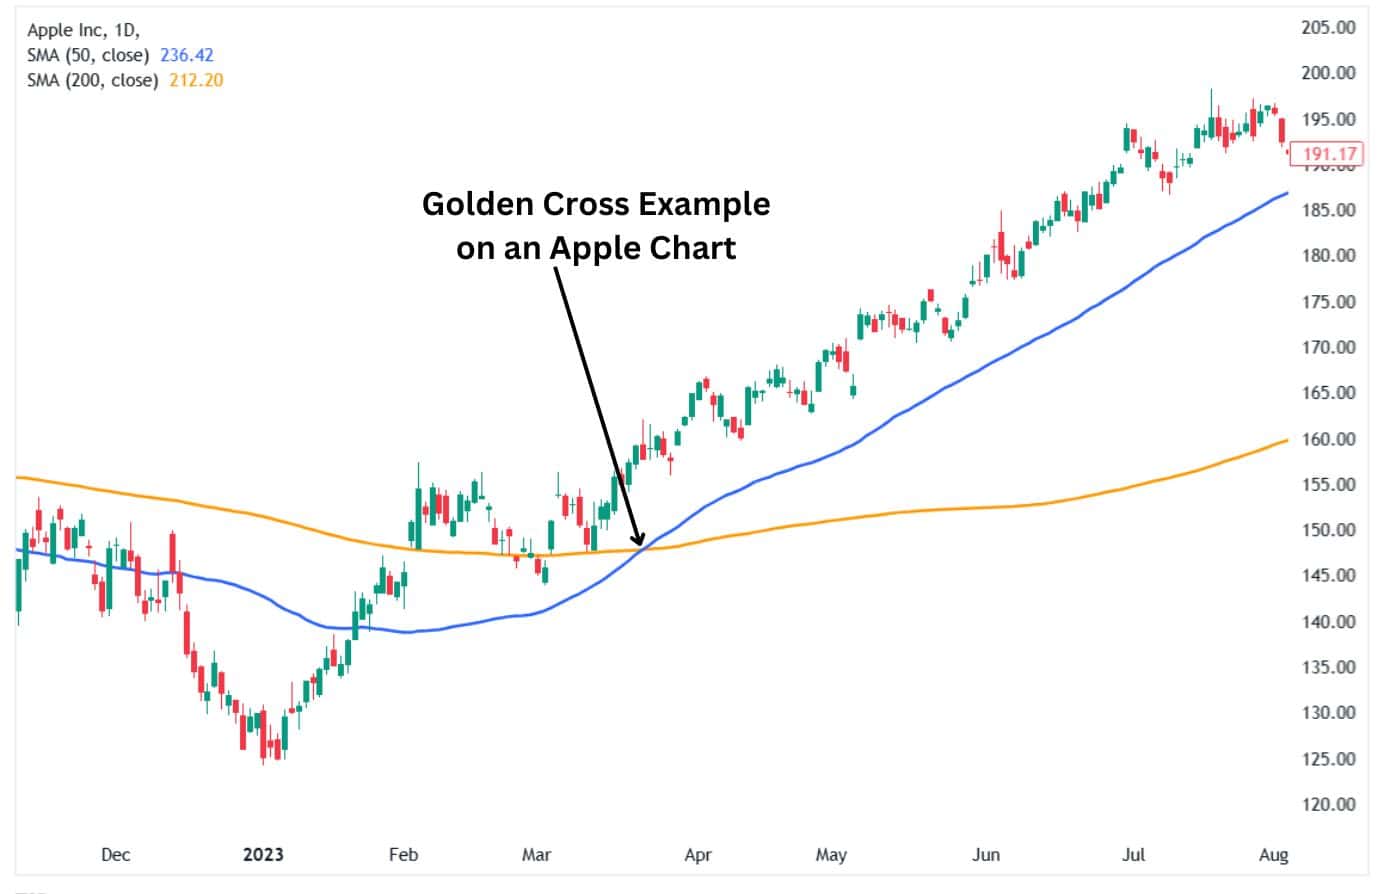

Alt text: golden cross example on an Apple Inc. daily chart.
Golden Cross Trading Strategies
Breakout Confirmation
After spotting a golden cross chart pattern, watch for the price to break above a significant resistance level. This provides an extra layer of confirmation that buyers are in control. Enter the trade on the breakout and use the previous support as your stop-loss level.
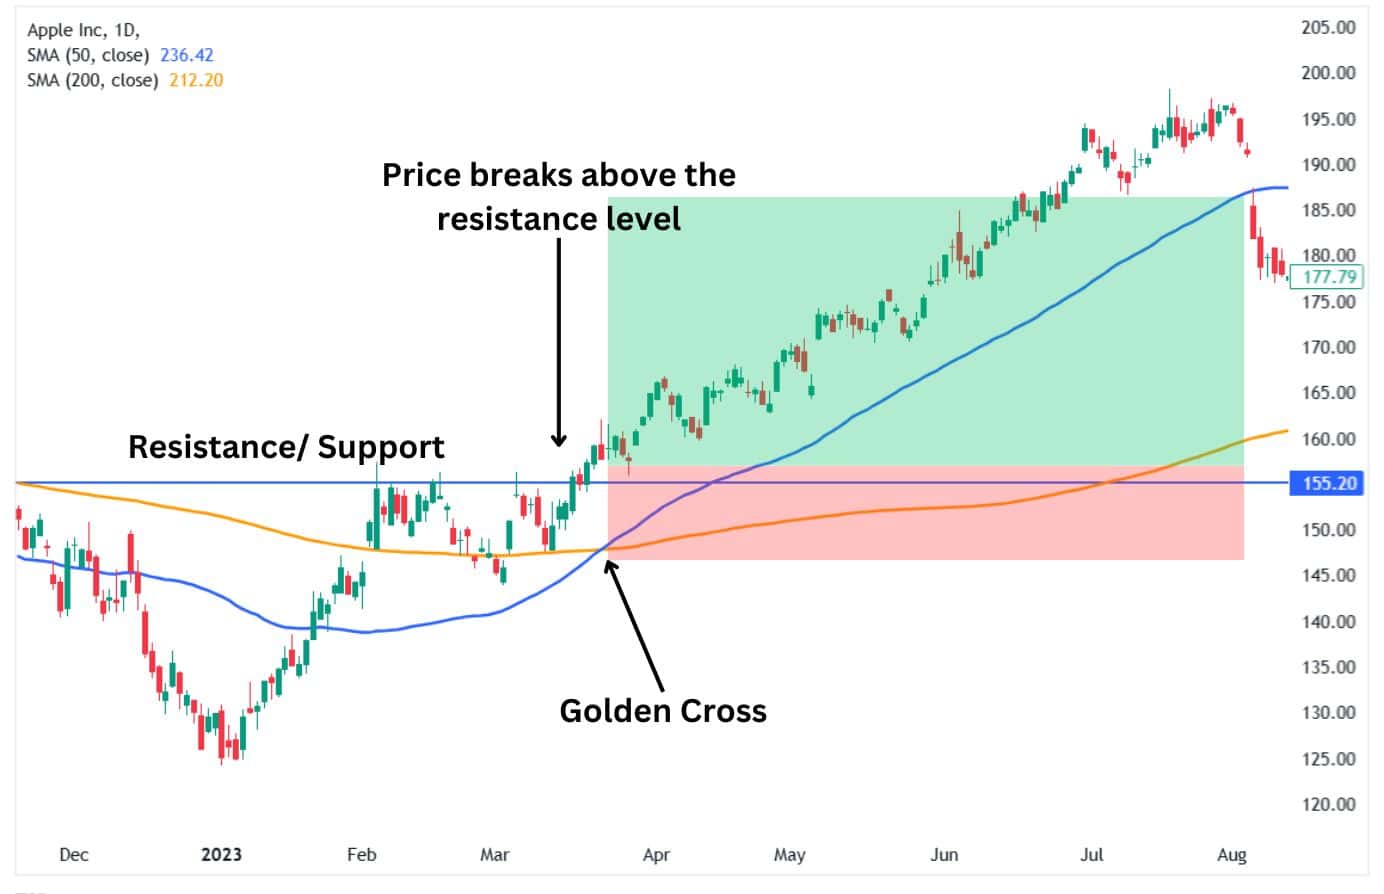
Alt text: Breakout confirmation of a golden cross pattern.
Trend Riding
Once the golden cross chart appears, a trader may enter long as the bullish phase is confirmed. At this point, the price is above the longer-term moving average. Traders may use the long-term moving average as the dynamic stop loss for the position. Once the price crosses below the long-term moving average, then the position is closed.
This strategy works well in robust trends. Use trailing stop-loss orders to lock in profits while allowing the trend to continue.
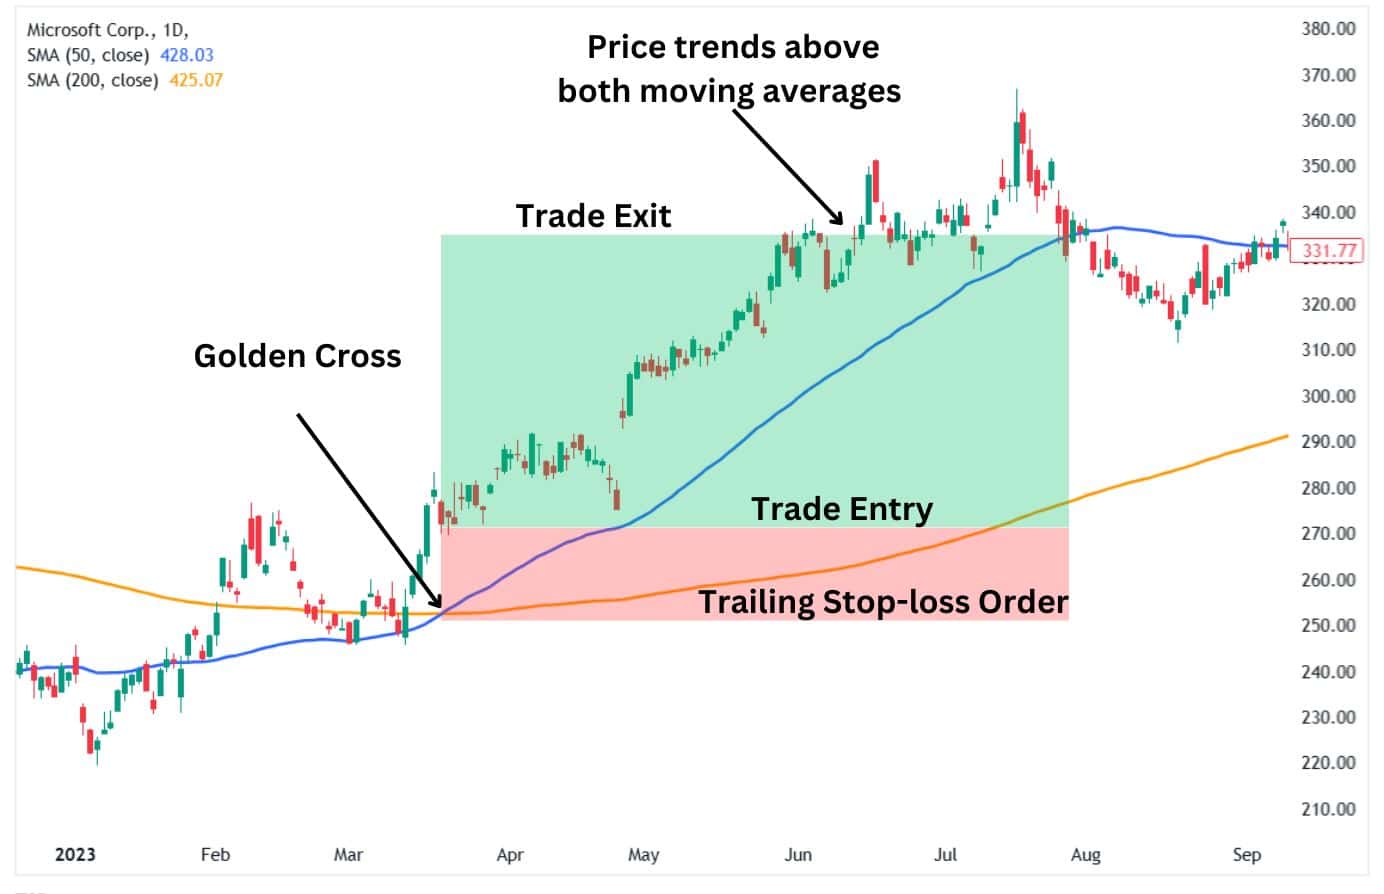
Alt text: Using the golden cross moving averages as trailing stop-loss orders.
Pullback Entry
Instead of entering immediately after the golden cross chart, wait for a pullback, where the price temporarily dips toward one of the moving averages. Enter on signs of a bounce from the support level as evidenced by a bullish candle pattern such as a bullish Marubozu. This lets you buy closer to support and minimises the risk of entering at the peak.
Alt text: Trade entry on a pullback to the moving average after a golden cross.
Mean reversion
The mean reversion concept assumes that prices tend to gravitate toward their average levels over time. This happens because markets often overreact to news or events, temporarily pushing prices too high or too low.
Application: Traders use indicators like Bollinger Bands®, Keltner Bands, VWAP, or Moving Averages to identify when prices deviate significantly from the mean. For instance, if a stock’s price is pushing the upper Bollinger Band, then the price may be stretched and prime for a pullback.
In these situations, a trader would wait for the price to fall back to the average, or revert to the mean. As the price falls to the 50-period moving average, traders would then look for a bullish candle pattern to signal a long position.
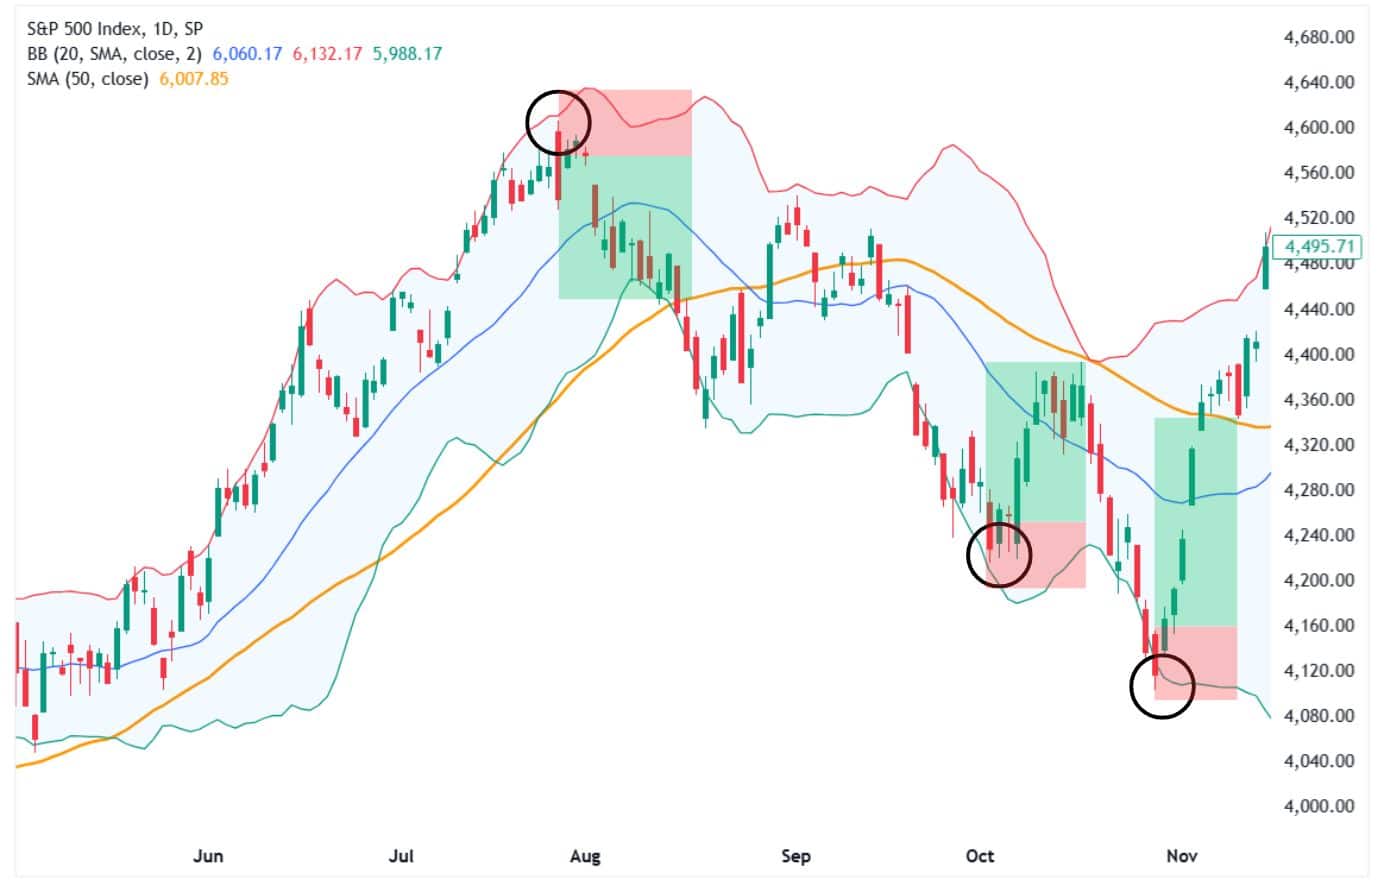
Alt text: Mean reversion trades to the 50-day moving average.
Mean reversion strategies work well in range-bound markets but are less effective during strong trends.
EMA Carry
EMA Carry uses Exponential Moving Averages (EMAs) to effectively capture price trends. Unlike simple moving averages, EMAs react faster to price changes, making them suitable for dynamic market conditions.
How it works:
- Traders use a combination of short-term (e.g., 50 EMA) and long-term (e.g., 200 EMA) EMAs.
- The short-term EMA must be above the long-term EMA.
- When the price moves above the shorter EMA, it signals the start of a trend, and the trader enters the trade.
- The position is held as long as the price stays above the longer EMA, allowing the trader to “carry” through the trend while avoiding minor fluctuations.
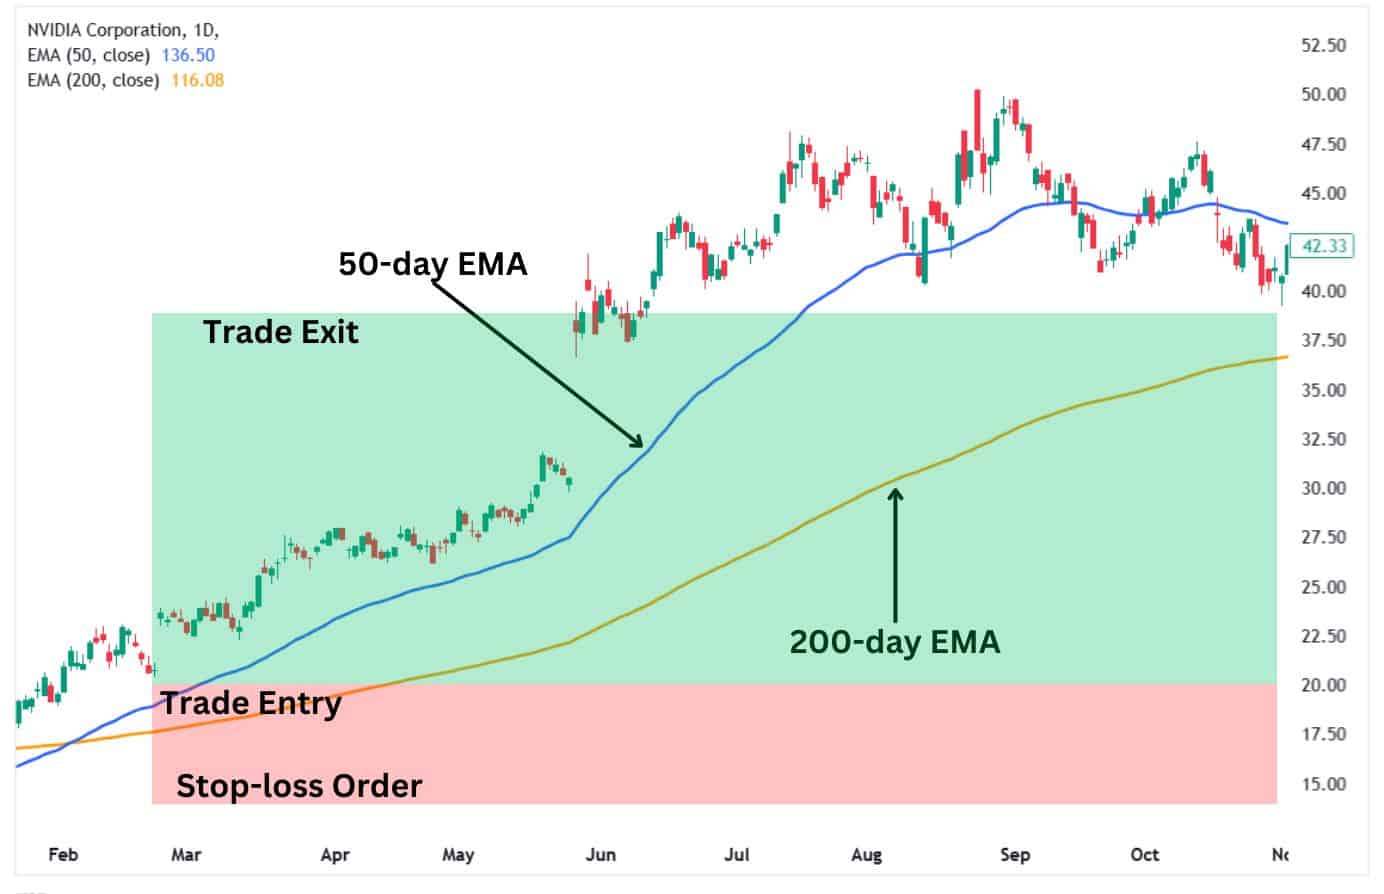
Alt text: EMA Carry trading strategy.
This approach helps traders stay in the market for significant price moves while avoiding premature exits.
Pullbacks on 50 EMA
Pullbacks to the 50 EMA are a classic strategy for entering trades during a trend. The 50 EMA acts as a dynamic support (in an uptrend) or resistance (in a downtrend), where prices often pause before resuming the trend.
How it works:
- Identify an uptrend where the price consistently stays above the 50 EMA.
- Wait for the price to dip (pullback) toward the 50 EMA.
- Look for confirmation that the price is bouncing back, such as a bullish candlestick pattern or a momentum indicator like RSI moving higher.
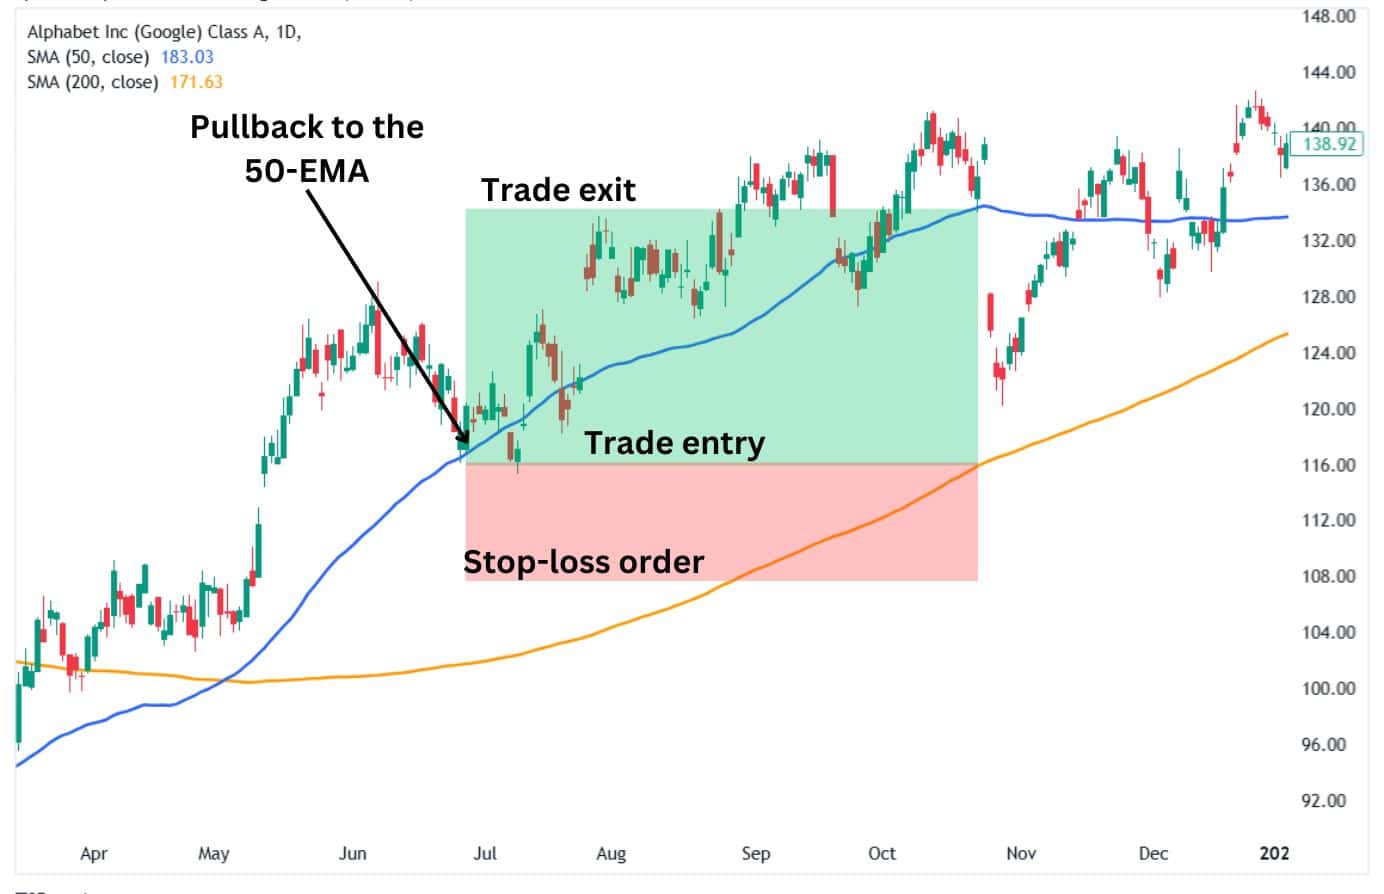
Alt text: Pullbacks to the 50-EMA.
Entering on pullbacks gives you a better entry price, reduces risk, and aligns your trade with the prevailing trend.
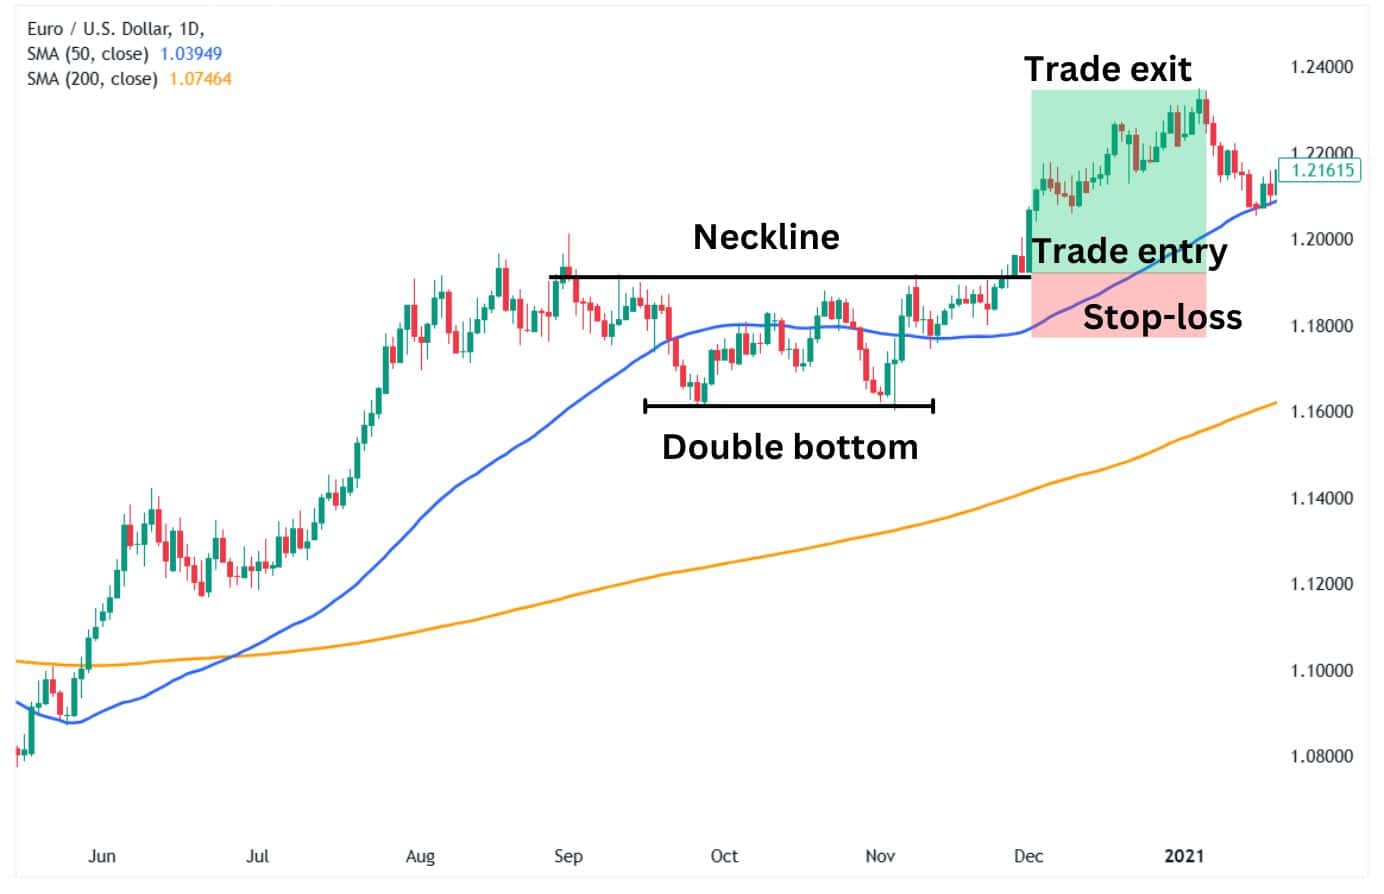
Double Bottom
The Golden Cross and Double Bottom are two widely recognized bullish technical patterns. When they occur together, they can reinforce a strong trend reversal and signal a high-probability buying opportunity.
Understanding the Combination
- Double Bottom Pattern: This formation occurs when price finds support at a similar level twice, forming a “W” shape. It indicates that selling pressure has weakened, and buyers are stepping in to push the price higher.
- Golden Cross Confirmation: A Golden Cross happens when the 50-day moving average (short-term) crosses above the 200-day moving average (long-term). This crossover signals a shift from a downtrend to an uptrend.
Why This Setup Matters
When a Double Bottom forms during a bullish phase confirmed by a Golden Cross, it provides a strong confluence of technical signals:
- Trend Reversal Foundation – The Double Bottom suggests that a previous downtrend is losing momentum.
- Momentum Confirmation – The Golden Cross validates the bullish shift by showing that short-term momentum has overtaken long-term bearish pressure.
- Stronger Breakout Potential – A breakout above the Double Bottom’s resistance (neckline) often aligns with the moving average crossover, attracting more buyers.
When the double bottom forms during a Golden cross, the pattern should be at least above the 200-period moving average. As for the trade setup, the price should be above both the 50-day and 200-day moving average confirming that the asset is in an uptrend.
Alt text: Double bottom candlestick pattern with the Golden cross.
Traders often enter the trade after the breakout above the middle peak and use the second low as a stop-loss level.
Triple Bottom
The combination of a Golden Cross and a Triple Bottom can be a reliable bullish reversal pattern. While a Double Bottom already indicates potential trend exhaustion, a Triple Bottom provides an even stronger confirmation that buyers are overpowering sellers. When a Golden Cross precedes or follows, it further solidifies the bullish bias.
How This Combination Works
- Triple Bottom Pattern: This occurs when price tests a support level three times without breaking lower. Each bounce off support suggests increased buying pressure.
- Golden Cross Confirmation: When the 50-day moving average is above the 200-day moving average during and after a Triple Bottom formation, it confirms that bullish momentum has taken control.
Why It’s a Strong Setup
- Multiple Confirmation Levels – Unlike a Double Bottom, a Triple Bottom shows three failed attempts to push lower, reinforcing the idea that a base has formed.
- Golden Cross as Trend Validation – The moving average crossover acts as a secondary confirmation, ensuring that the new uptrend has sustained strength.
- Higher Breakout Probability – Once price breaks above the resistance of the Triple Bottom, the presence of a Golden Cross increases the likelihood of sustained upside movement.
Trading Considerations

Alt text: Triple bottom candlestick pattern with the Golden cross.
Traders often view the Triple Bottom as a robust signal, entering on the breakout and setting their stop-loss below the third low.
Oscillator confirmation strategy
This strategy pairs price action patterns (like the golden cross, Double Bottom, or Triple Bottom) with momentum oscillators, such as RSI, MACD, or Stochastic. The oscillator provides an additional layer of confirmation, helping traders avoid false signals.
How it works:
- Identify a setup like a double bottom.
- Check the oscillator for confirmation. For example:
- RSI rising above 50 suggests bullish momentum.
- MACD crossing above its signal line adds confidence to the reversal.
- Stochastic showing bullish divergence (price making lower lows while stochastic makes higher lows) signals a potential trend change.
- Enter the trade when the price action and oscillator align, increasing the likelihood of success.

Alt text: Stochastic oscillator confirmation trading strategy.
By combining oscillators with price patterns, traders improve their decision-making and filter out weaker setups.
Advantages of Trading on the Golden Cross
- Trend Identification
The golden cross is one of the most straightforward signals for identifying when a market trend is shifting from bearish to bullish. It uses the crossover of moving averages—typically the 50-day and 200-day—giving traders a visual cue that buyers are gaining control.
Alt text: Golden cross identifying a bullish trend.
- Broad Applicability
This signal works across multiple timeframes and markets, from stocks to forex, making it versatile for traders with different strategies. Whether you’re day trading or investing long-term, the golden cross can be a helpful guide.
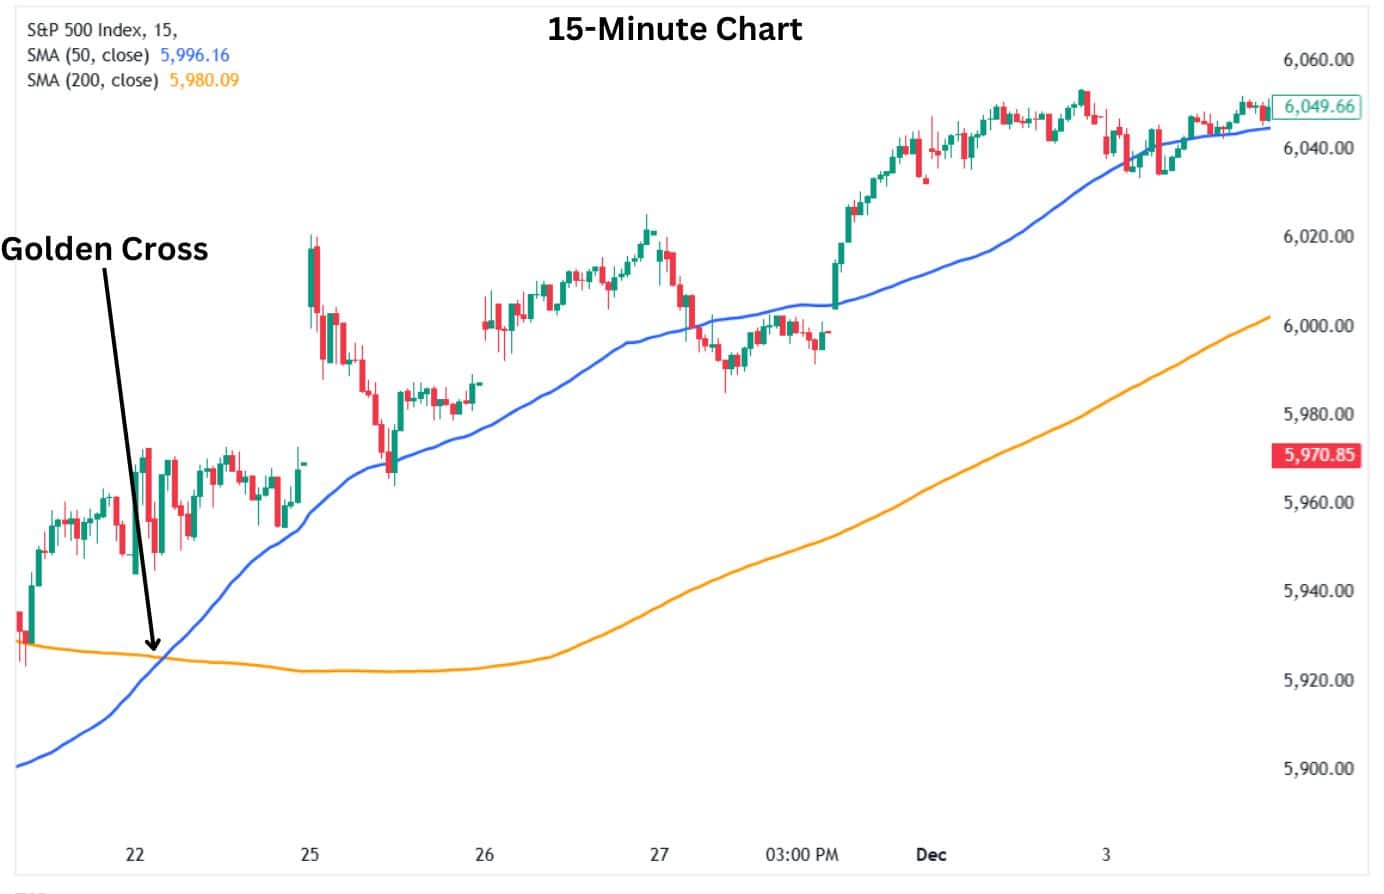
Alt text: The golden cross applied to the 15-minute S&P 500 chart.
- Strong Historical Performance
The golden cross has a track record of being a reliable indicator for new bullish phases within a strong trending market. Historical data often shows that major bullish moves, especially in stocks or indices, follow a golden cross.
- Momentum Confirmation
By its nature, the golden cross confirms that short-term momentum (shorter moving average) is now aligned with the long-term direction (longer moving average). This alignment often coincides with increased buying interest.
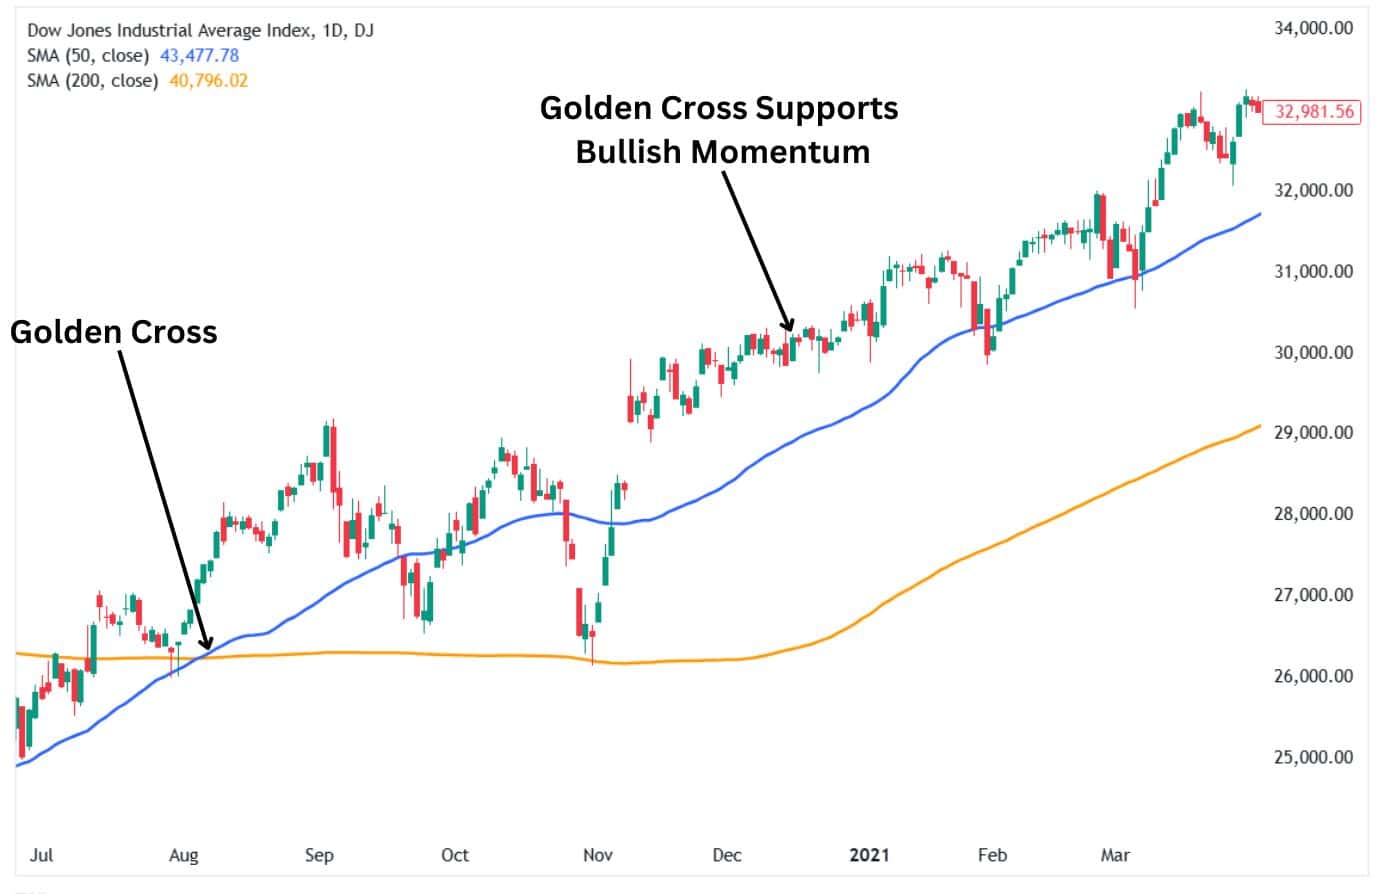
Alt text: golden cross supports and confirms bullish momentum.
- Simple to Understand and Follow
For beginner traders, the golden cross is easy to understand and apply. It requires no complex indicators—just two moving averages plotted on a chart. This simplicity allows traders to make decisions without overanalysing.
Disadvantages of Trading on the Golden Cross
- Lagging Nature
Moving averages are lagging indicators, meaning they reflect past price action. By the time a golden cross forms, a significant portion of the bullish move may already have occurred, causing traders to enter late.
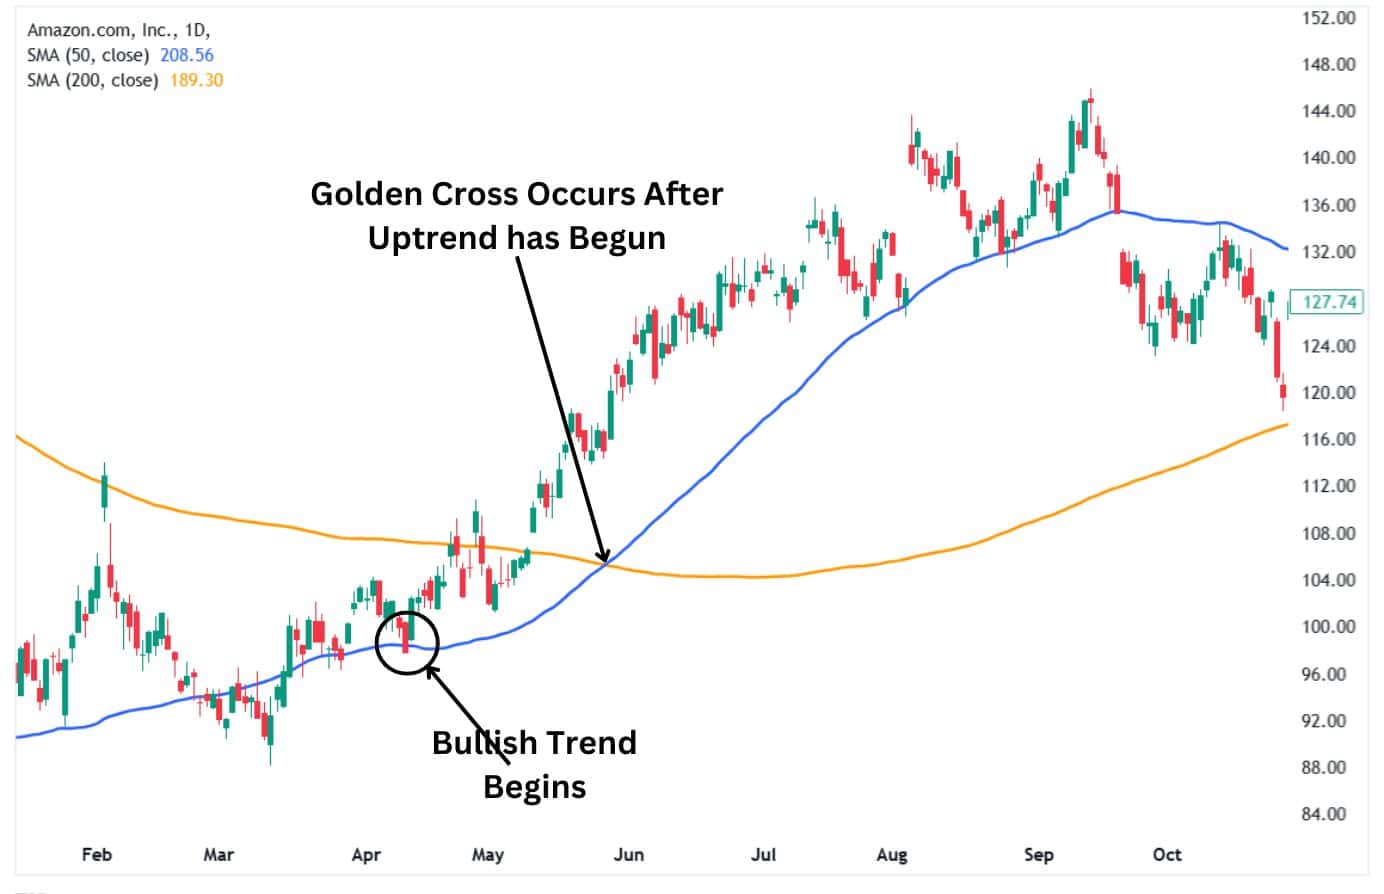
Alt text: The golden cross’s lagging nature.
- False Signals in Choppy Markets
In range-bound or sideways markets, the golden cross can generate false signals. The crossover might occur without a sustained trend, leading to losses if the price reverses quickly.
- No Built-In Risk Management
While the golden cross signals a potential uptrend, it doesn’t offer guidance on where to set stop-loss levels or manage risk. Traders need to rely on additional tools or strategies for this.
- Less Effective in Volatile Markets
In highly volatile conditions, moving averages can cross frequently without indicating a clear trend. This “whipsaw” action can lead to confusion and multiple losses.
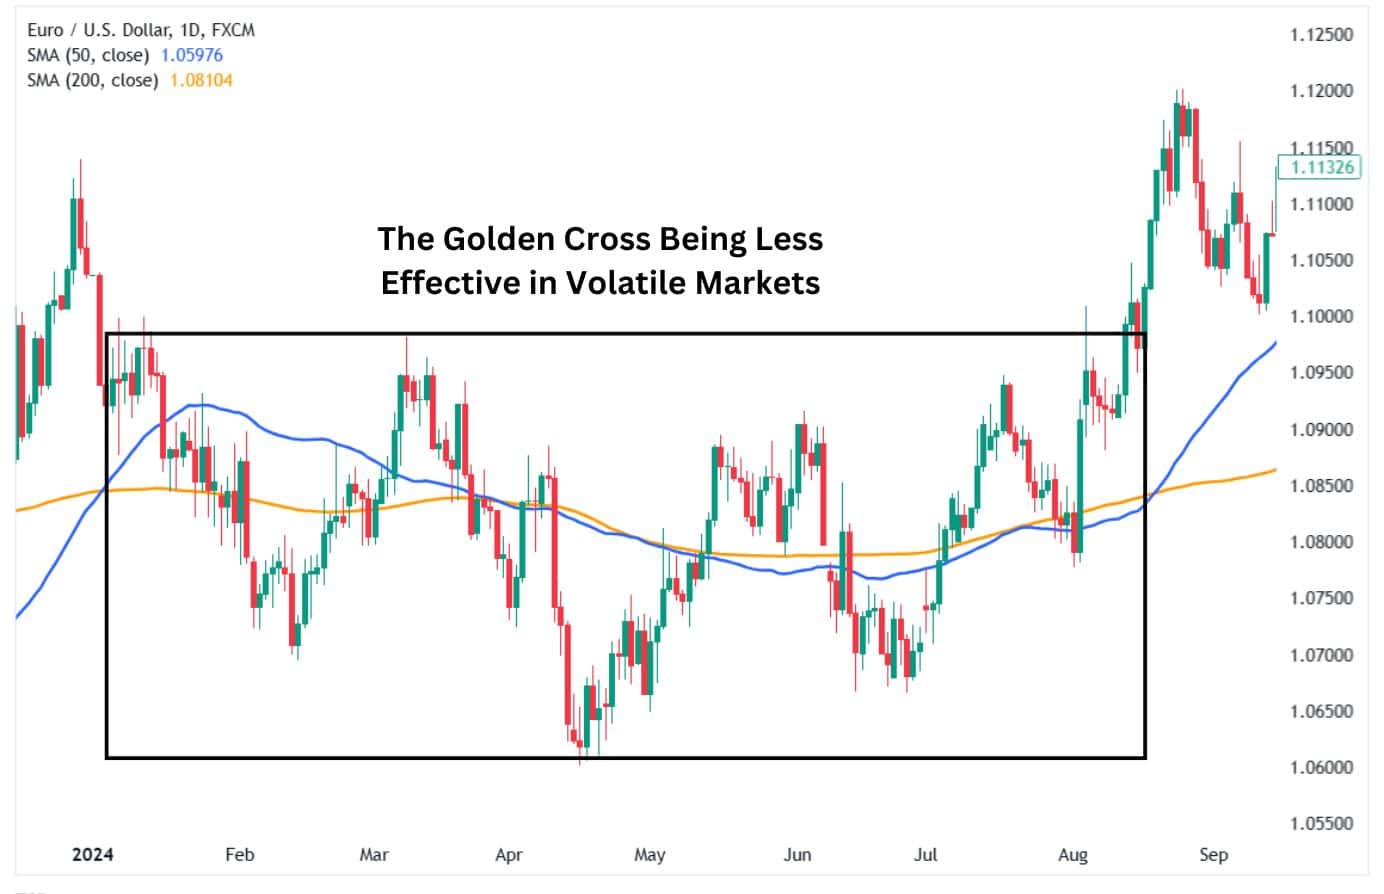
Alt text: golden cross being less effective in volatile markets.
- Limited in Short-Term Trading
The golden cross may not be practical for intraday or very short-term trading. It works best for longer timeframes, as short-term price fluctuations often cause moving averages to cross without forming meaningful trends.
What Indicator is Best to Trade With a Golden Cross?
The best indicators to pair with a golden cross depend on your trading style and objectives, but here are some popular and effective options to confirm the signal and enhance your trading decisions:
Relative Strength Index (RSI)
Why use it? The relative strength index (RSI) measures the strength and momentum of a trend, helping confirm whether the golden cross is backed by bullish momentum. It’s particularly useful for avoiding false signals in overbought or oversold conditions.
How to use it:
- Look for the RSI to be above 50 during or shortly after the golden cross. This indicates that the bullish trend has momentum behind it.
- If the RSI is rising but hasn’t hit overbought levels (above 70), it’s a strong confirmation of the upward trend.
- Be cautious if the RSI is already overbought when the golden cross occurs, as it may signal that the trend is near exhaustion.
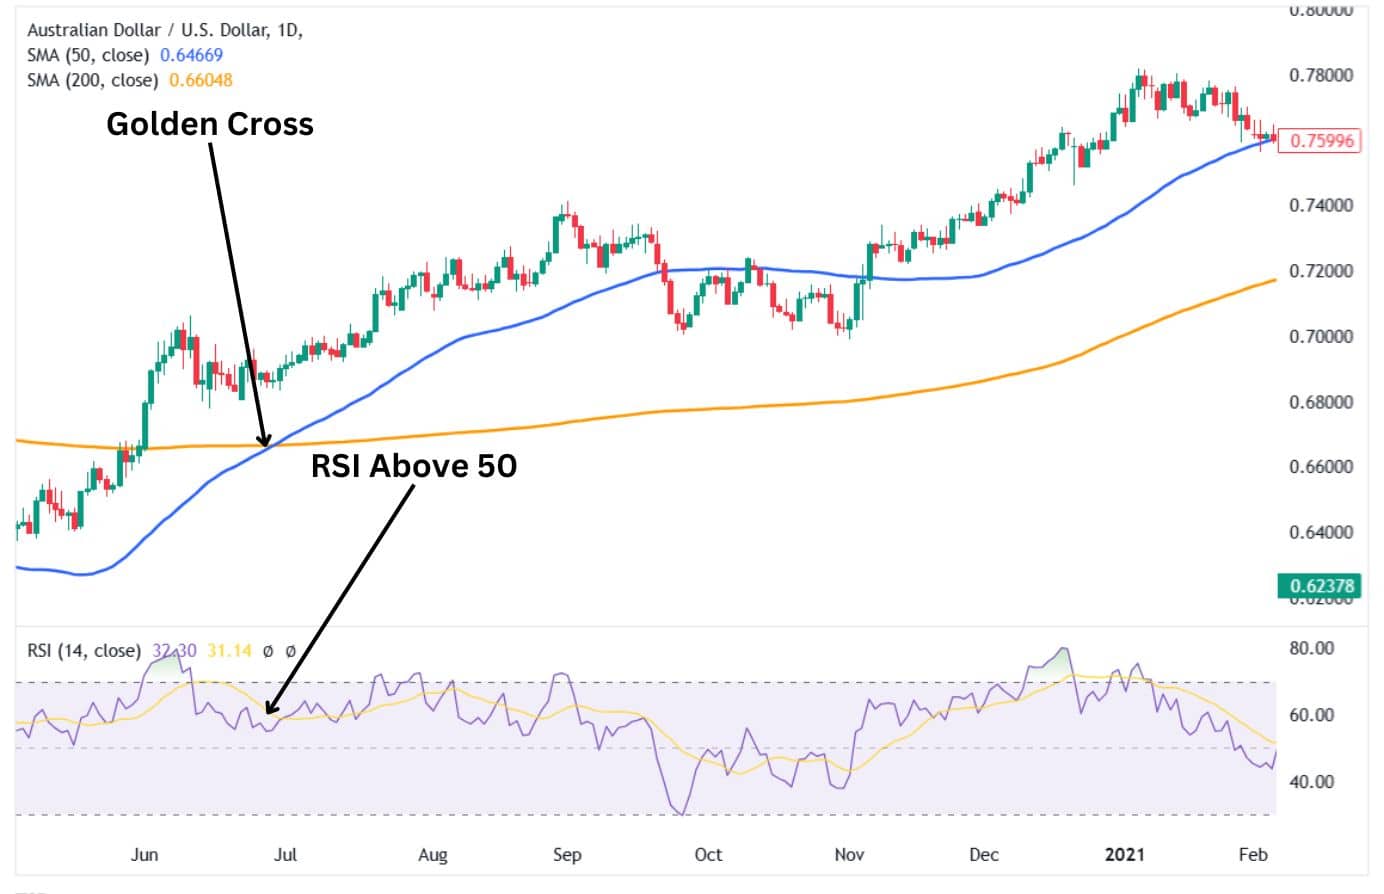
Alt text: golden cross combined with the RSI for confirmation.
Moving Average Convergence Divergence (MACD)
Why use it? The MACD highlights momentum and trend direction, making it an excellent tool for confirming the golden cross. It also helps traders avoid choppy markets by identifying when bullish momentum is building.
How to use it:
- Look for the MACD line to cross above the signal line when the golden cross occurs or shortly after. This alignment indicates that buying pressure is increasing.
- Ideally, the MACD histogram should turn positive, and the MACD line should be above the zero line, reinforcing the bullish signal.
- If the MACD shows divergence (price rises, but MACD weakens), it could be a warning to avoid or exit the trade.

Alt text: golden cross combined with MACD for confirmation.
Volume Indicators Such As On-Balance Volume or Volume Oscillator
Why use it? Volume confirms the strength of price movements. A golden cross backed by increasing volume shows strong participation from buyers, increasing the likelihood of a sustained uptrend.
How to use it:
- Use the On-Balance Volume (OBV) to check whether volume trends align with the golden cross. If the OBV is rising, it suggests that smart money is driving the move higher.
- Alternatively, monitor the volume oscillator. A spike in volume during or after the golden cross signals strong interest in the new trend.
- Avoid trades where volume is low or declining during the golden cross, as this often indicates a lack of conviction.
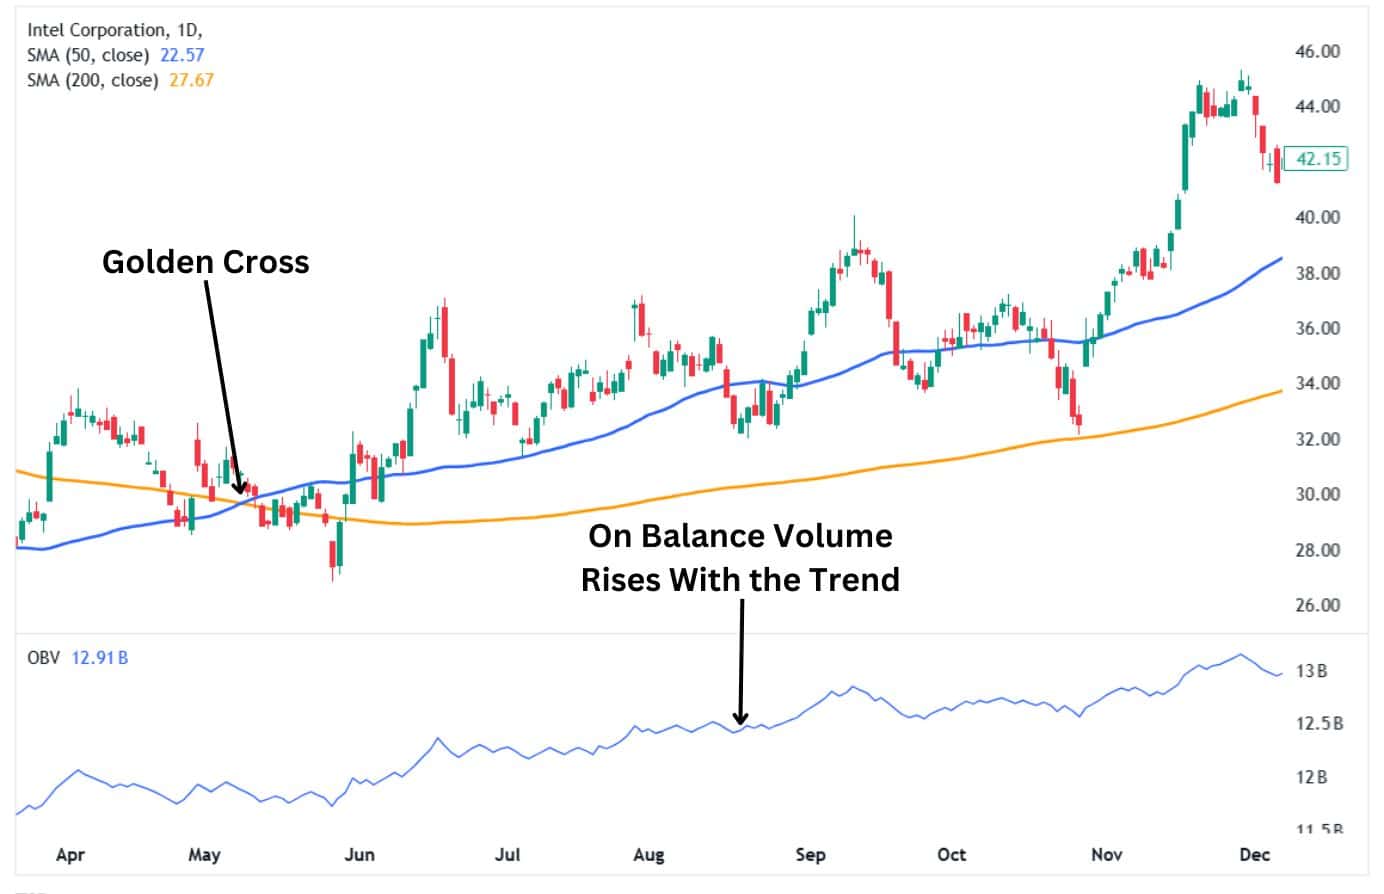
Alt text: golden cross combined with the On Balance Volume for confirmation.
By combining these three indicators—RSI for momentum, MACD for trend strength, and volume for confirmation—you can significantly increase your confidence in the golden cross signal and reduce the risk of false entry signals.
Golden Cross vs. Death Cross
The golden cross and death cross are like two sides of the same coin—both involve moving averages crossing but signal opposite market trends.
Golden Cross
- Happens when the short-term moving average (like the 50-day) crosses above the long-term moving average (like the 200-day).
- It signals a potential bullish trend or upward momentum.
- Traders interpret it as a “green light” for buying, expecting prices to continue rising.
Alt text: An example of the golden cross chart pattern.
Golden Death Cross
- Occurs when the short-term moving average crosses below the long-term moving average.
- It signals a potential bearish trend or downward momentum.
- This is often seen as a “red light,” warning traders of declining prices and potential selling pressure.
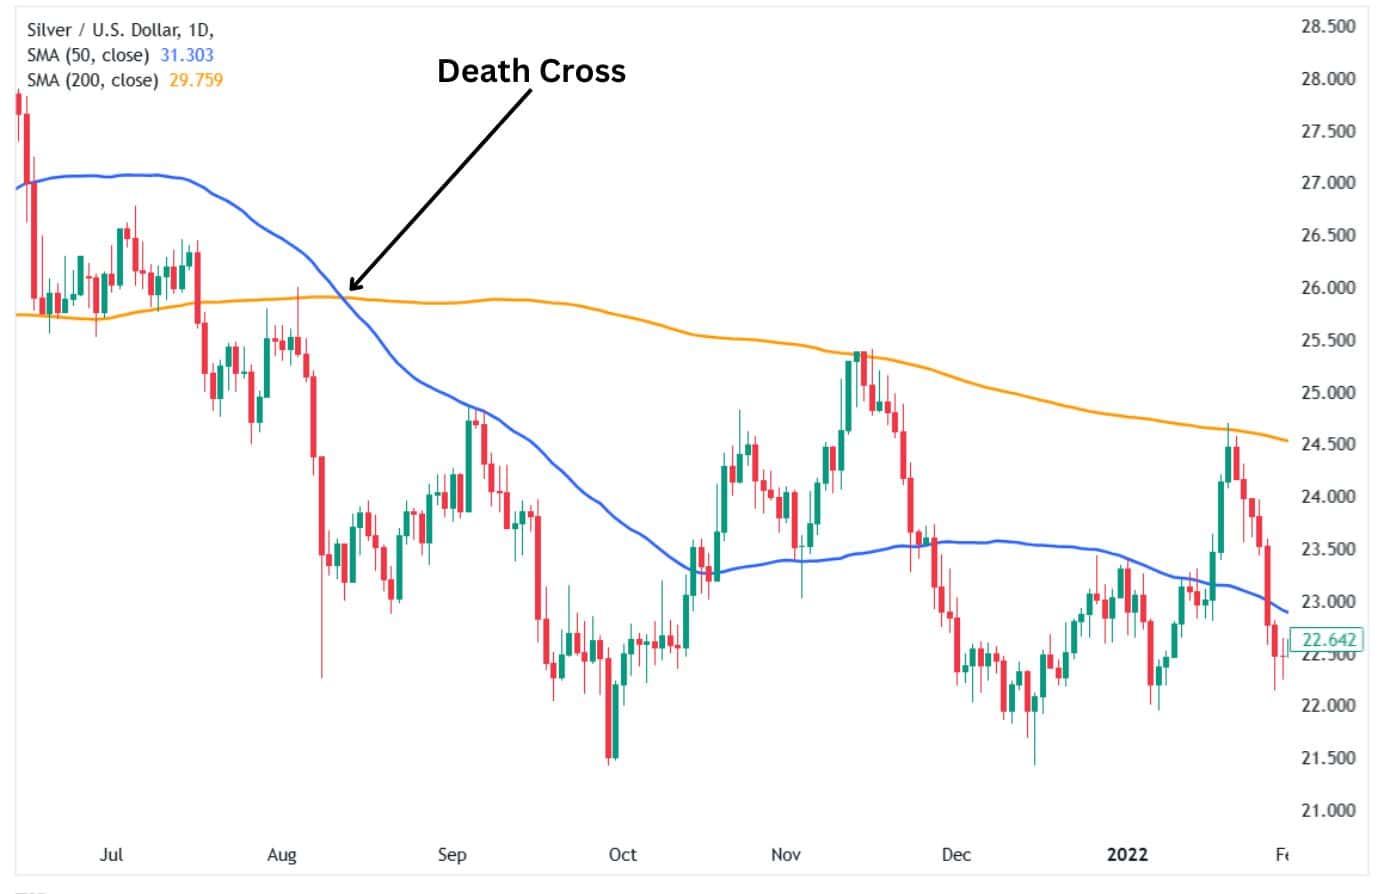
Alt text: Death cross example.
Key Difference:
- Golden cross = bullish phase alert, indicating market strength.
- Death cross = bearish phase alert, indicating market weakness.
Both patterns rely on past price action, so they work best in trending markets and may give false signals during sideways or choppy market conditions.
What To Watch Out For When Using a Golden Cross
The golden cross is a powerful indicator, but it’s not foolproof. Here’s what beginner traders should be cautious about:
1. Lagging Nature
- Moving averages rely on past prices, which means the golden cross often forms after the trend has already begun. By the time the cross occurs, the price may have already risen significantly, reducing the profit potential.
- Solution: Combine the golden cross with other indicators like RSI or MACD to confirm the trend early.
2. False Signals in Sideways Markets
- In range-bound markets, the moving averages may cross multiple times without a clear trend forming, leading to “whipsaw” trades that result in losses.
- Solution: Check for strong price momentum and volume increases before acting on the golden cross.
3. Overreliance on the Signal
- The golden cross doesn’t provide information about entry points, stop-loss levels, or risk management. Traders who rely solely on it may enter trades without a clear plan.
- Solution: Use the golden cross as a signal to confirm your analysis, not as the sole basis for entering a trade.
4. Context is Key
- The golden cross works best in trending markets, but its effectiveness diminishes in highly volatile or news-driven conditions. For example, an unexpected news event can reverse the trend quickly, rendering the golden cross invalid.
- Solution: Keep an eye on fundamental factors and market sentiment alongside technical signals.
5. Overbought Conditions
- If the golden cross occurs when the price is already significantly above recent support levels, it may indicate that the trend is nearing exhaustion.
- Solution: Look for confirmation from indicators like RSI or Stochastic to ensure the market isn’t overbought.
In Summary:
The golden cross is a helpful tool for identifying potential bullish trends. However, it is frequently a lagging indicator that works best when combined with other indicators and a solid trading plan. Always account for market context, manage your risk, and avoid relying solely on any single signal.
How to Avoid False Golden Cross Signals
A Golden Cross is often celebrated as a bullish signal, but it’s important to understand that it only indicates a shift in trend momentum—not an automatic buying opportunity. Many traders make the mistake of entering a position as soon as the Golden Cross occurs, only to see price reverse or consolidate. To improve trading accuracy, it’s essential to use additional technical confirmation before making a decision.
The Golden Cross is a Trend Alert, Not a Buy Signal
A Golden Cross forms when the 50-day moving average crosses above the 200-day moving average, signaling a potential bullish phase. However, by the time this crossover happens, price may have already rallied significantly, meaning an entry at this point could be late or expose traders to whipsaws and pullbacks.
Instead of blindly buying after a Golden Cross, traders should analyze other technical factors to confirm whether the trend is strong enough to sustain an uptrend.
FAQs
Common Golden Cross mistakes to watch out for?
Mistakes include ignoring market context, entering trades too late, and relying solely on the signal without risk management. It’s less effective in choppy markets and can give false signals. Use tools like RSI or volume for confirmation and always have a trading plan.
What is the best time frame to use for the golden cross indicator?
The daily chart is ideal for most traders, as it provides trade signals based on the 50-day and 200-day averages. Hourly charts suit short-term traders but are prone to false signals. Weekly charts work well for long-term investors who focus on major trends.
How reliable is the golden cross indicator?
The golden cross is reliable in trending markets, but its reliability drops in sideways market conditions. It’s a lagging indicator, triggering buy signals after trends have started. The golden cross is typically paired with volume or momentum tools to confirm its trade setups and avoid false signals.
Why are the 50-day and 200-day moving averages important in the golden cross?
The 50-day and 200-day moving averages represent short-term momentum and long-term trends, making their crossover significant. Traders worldwide use them, creating a self-fulfilling effect. The two moving averages also smooth price noise, helping traders identify major market shifts.
Can a golden cross occur in both uptrends and downtrends?
A golden cross occurs in uptrends or when transitioning from a downtrend to an uptrend. It signals growing bullish momentum when the short-term average crosses above the long-term. During bearish trends, the Death Cross, its polar opposite, tends to occur.
Is the golden cross indicator a leading or lagging indicator?
The golden cross is a lagging indicator as it’s based on past prices. It generates signals after trends have already started. While the golden cross is effective at confirming trends, it may result in late entries. It is usually paired with leading indicators like the RSI for earlier trend identification.
Can the Golden Cross Be Used for Cryptocurrency Trading?
Yes, the Golden Cross can be used for cryptocurrency trading, as it signals a potential bullish trend when the 50-day moving average crosses above the 200-day moving average. However, since crypto markets are highly volatile, false signals are more common, so it’s essential to confirm the trend and entry of the trade with other technical analysis.
Can the Golden Cross Be Used for Forex Trading?
Yes, the Golden Cross can be used for forex trading as an alert to a new bullish phase beginning. Since forex markets are influenced by economic events and geopolitical factors on a country wide scale, it’s important to analyse other technical tools to confirm the trend and generate entry signals.


