Bearish
- January 3, 2025
- 21 min read
How to Trade Bearish Divergence
Bearish divergences are like a raincloud, they forecast when price is about to take a downpour. Knowing this can allow traders to prepare for a short position or get out of a long position, before things get too dicey.
In this article, we’ll break down how you can use the regular / classic bearish divergence to your advantage, and apply it to your swing trading and scalp trading setups.
What is a Bearish Divergence?
Bearish divergence is a pattern used by traders in technical analysis to identify the possible end of a bullish trend, and the beginnings of a new downtrend. On a more technical level, it signals that the buyers’ momentum is weakening, and therefore the conditions for a bearish reversal are improving.
Traders will use momentum indicators, also known as oscillators, to find these bearish divergences and anticipate bearish reversals. Using the right setups with the divergence, traders can enter into powerful short trades and earn from an asset’s price decline.

What is a Regular Bearish Divergence ?

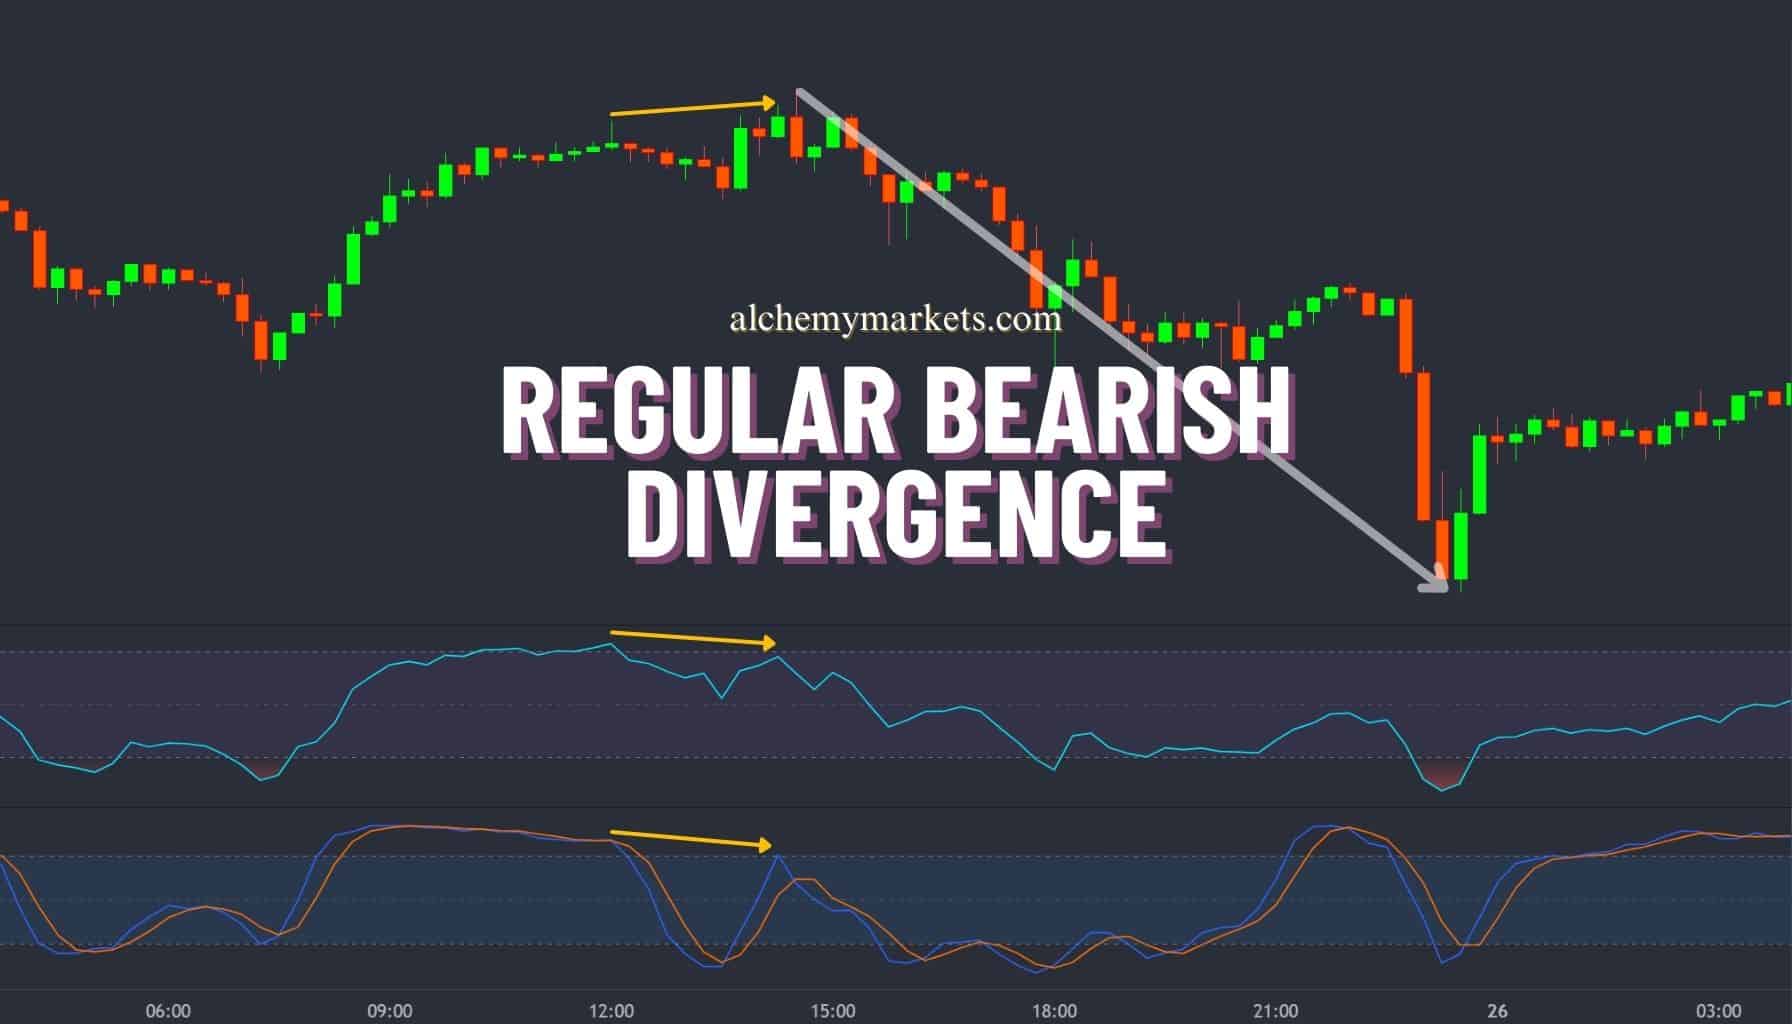
Bearish divergences occur when the price forms a higher high, but the momentum indicator forms a lower high. It forms during an uptrend, and is considered a reversal signal where the price may begin to decline.
What is a Hidden Bearish Divergence?

Hidden bearish divergence happens when the price forms a lower high, but the momentum indicator forms a higher high. This also signals weakness in the price because it suggests there was a concerted effort by bulls to push prices higher, but prices remained lower despite the additional momentum. It is considered a continuation signal during a downtrend.
What is a Bullish Divergence?
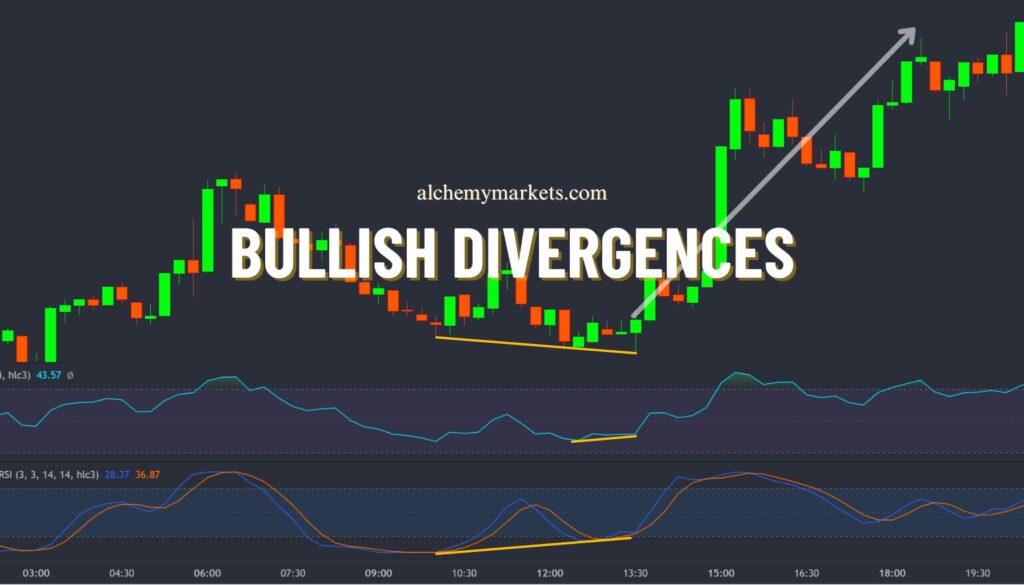
A bullish divergence pattern, like the bearish divergence, can come in variants. There are regular bullish divergence and hidden bullish divergence variants. Both of them suggest an imminent uptrend after the price has experienced a downswing.

A classic bullish divergence is the opposite of a classic bearish divergence, where the price forms a lower low, but the indicator forms a higher low. Hidden bullish divergence is where the indicator forms a lower low while the price forms a higher low. Hidden bullish divergence is the opposite of hidden bearish divergence.
How to Identify the Bearish Divergence Pattern?
Bearish divergence patterns are versatile because they can be identified on any timeframe and asset, when combined with an oscillator, a technical indicator that measures momentum.
Observe this example on Bitcoin back in 2021, see how the price of Bitcoin has formed a higher high, yet the MACD momentum indicator formed a lower high? This is a tell-tale sign of a classic bearish divergence, which signals that bullish momentum has weakened on a push higher. Eventually, the price of Bitcoin drops by more than 75%, over the course of an entire year.

A neat trick for spotting bearish divergences is to mark significant highs and resistance levels on the price chart. As the price approaches these levels from below, traders in long positions often begin to take profit, reducing buying pressure. With buyers commonly exiting the market at these zones, the chances of a bearish divergence increase.
A hidden bearish divergence would instead be forming during the downtrend, where the price makes a pullback but fails to drive to new highs.
What Does a Bearish Divergence Tell You
Contrary to popular belief, a bearish divergence indicates not one but two things:
- That bullish momentum is weakening, creating conditions for a reversal.
- Or it reflects a temporary pause in the bullish movement, with price possibly consolidating or going sideways.
It’s also important to note that the price of an asset can continue to grind higher, despite the appearance of a bearish divergence. It is not an entry signal, but rather a signal for concurrent market conditions.
Bearish divergences are more effective on higher timeframes such as 4H, Daily, Weekly charts. On smaller timeframes, they can result in weaker reversals or provide more false signals due to increased market noise.
Bearish Divergence Example
In this section, we’ll focus on showcasing a regular bearish divergence example. For hidden bearish divergences, please check out our full guide as they are identified differently.
A regular bearish divergence requires the following to be valid:
- The local trend must be an uptrend, forming higher highs, and higher lows.
- The momentum indicator must be forming lower highs, while the price forms a higher high.
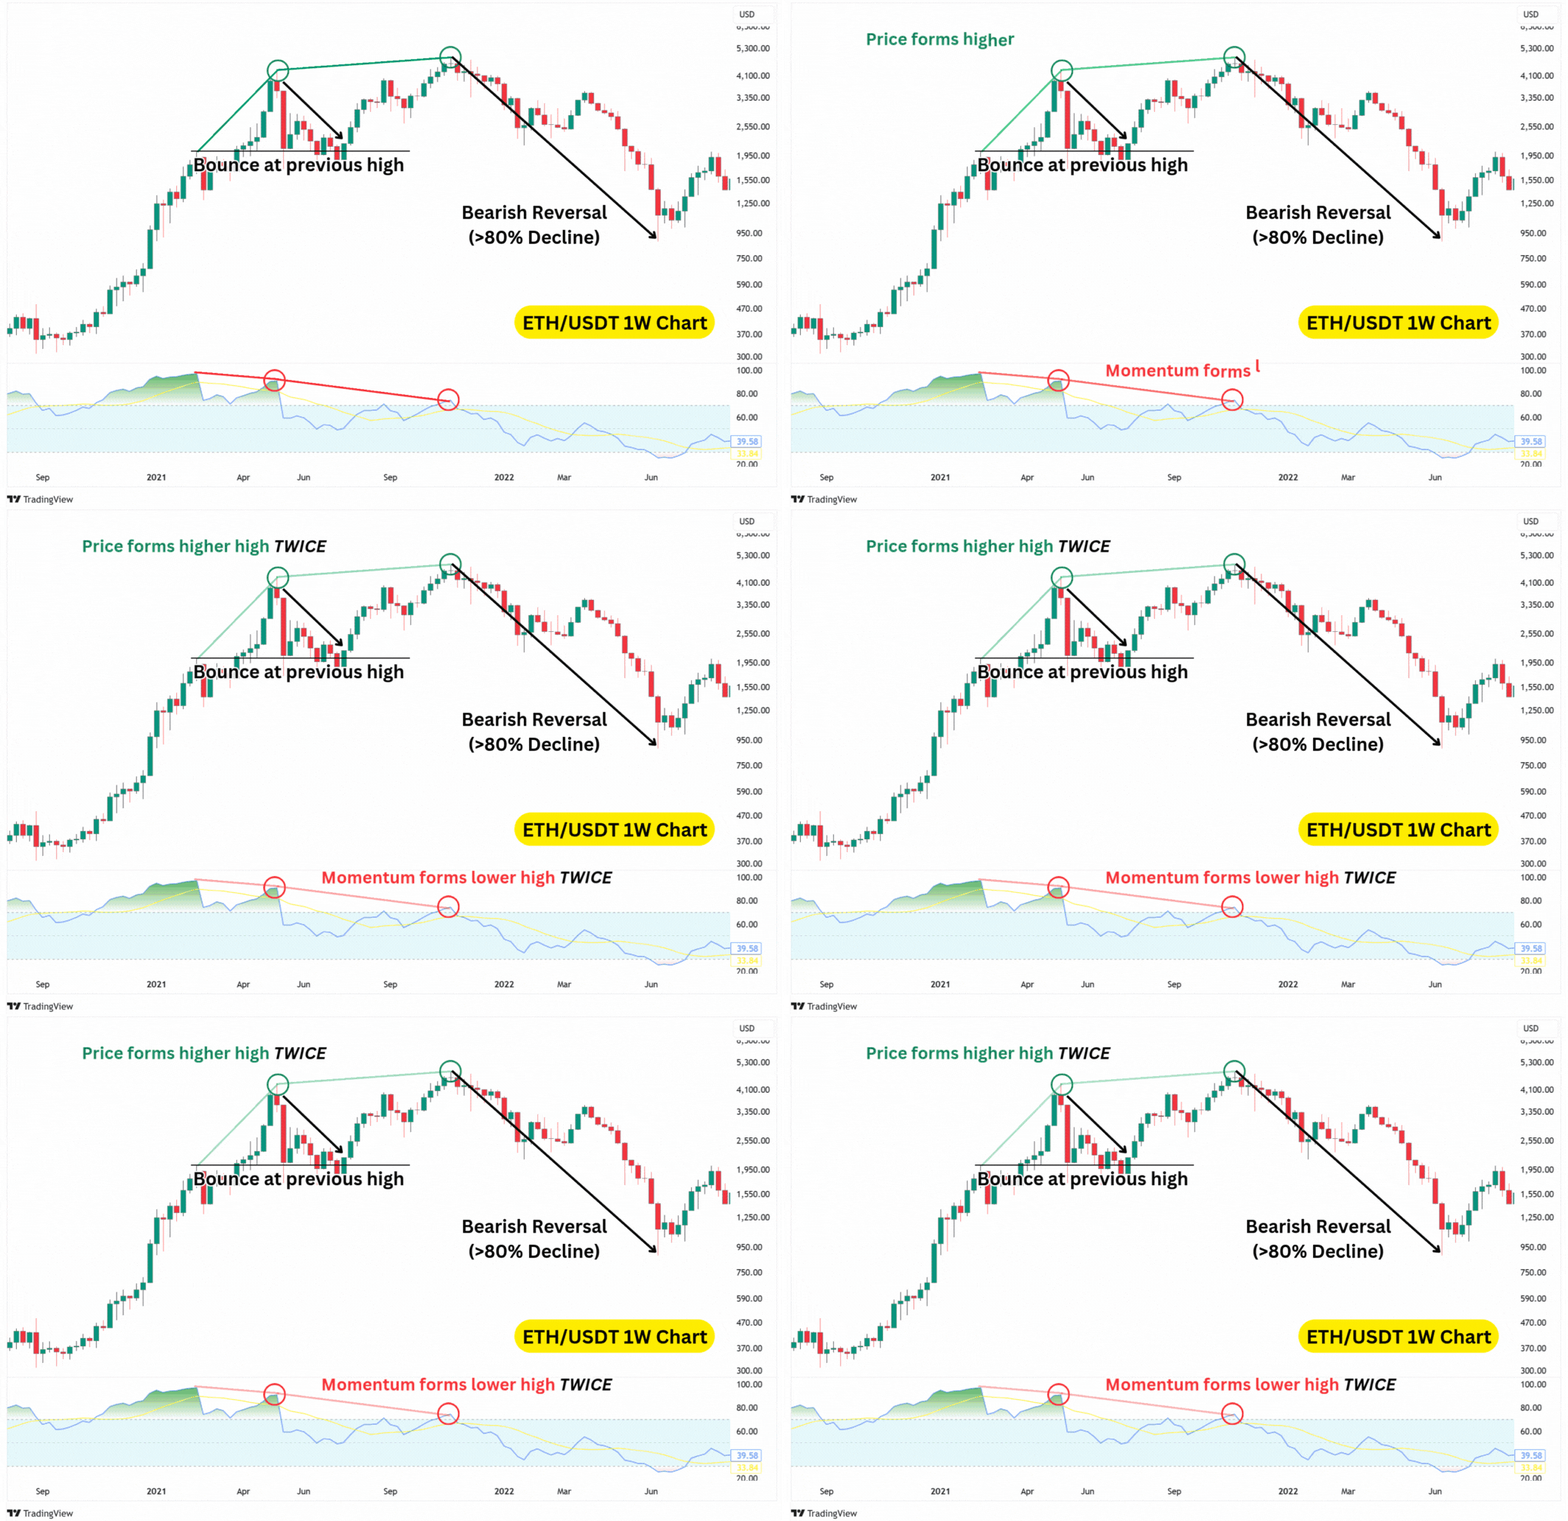
This ETH/USDT Weekly Chart showcases two instances of bearish divergences, each with significantly different outcomes.
The first bearish divergence simply resulted in a pullback amidst a larger uptrend, and the price continued to form higher highs thereafter. The second divergence, however, resulted in a significant reversal of over 80%, shifting the local trend from bullish to bearish.
Key Lessons About the Regular Bearish Divergence:
Our example above highlights several considerations a trader should keep in mind when trading bearish divergences.
- Bearish divergences do not guarantee a 100% chance of playing out.
- The bearish divergence is not a short signal by itself. The price decline can happen at a later time.
- A bearish divergence does not tell you how far or significant the reversal will be, nor will it guarantee a true trend shift.
The trend is your friend until the end – if the trend is towards the upside, there is a strong likelihood that a bearish reversal will result in a pullback, before price continues in the direction of the prevailing uptrend.
Bearish Divergence Trading Indicators
Regular bearish divergences are commonly observed through the use of oscillators, technical indicators which measure momentum by assessing the direction and speed of price changes. Popular oscillators like RSI and Stochastics also provide overbought and oversold signals, indicating when an asset’s momentum may have peaked.
In this section, we’ll go through several indicators you can use for identifying bearish divergences.
| An important tip: The source setting of your indicators matter. The source dictates whether your indicator uses candle bodies, or candle wicks for its calculation. To align better with wick-based divergence analysis, traders can set these indicators’ source to “HLC3” (High, Low, Close). This setting includes price wicks, fitting the common practice of using wick-based trendlines. However, if you are using line charts for your technical analysis, then the default “Close” source works perfectly fine as there are no wicks on line charts. |
To see the difference between using the HLC3 and CLOSE settings, observe this illustration below:

Spot Bearish Divergence using Moving Average Convergence Divergence
The MACD, or Moving Average Convergence Divergence indicator is considered an all-in-one indicator as it offers multiple insights about the market trend, momentum, and also provides divergence signals.
The indicator is made up of four components, but for identifying divergences, traders typically use either the MACD line (blue line) or the histogram (columns). A regular/ classic bearish divergence is observed when:
- The price forms higher highs.
- While the MACD Line or the histogram forms lower highs.
Here’s how that’ll look when using the histogram to spot a divergence:
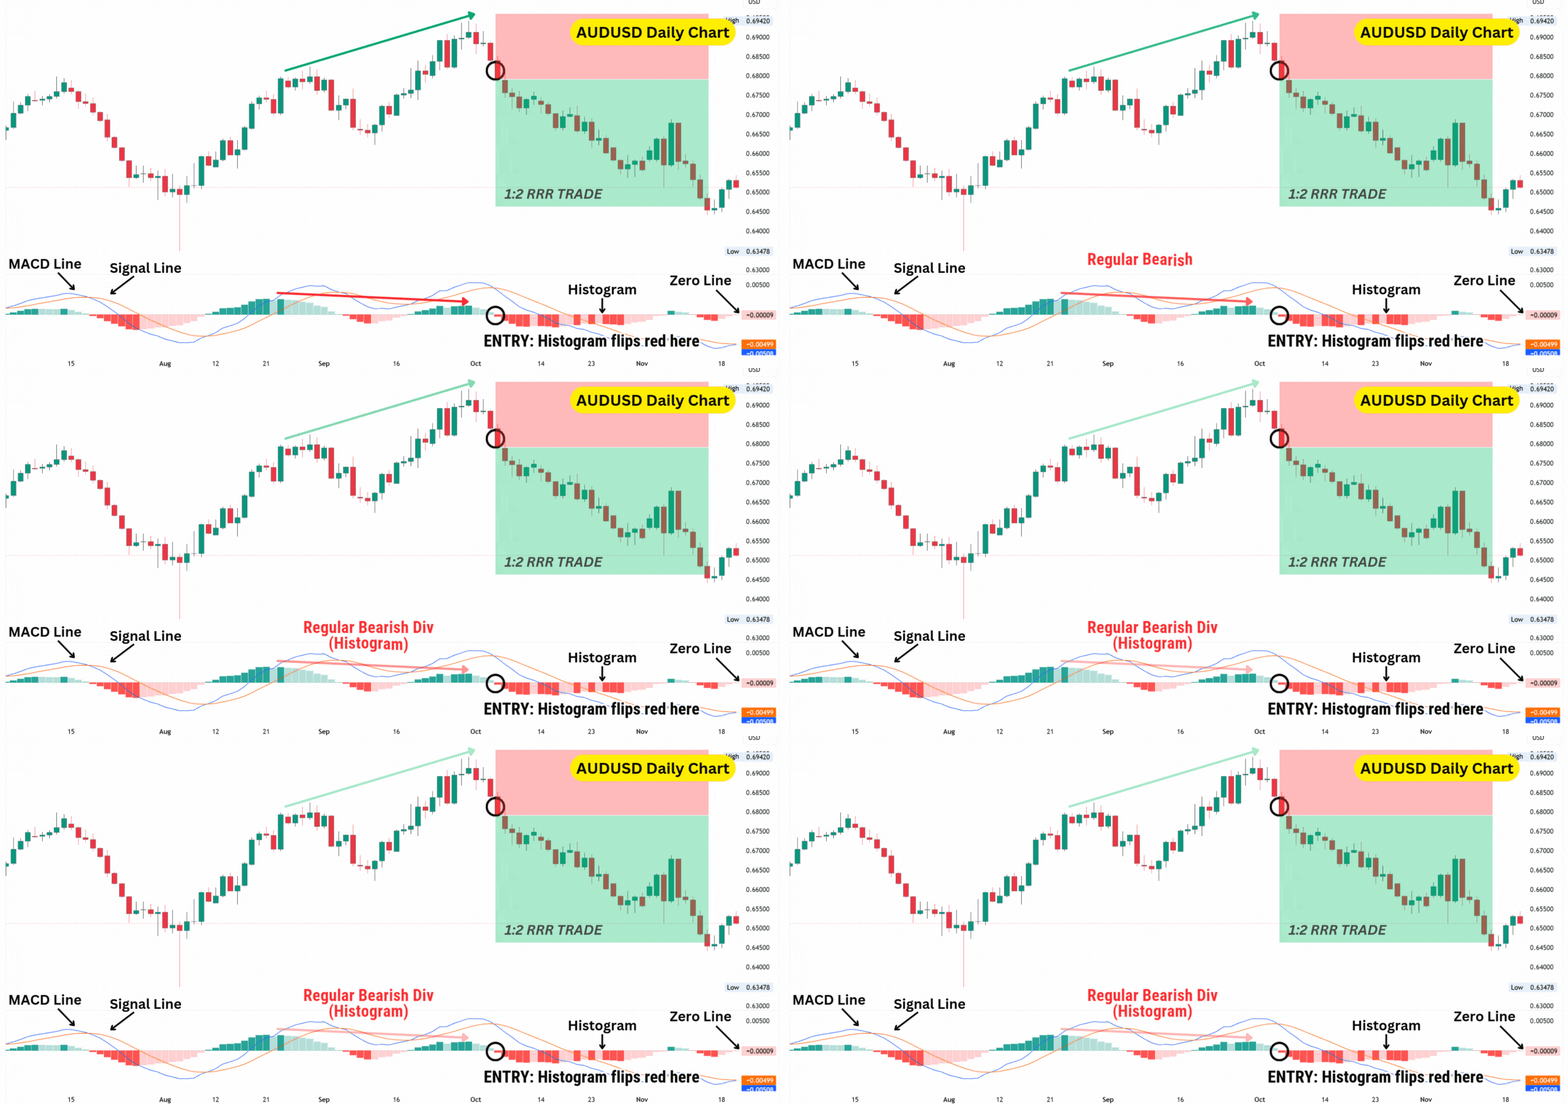
Observe how the AUDUSD price was forming higher highs, while the MACD histogram was forming lower highs. This signals weakening bullish momentum, but is not an entry signal by itself.
The entry signal should confirm that downward momentum is coming into the market, improving the odds of a bearish reversal. Being an all-in-one indicator, the MACD indicator is able to provide an entry signal for our short position:
- Enter short when the histogram closes red after the divergence has been spotted.
- Stop loss placed above the highs, and the take profit set to 1:2 risk-to-reward.
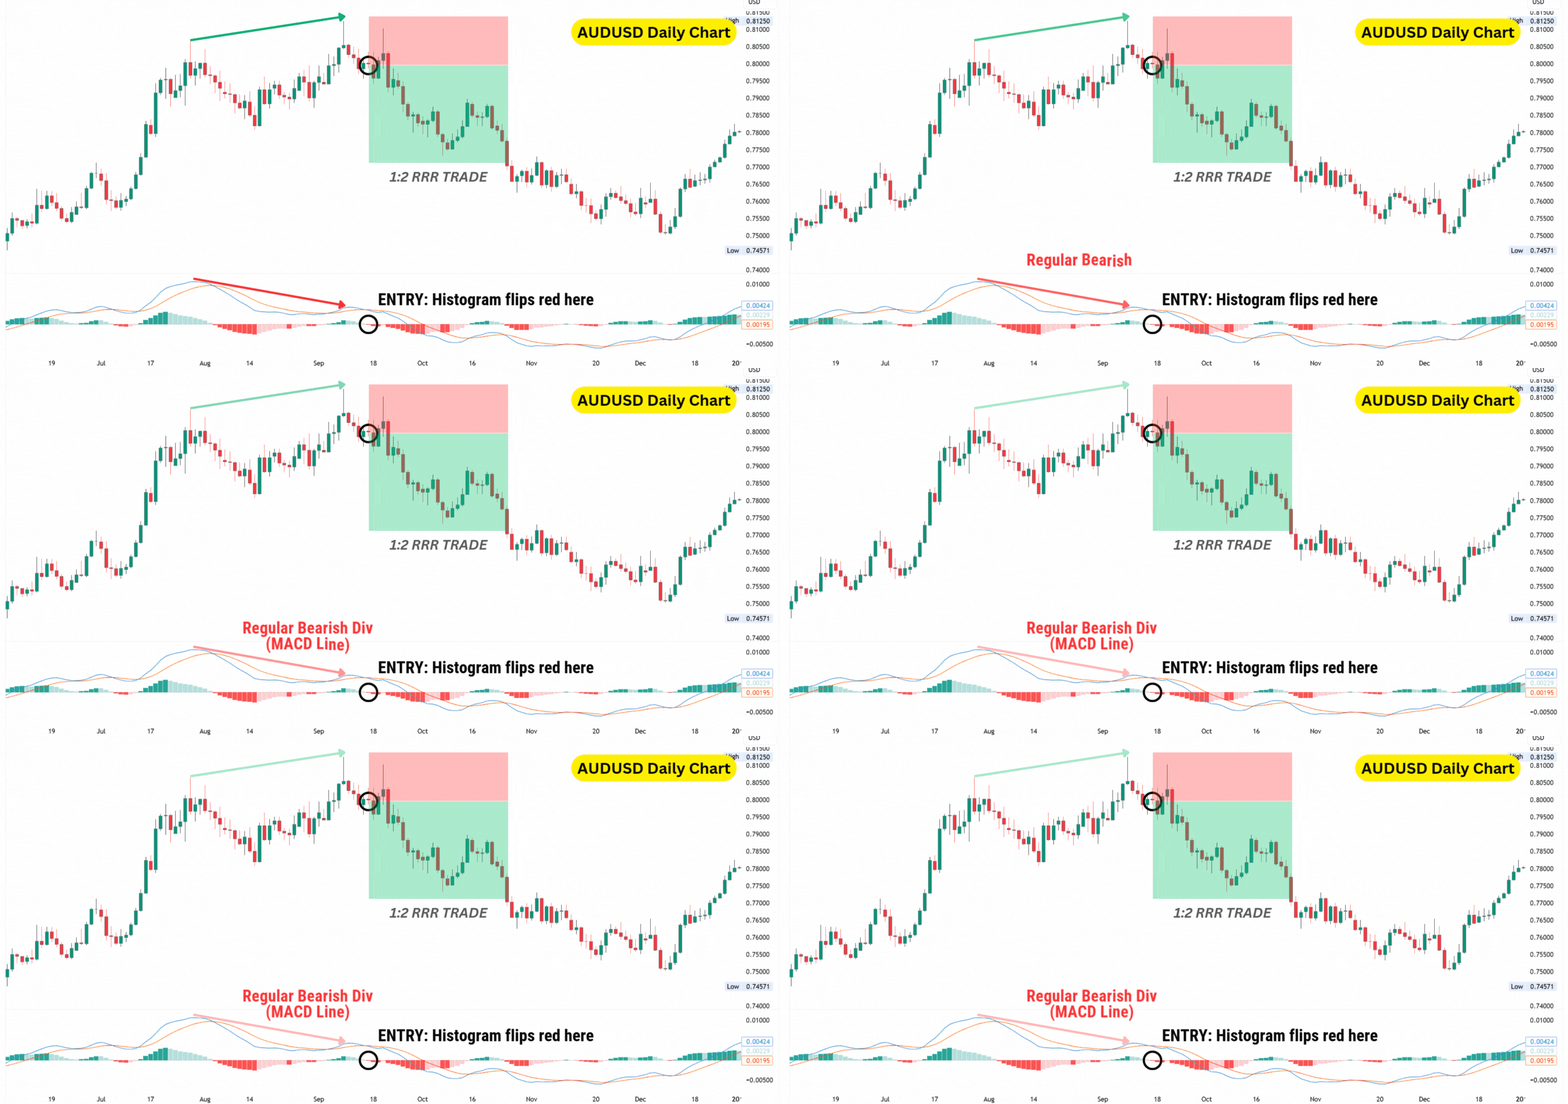
The MACD Line would function similarly, where if the line forms a lower high, but price forms a higher high – we then would have a classic bearish divergence. Here’s how it would look:
Spot Bearish Divergence using Stochastic Oscillator
The Stochastics Oscillator, or Stochastics, measures momentum by plotting two lines to show the current price’s relative position to the highest high and lowest low, in the last 14 candlesticks. A value closer to 100 indicates the price is near the highest high, while a value closer to 0 means it is near the lowest low. The values are always confined within the 0–100 range.
Additionally, the Stochastics offer “overbought” and “oversold” signals, where price momentum is at its peak, but also at a higher risk of exhaustion (therefore leading to a reversal). When the stochastics is above 80, it indicates overbought conditions, while readings below 20 indicate oversold conditions.
The stochastics is made up of two lines:
- %K Line: The fast line showing the closing price’s position relative to the highest and lowest points in the last 14 candlesticks.
- %D Line: The slow line, a 3-period average of %K, offering a smoother view for spotting trends.
To trade the bearish divergence with the stochastics, look for a situation where the price is forming higher highs, but the %D Line (the orange line) is forming lower highs. Then, when the %K (Fast Line) crosses under the %D (Slow Line), enter short on the candle close.
Don’t worry if the bearish divergence drawn has wicks going through the line – the key thing is that price and the indicator are going in opposing directions.

Spot Bearish Divergence using Relative Strength Index
The RSI indicator, or Relative Strength Index, is a popular tool used by traders to gauge bullish and bearish momentum in an asset, and can signal when a market is in overbought or oversold conditions.
- Overbought: When the RSI is over 70, it means the asset has moved up consistently without any significant corrections.
- Oversold: When the RSI is under 30, it means the asset has moved down consistently without any significant pullbacks.
Generally, nothing in the market moves up (or down) in a straight line without any pauses or pullbacks – therefore when the RSI signals an overbought or oversold condition, it also implies reversals are more probable.
During overbought conditions, a bearish divergence is more likely to result in a bearish reversal. This type of regular bearish divergence is most ideal for looking for short positions, where the following conditions are met:
- A higher high forms on price, but a lower high forms on the RSI.
- At least one of the highs on the RSI are in the overbought territory at ≥70.
- An entry trigger gets fulfilled (in this case, a break of the lower support trendline).
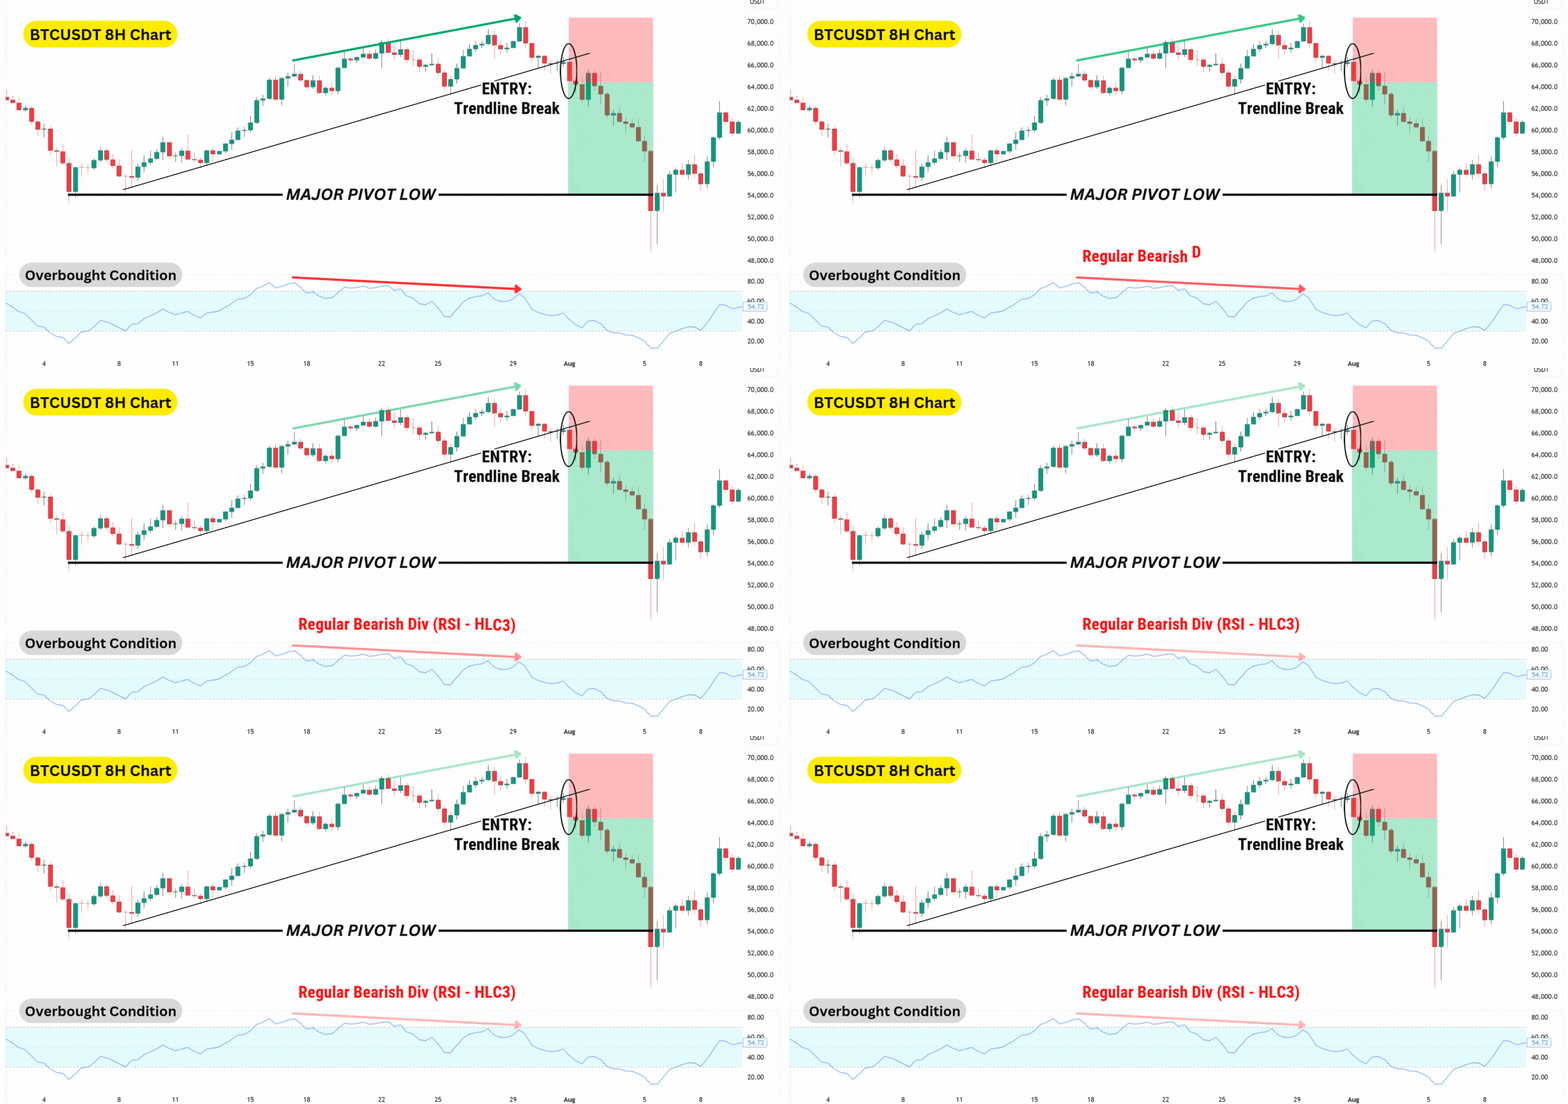
On this 8-hour Bitcoin chart, notice how the price consistently makes higher highs, while the RSI forms lower highs in the overbought zone. These are clear, multiple signs of regular bearish divergence.
However, note how a hasty trader would have gotten stopped out if they entered a short position on the first indication of a bearish divergence. It cannot be overstated how crucial it is to wait for a clear entry signal to time your short position effectively. Entering solely on the divergence could have led to losses as Bitcoin continued to climb. In this case, we used a break of the lower support trendline as the entry trigger, signalling a potential reversal move was beginning.
Spot Bearish Divergence using Commodity Channel Index (CCI)
The Commodity Channel Index (CCI) measures the momentum of price movements on a scale where +100 indicates bullish momentum, -100 indicates bearish momentum, and 0 is the neutral baseline. Unlike indicators like RSI or Stochastics, the CCI doesn’t rely on overbought or oversold zones but instead compares the current price to its average price in the last 20 candlesticks.
By default, most charting platforms calculate the CCI using the HLC3 (average of high, low, and close), which lets us spot divergences using price wicks.
A regular bearish divergence occurs when the price makes a higher high, but the CCI makes a lower high – showing less bullish momentum compared to before. This often is an early indication that bullish momentum is weakening, and a reversal is likely.

For example, on the XRP 1H chart in September 2024, the price formed a higher high while the CCI showed a lower high, signalling a regular bearish divergence. To confirm the setup, we used the EMA 20 as a dynamic support line, which was shown to support the rally as the divergence was developing.
The short trade was triggered when the price broke below the EMA 20 dynamic support, suggesting that the bearish reversal had begun. By placing the stop loss above the recent highs, you could have secured a 1:2 risk to reward short trade.
Spot Bearish Divergence Using Williams %R
Williams Percentage Range, or W%R, measures market momentum between 0 to -100, where 0 is placed at the top, while -100 is placed at the bottom of the indicator.
When the W%R moves higher (near 0), it means the bullish momentum is increasing. Conversely, as it moves lower towards -100, it means that bearish momentum is increasing, or bullish momentum is weakening.
Additionally, the Williams Percentage Range can signal overbought, or oversold conditions:
- Overbought: When the W%R rallies above -20, then falls back below -20, this signals a bearish reversal is likely.
- Oversold: When the W%R falls below -80, then climbs back above -80, this signals a bullish reversal is likely.

In this example, we spot a bearish divergence with an overbought signal on the GBPUSD 3-Hour Chart. Then, the price closes below a higher low, signalling a potential shift in market structure – uptrend of consistent higher highs, and higher lows has been broken. Using this as our entry signal, we’re able to capture a significant bearish reversal back to a previous Major Pivot Low.
Spot Bearish Divergence using Advance-Decline Line (AD)
The Advance-Decline (AD) Line is unique, because instead of measuring the specific asset’s market conditions, it provides a comparative . Instead, it measures market breadth by calculating the difference between the number of advancing and declining stocks on an exchange, such as the NYSE (New York Stock Exchange) or the UK100 for UK stocks.
The AD Line is particularly useful for spotting divergences between the broader market’s trend and its underlying breadth. For instance, if the market index or stock is rising but the AD Line is declining, it may signal weakening market strength, potentially foreshadowing a reversal. Conversely, if the AD Line rises while the index/stock declines, it may indicate underlying bullishness.
In the example below, Tesla’s price forms a double top, while the AD Line registers a significantly lower high. Although Tesla’s price didn’t create a higher high, the lower high on the AD Line indicates a Class B divergence — a scenario where the price forms equal highs while the indicator forms lower highs. Read the “Class of Divergences” section further down in the article to learn more.
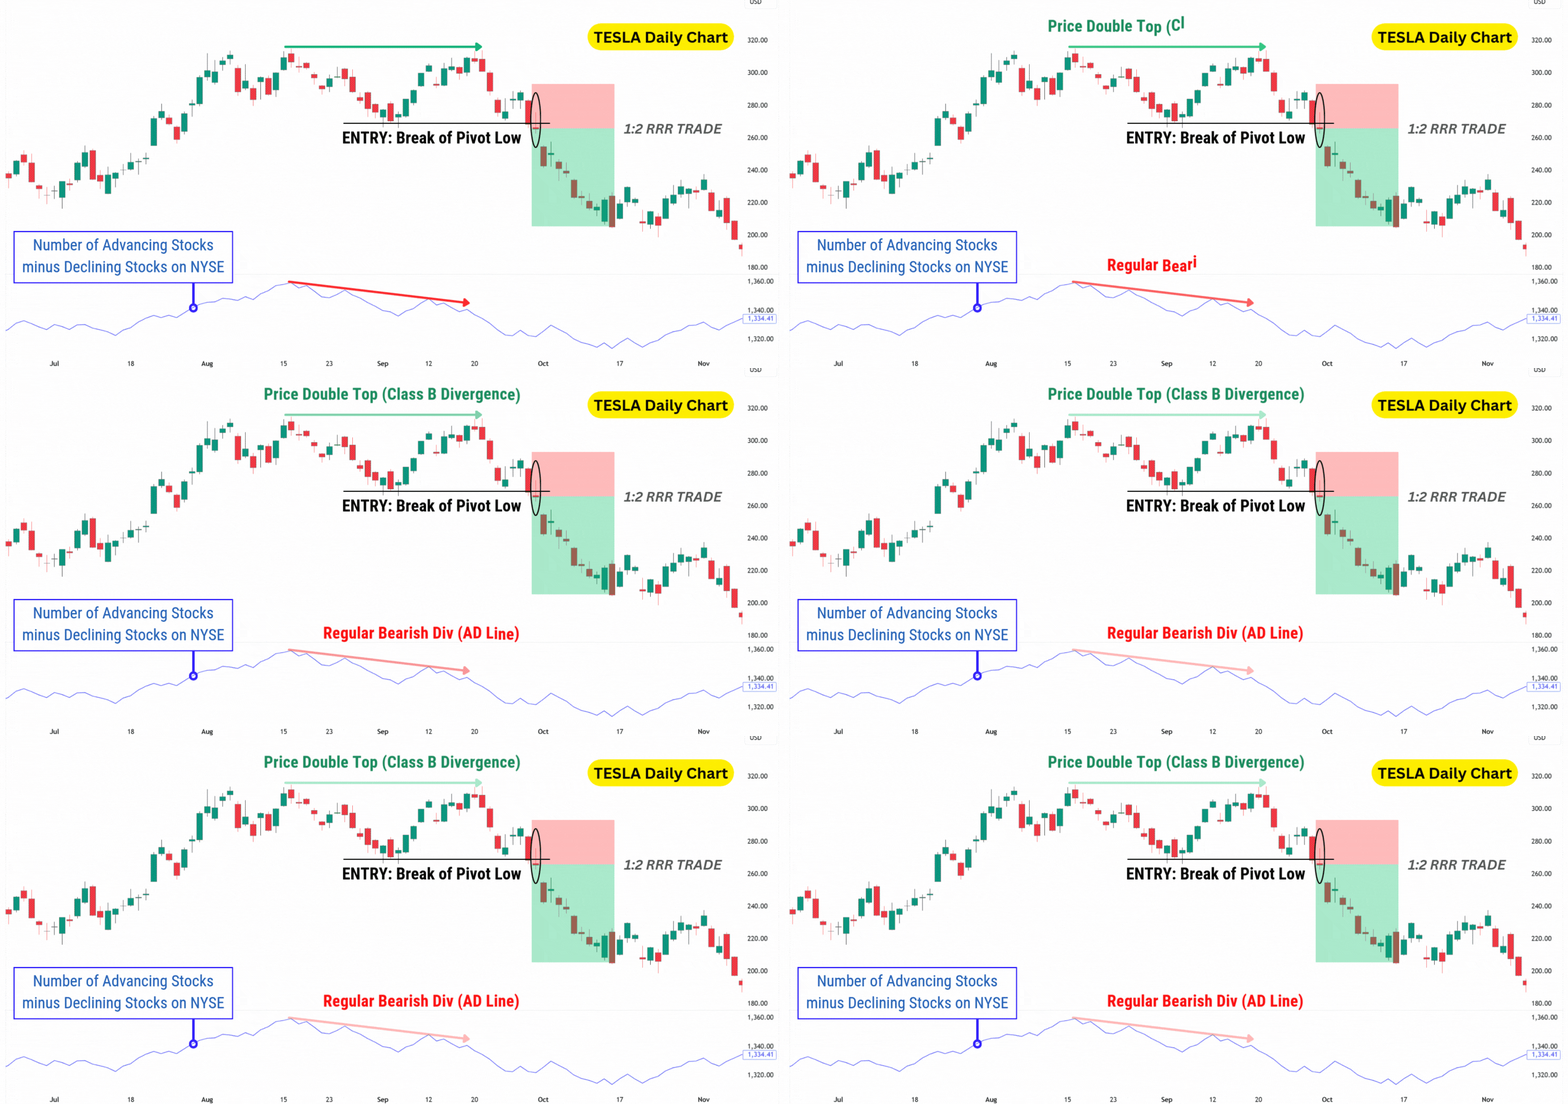
This divergence is a valid bearish signal, highlighting weakening market breadth despite Tesla’s apparent price stability. Following the divergence, Tesla’s price eventually declines, aligning with the broader market trend.
Spot Bearish Divergence using On-Balance Volume (OBV)
On-Balance Volume, or OBV for short, is an indicator that measures the strength of a trend via volume, and price direction. It is considered a momentum oscillator, and has a simple yet unique calculation method.
When there is bullish price action (price moves higher), we add the traded volume into OBV’s calculation – like pouring water into a cup. Conversely, when there is bearish price action (price moves lower), we remove the traded volume from the OBV – pouring water out of the cup.
The straightforward calculation of the On-Balance Volume (OBV) indicator generates a dynamic flow of values that can effectively highlight bullish and bearish divergences.
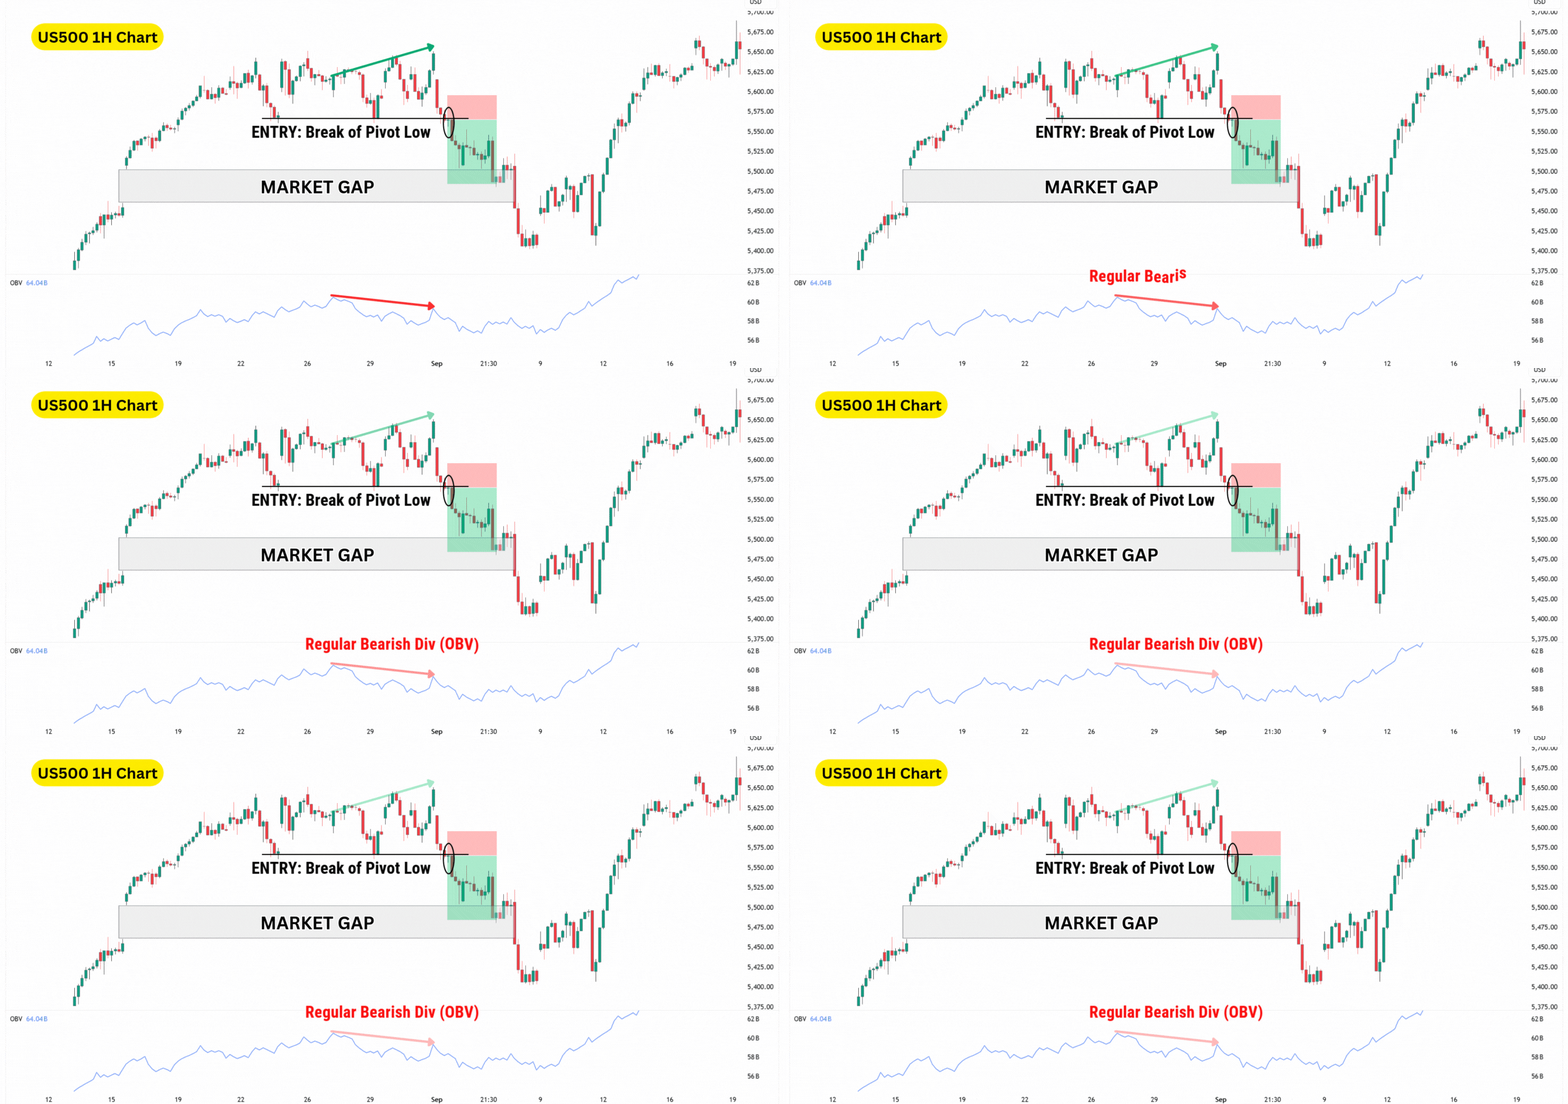
When trading the regular bearish divergence with the OBV indicator, we want to see the following:
- The price creates a higher high, while the OBV creates a lower high.
- The entry signal gets fulfilled, which in this case, is a price close below the pivot low support zone.
Spot Bearish Divergence using Chaikin Money Flow
The Chaikin Money Flow (CMF) is an indicator which identifies negative and positive momentum by allocating it between the values of -1 to +1, where -1 is negative and +1 is positive.
The key to reading the CMF effectively is understanding its movement. If it shifts from positive to negative territory, it signals a change in overall momentum.
When paired with divergence signals, the CMF can provide insights into when a reversal is likely.
For instance, a regular bearish divergence occurs when the CMF fails to make a higher high while the price does, indicating weakening momentum and increasing chances of a bearish reversal.
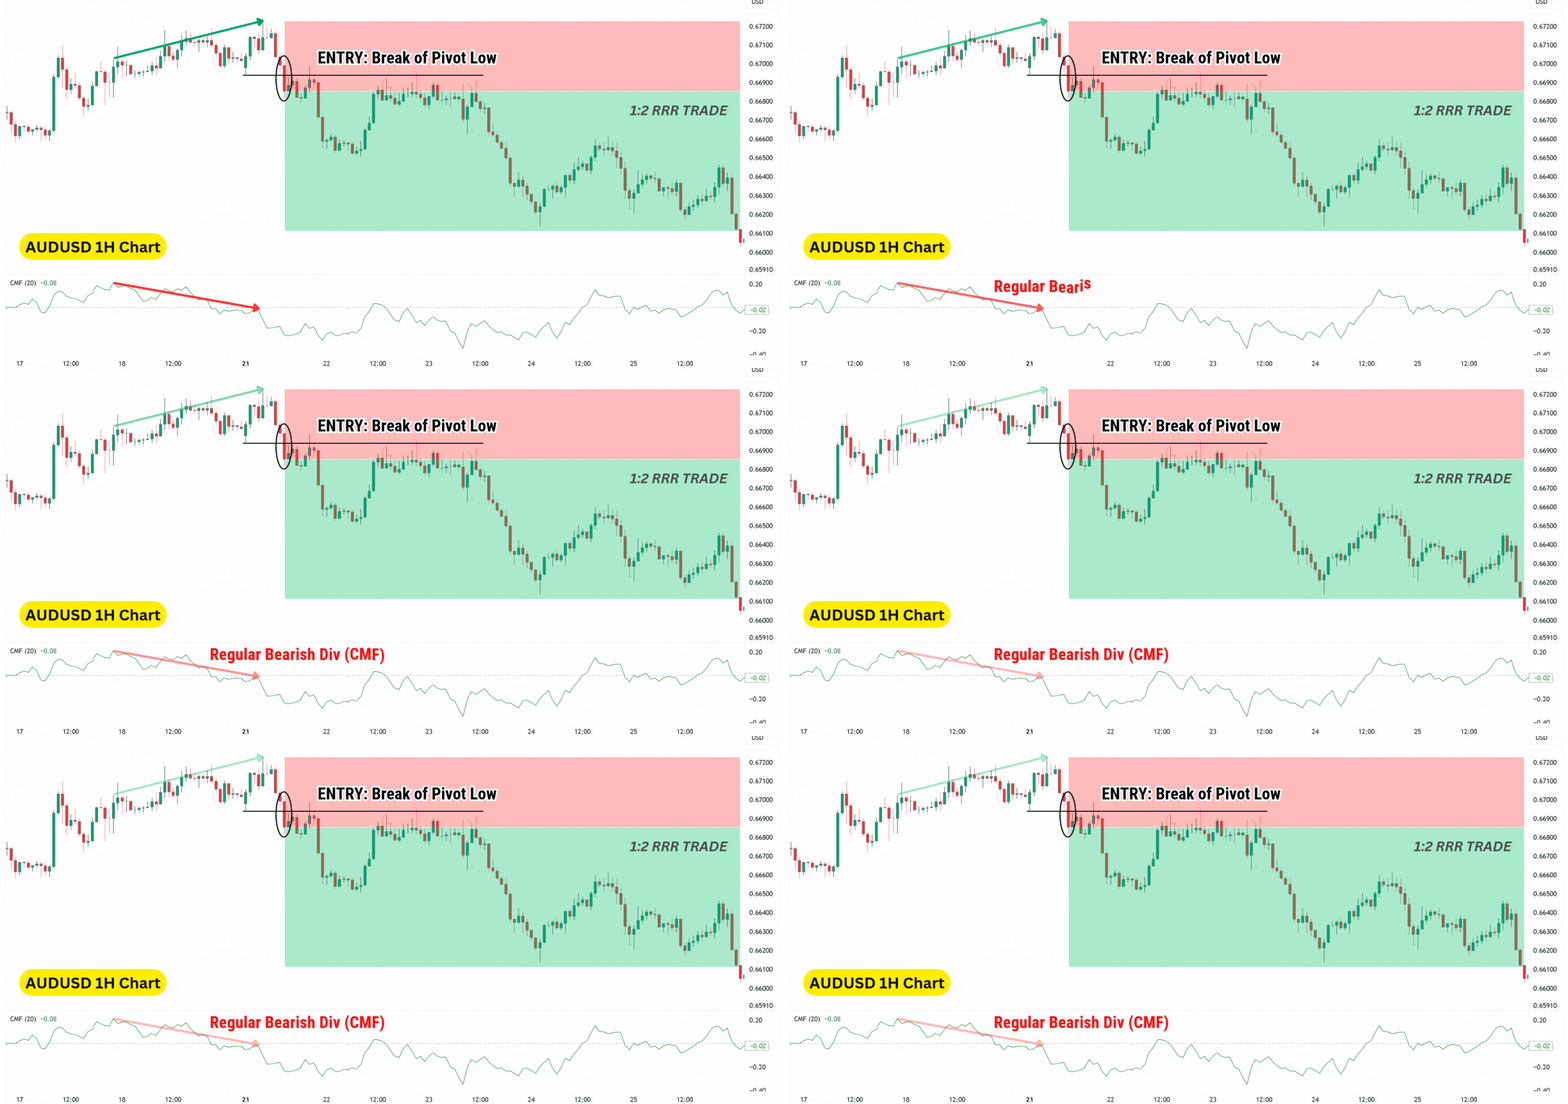
The regular bearish divergence signal becomes even more effective when the CMF moves from a positive reading to a negative one, during the formation of the divergence.
This is exactly what we see above on the AUDUSD 1H time frame chart. Then, with a break of the pivot low, we can enter a bearish reversal trade targeting 1:2 risk-to-reward, with stop loss placed at the higher high of the divergence.
Spot Bearish Divergence using Rate of Change
The Rate of Change (ROC) indicator is a momentum oscillator that measures the speed and direction of price changes. It calculates the percentage change in price between the current price and a price from a specified number of candles ago – by default, this is 9.
Unlike indicators like the Chaikin Money Flow (CMF) or On-Balance Volume (OBV), the ROC focuses solely on price movement and does not incorporate trading volume.
To find divergences using the Rate of Change indicator, we can draw from either the wicks, or the candle bodies, depending on on the calculation source you’ve chosen:
- HL3 – Draw divergences from the wicks.
- Close – Draw divergences from candle bodies / closing prices.
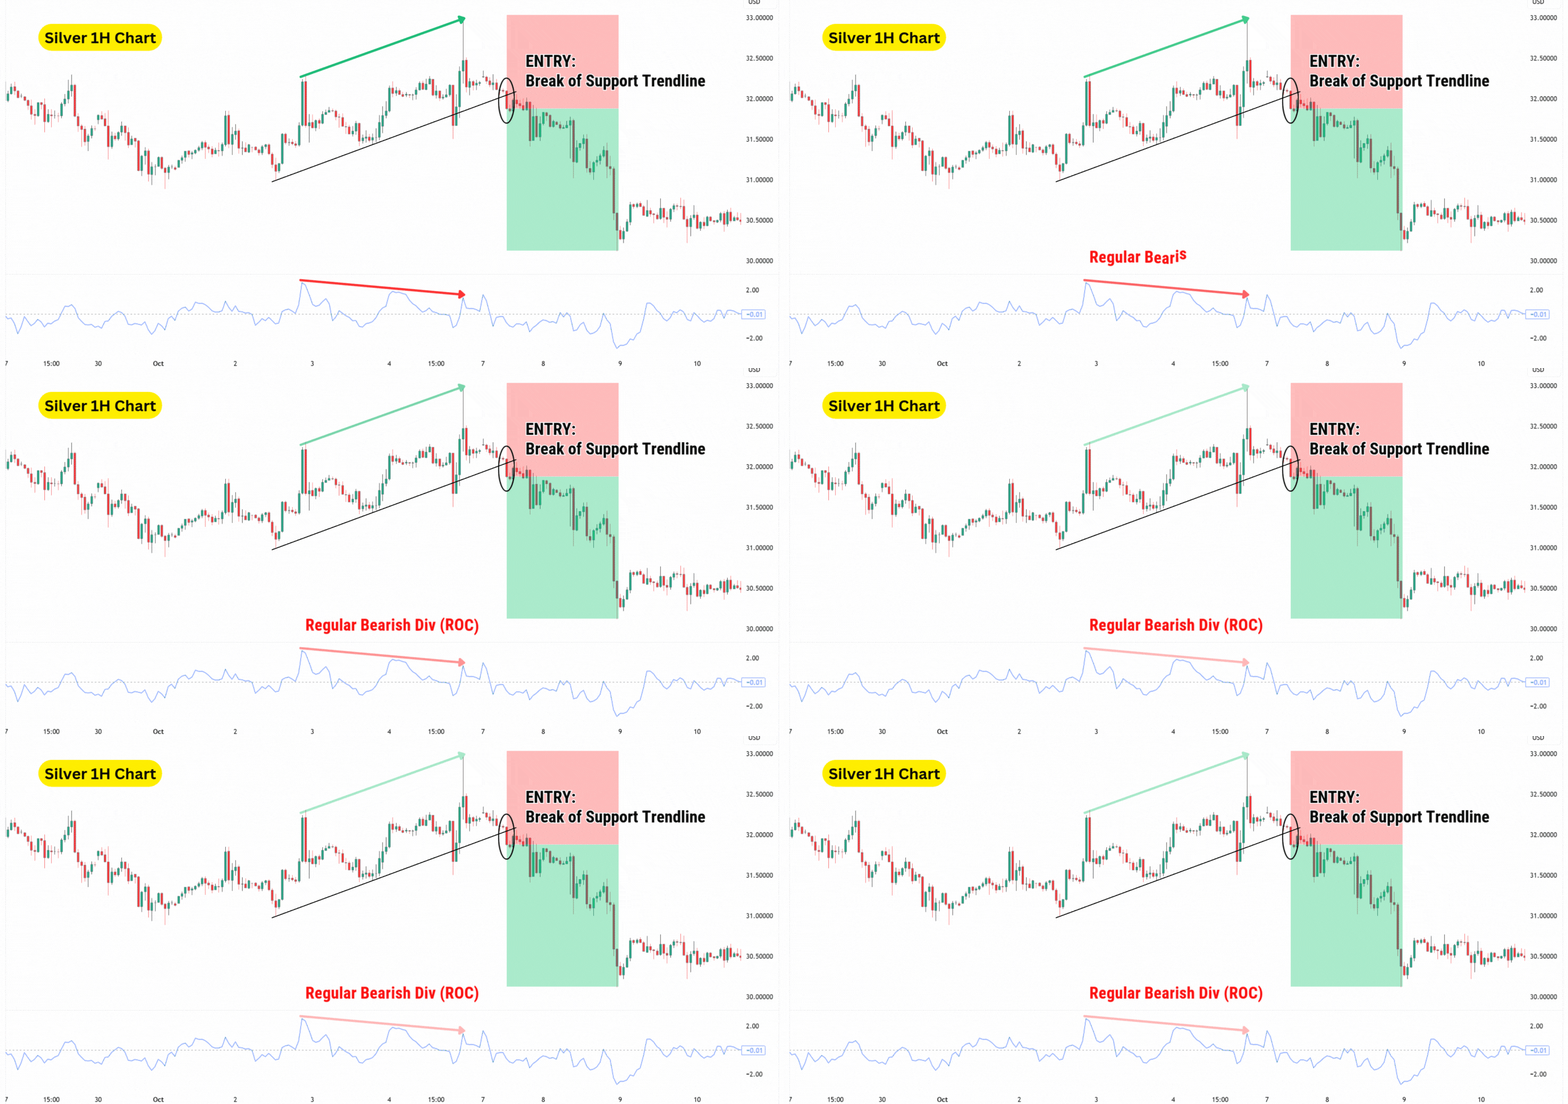
In this example above, we’re using the HL3 method to find a bearish divergence on Silver (XAG/USD) 1-Hour.
Upon the break of the support trendline, we have a confirmation signal to enter a short position, trading the price of silver down to another key support level.
Spot Bearish Divergence using Awesome Oscillator
The Awesome Oscillator (AO), despite its funky name, is a classic indicator beloved by many traders across the world.
It measures the difference between a short-term moving average (SMA-5) and a longer-term moving average (SMA-34). Unlike most moving averages, which are defaulted to calculating on closing prices, the AO uses the midpoint of each candlestick to calculate the SMAs’ values. Therefore, the wicks are automatically included in this indicator’s calculations.
As a result, spotting a bearish divergence with the Awesome Oscillator (AO) is quite similar to finding it on the MACD histogram – you want to look for a higher high with the price action, while the AO forms lower highs.
This tells us that buying momentum is slowing, and the price may begin to reverse soon. Here’s how it looks:

Then, using a trendline break and bearish flip on the AO, we can enter a short position targeting key support levels. In this case, we trade towards the 61.8% retracement level, the most important Fibonacci Retracement level.
Classes of Divergences
We mentioned earlier in the piece, in the AD Line section, that several classes of divergence can exist. These classes are categorised by their distinct shapes, and also the strength of the reversal typically associated with them.
Traders can use these divergence classes to set better expectations of where to set their take profit targets. Let’s break it down!
- Class A: The classic bearish divergence signal, where price forms a higher high, as momentum forms a lower high. Tends to be associated with larger reversals.
- Class B: A less powerful bearish divergence signal, where the price forms a double top and the momentum forms a lower high. Tends to be associated with weaker reversals.
- Class C: The weakest class of divergences, where the price forms a higher high, but the momentum forms equal highs.

Advantages of Trading on the Bearish Divergence Pattern
The bearish divergence pattern is a reliable tool for spotting potential reversals, particularly in broader downtrends. It can help traders anticipate key turning points and help capture pullbacks.
Identifies potential bearish reversals: A bearish divergence often signals that bullish momentum is weakening, offering traders an opportunity to prepare for a downward price move.
Provides exit signals for long positions: For traders in long positions, it acts as a warning to lock in profits before the trend shifts.
Compatible with most oscillators: Like the bullish divergence, it’s easy to spot and works well with commonly used tools like RSI, MACD, or Stochastics.
Disadvantages of Trading on the Bearish Divergence Pattern
Despite its advantages, bearish divergences come with their own challenges. Recognising these is key to avoiding pitfalls.
Not a guaranteed reversal signal: Prices can continue to rise even after a bearish divergence appears, which can lead to early short positions getting stopped out.
Limited impact in strong uptrends: In powerful upward trends, bearish divergences may result in only minor pullbacks rather than a full reversal.
Requires understanding of the oscillator: Each oscillator has unique mechanics, so accurately identifying divergences demands knowledge of whether to draw them from wicks or bodies.
What Indicator is Best to Trade with a Bearish Divergence Pattern?
Oscillators are ideal for identifying bearish divergences, as they visualise the changes in buying and selling pressure/momentum.
RSI, Stochastics, and W%R, can even signal overbought conditions, adding validity to a bearish reversal setup. However, oscillators without these signals can be equally effective for trading divergences, such as the MACD.
Ultimately, there is no single best choice, it all depends on your trading strategy, asset, timeframe, and even personal preference.
Bearish Divergence vs Bullish Divergence
The distinction between bearish and bullish divergences lies in the direction they forecast. A bearish divergence reveals that bullish momentum is weakening, and so the conditions for a bearish reversal are improving. In contrast, a bullish divergence suggests that bearish momentum is losing strength, signalling that a bullish reversal may be on the horizon.
Bearish Divergence vs Hidden Bearish Divergence

Regular and hidden bearish divergences serve different purposes. Understanding their role in trends is key:
Regular Bearish Divergence occurs during upswings, with the price forming higher highs and the oscillator showing lower highs. It is considered a reversal pattern.
Hidden Bearish Divergence occurs during downswings, where the price forms lower highs, but the oscillator shows higher highs. It is considered a continuation pattern.
Divergence Cheat Sheet
Use this divergence cheat sheet to identify the different divergences immediately.

FAQ
What are the common bearish divergence mistakes to watch out for?
Many traders misjudge the broader trend, as bearish divergence is more likely to result in a pullback within a strong uptrend than a full reversal. Additionally, using it on very short timeframes can lead to false signals due to choppy price action.
What is the best time frame to use for the bearish divergence pattern?
Shorter timeframes, like 1-hour, can help identify quick pullbacks but are less reliable for strong reversals. For higher accuracy, 4-hour, daily, or even weekly timeframes are better suited, as they reduce noise and highlight significant trend changes.
How does volume confirm divergence signals?
If bearish divergence forms with decreasing volume, it signals fading bullish interest, supporting the case for a potential reversal. On the other hand, bearish divergence with sustained or rising volume could indicate that the trend still has strength.
How reliable is the bearish divergence pattern?
Its reliability depends on factors like the timeframe, market conditions, and the tools used for confirmation. Bearish divergence is a strong indication of weakening momentum, but combining it with trendlines, moving averages, or resistance levels can improve its success rate.
How many types of divergence are there?
There are four main types to consider: regular bearish, regular bullish, hidden bearish, and the hidden bullish divergence. Regular divergences suggest trend reversal, while hidden divergences indicate trend continuation.
Can a bearish divergence occur in both uptrends and downtrends?
Yes, bearish divergences can occur during larger uptrends and downtrends. It is most relevant in uptrends, signalling a potential reversal or pullback. In downtrends, however, it could signal exhaustion during a retracement or consolidation phase, leading to further continuation of the broader trend.
What happens when there is divergence on the RSI?
RSI divergence suggests a momentum shift. For bearish divergence, it signals that bullish momentum is weakening, increasing the likelihood of a price drop. However, confirmation with other technical indicators is essential for accuracy.
Does MACD give false signals?
Yes, particularly during sideways or low-volatility markets, MACD can produce false signals. Pairing MACD divergence with price action analysis or other indicators, such as RSI, can help reduce the risk of acting on weak signals.


