- Quarterly Forecast
- April 3, 2026
- 11 min read
Q2 2026 Crude Oil, Silver, Gold, and Bitcoin Forecast
| Q1 2026 Performance | 2025 Calendar Year | |
| *Gold (XAUUSD) | +7.99% | +64.4% |
| *Silver (XAGUSD) | +4.87% | +146.1% |
| *Crude Oil (USOIL) | +76.92% | -20.1% |
| Copper (XCUUSD) | -0.83% | +41.6% |
| Platinum | -3.88% | +124.1% |
| *Bitcoin | -22.07% | -6.2% |
*Analysis and forecast below
Q1 2026 started off with a bang with the metals continuing their 2025 rallies into January. Then, it suddenly changed as a result of the Iran conflict. Crude oil soared and the metals reversed hard. Bitcoin continued its downtrend.
Looking ahead into Q2, crude oil prices are expected to remain stubbornly high, even if the Strait of Hormuz opens and the Iran conflict simmers down. Gold may find its footing and resume its uptrend while silver finds headwinds due to industrial demand possibly slowing down.
Crude Oil
Our Q1 2026 forecast was spot on.
On December 31, 2025 while trading at $57.40, we stated:
“It appears that crude oil may bottom in Q1 2026 and begin a multi-month and possibly multi-year rally that ultimately challenges $100 or higher.”
Crude oil did find a secondary low on January 7 at $56.59, then began its rally culminating in a spike higher in early March as the Iran conflict heated up.
The closing of the Strait of Hormuz cut off nearly 20% of the supply in the crude oil market. This sent the price of crude oil soaring to $119 within days.
As most countries are oil importers, this creates an inflationary drag on their economies. Looking out over Q2, there are a couple of road markets we are watching for clues.
First, keep in mind that with the Strait of Hormuz closed, a significant supply disruption exists that will drain any excess supply on the market.
According to Zerohedge, during the first 3 weeks of March, oil inventories have declined by 155 million barrels. Inventories include the oil on ships out in the ocean mid-transit. 211 million barrels of inventory have declined due to less oil in transit while onshore inventories have remained stable.
Refineries are also reporting a 2.6 million barrels per day decline since the beginning of the Iranian conflict.
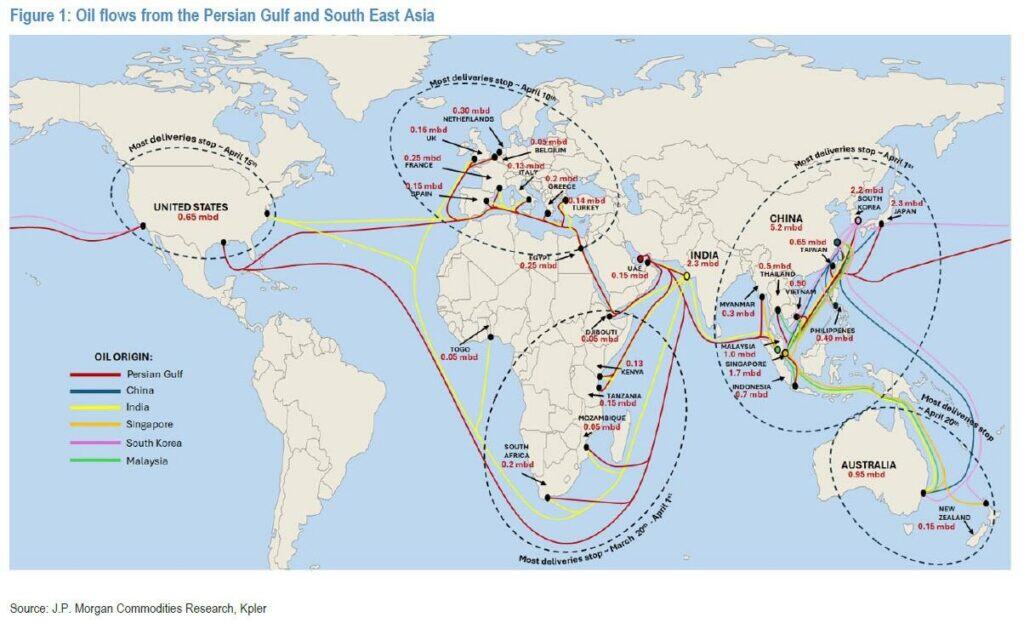
You see, just before the Strait of Hormuz was closed, there were some cargo ships that had left the area. It takes a few weeks for those ships (and oil) to reach their client destinations. Based on the timing of the closure and how many days of travel needed, it can be forecasted when certain continents will stop receiving oil deliveries. For southern Africa and east Asia, most deliveries stop around April 1. For other continents, the stoppage begins in the middle of April.
Other than higher oil prices, the effects of a real supply shortage hasn’t kicked in yet.
Second, even if the Strait of Hormuz were to be immediately re-opened, it would take time for the new shipments of oil to arrive at the refineries and out to the end user. For most places it would be a 4-8 week lag until the oil arrives.
Third, though a reopening of the strait may cause a spike down in crude oil, we believe this lower pricing would be temporary. You see, this current supply shock and its ultimate effect on the supply chain will likely be felt for a couple of quarters AFTER the strait reopens. This means stubbornly high crude oil prices and drag on the worldwide economies.
As a result, a retest of the $119 high and possible break above $130 and $150 is possible given these conditions.
One event we are keenly watching is the meeting between US President Trump and Chinese President Xi. This meeting was originally scheduled for March 31 – April 2. However, it was delayed due to the ongoing Iran conflict. The reschedule date of the meeting has not been confirmed, though the tentative timeline is in the middle of May. When the date of this meeting is announced and if the meeting actually takes place, then it may signal the Iran conflict may be simmering down.
When the conflict begins to simmer down, I’m looking for the dip in crude oil prices to provide another bullish setup as the supply chain disruption of the strait closure continues.
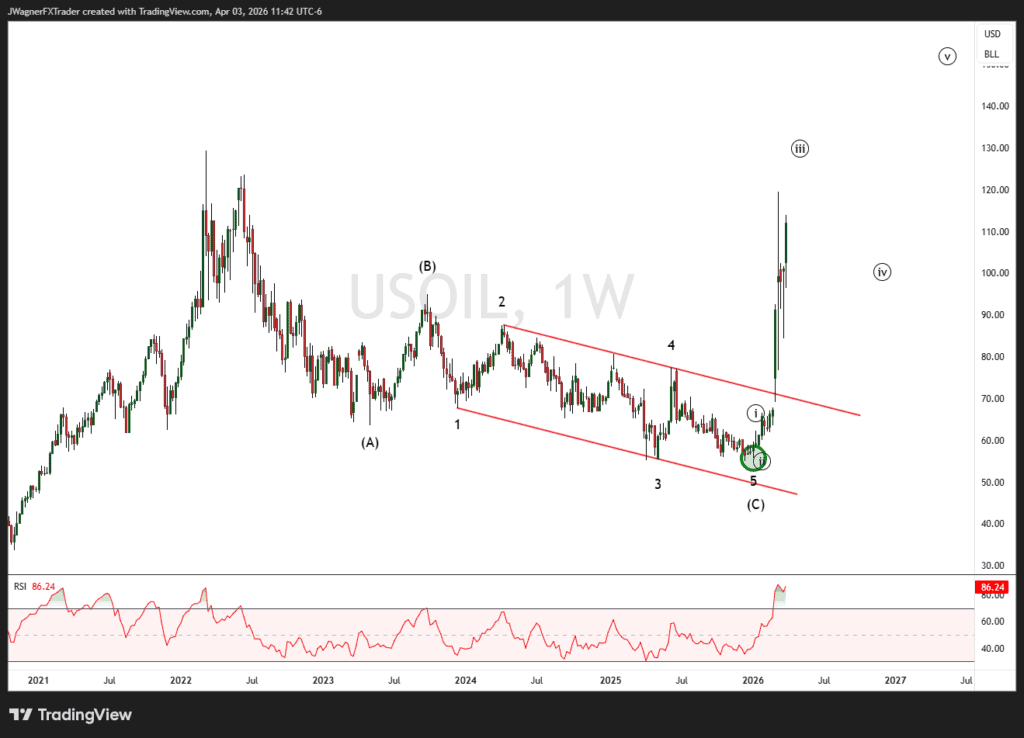
Current support for crude oil is $76 and that support may be felt as low as $67.
The Elliott wave chart suggests the current rally is reaching the latter stages of wave ((iii)). Then, a decline in wave ((iv)) that retreats back into the congestion zone for the month of March. Then, wave ((v)) to even higher levels.
Gold Forecast
From a longer term perspective (over several years), the Elliott wave pattern is incomplete to the upside suggesting new highs may eventually be seen above $5600. However, that rally stopped and outright reversed when the Iran conflict began.
Prior to the conflict erupting, we did anticipate a large decline. Our Q1 2026 forecast was anticipating a top in wave 3 that leads to a wave 4 consolidation. In the Q1 report, we anticipated that wave 4 may find support in the 3,800-4,200 price range. Gold reached a low of 4,099 in March.
Why did gold decline abruptly? The higher energy prices (from oil) is putting central banks’ reserve management under stress. Gold is an easy piece of collateral central banks can use to manage their reserves.
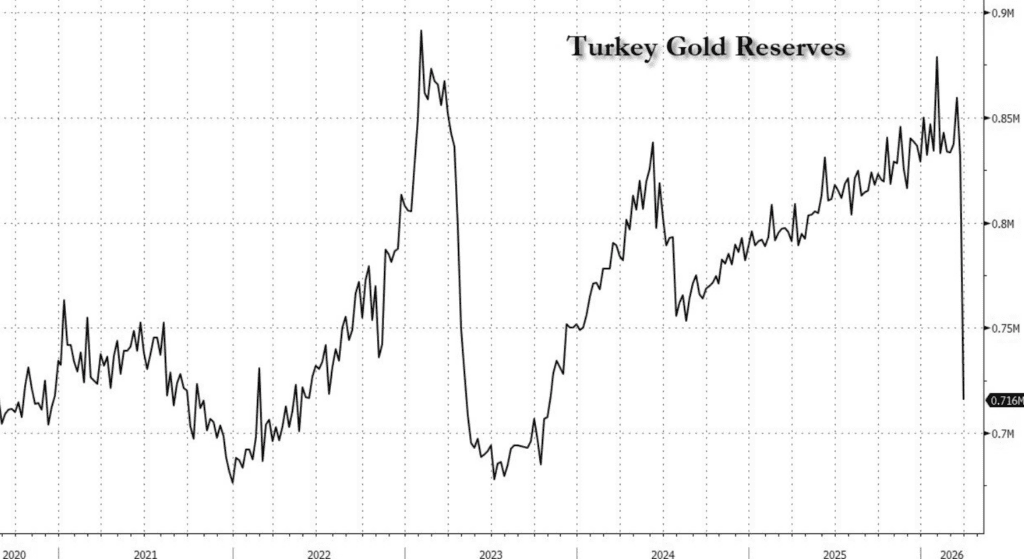
Source: Twitter (zerohedge)
It was discovered in the last part of March that Turkey ‘sold’ 120 tons of gold ($20 billion). Turkey is a more notable story as they have a disinflation strategy – meaning the currency isn’t allowed to depreciate at the rate faster than monthly inflation. This means Turkey needs to intervene within its currency to keep it from depreciating too fast.
The price shock of oil is at play because Turkey needs to import most of its oil and gas. High input costs for energy can create Turkish inflation making it difficult for officials to maintain their ‘disinflation’ strategy. Turkey likely needs USD to manage its trade balance. Where does it get these USDs?
War makes cash needs more urgent than buying gold bullion. As the central bank puts the gold as collateral on a USD loan, the counterparty likely shorts the gold market as a hedge. Therefore, billions of shorts entered the market pushing gold pricing lower which then impacts other participants who may be long and levered.
Is this situation in Turkey over? Do other central banks may need to make FX swaps to manage their reserves too which has suppressed gold’s price. We can’t say for sure. Turkey still has gold left in its coffers, so its possible there is more to come.
We now know that gold topped in wave 3 on January 29. So far, the low for gold was priced at $4,099 on March 23.
The big picture to remember for gold is that this Q1 decline was all or part of wave 4 of a larger 5 wave bullish sequence. This implies we’ll eventually see new highs above $5,600 in the coming quarters.
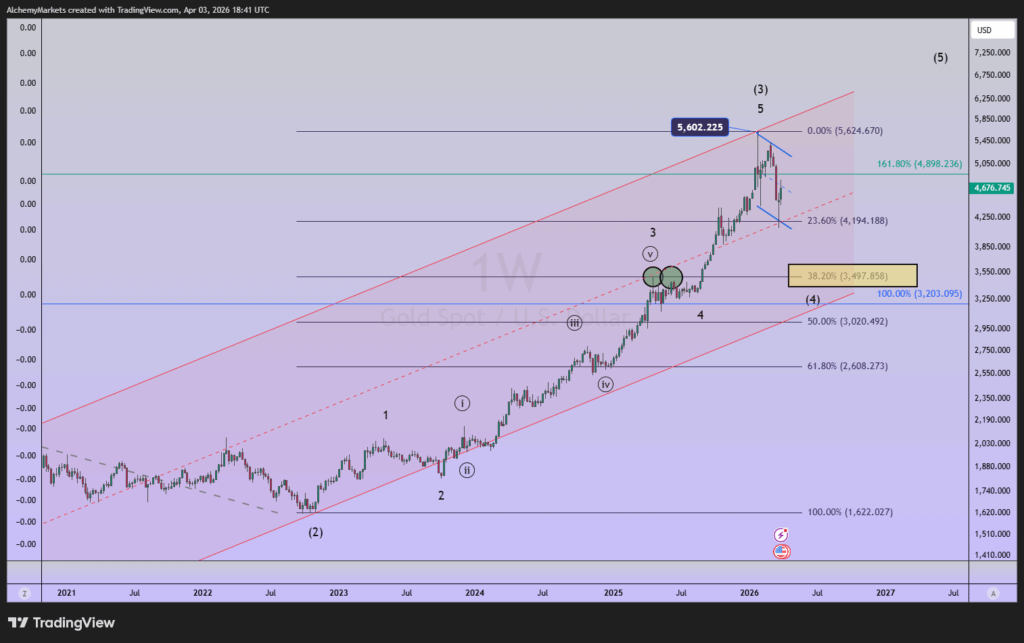
The first model suggests that the stress of central banks needing to manage their reserves. As a result, wave ‘4’ is still ongoing and may dig a little deeper. Down near $3500 – 3,600 is where gold value may be found as wave relationships appear there.
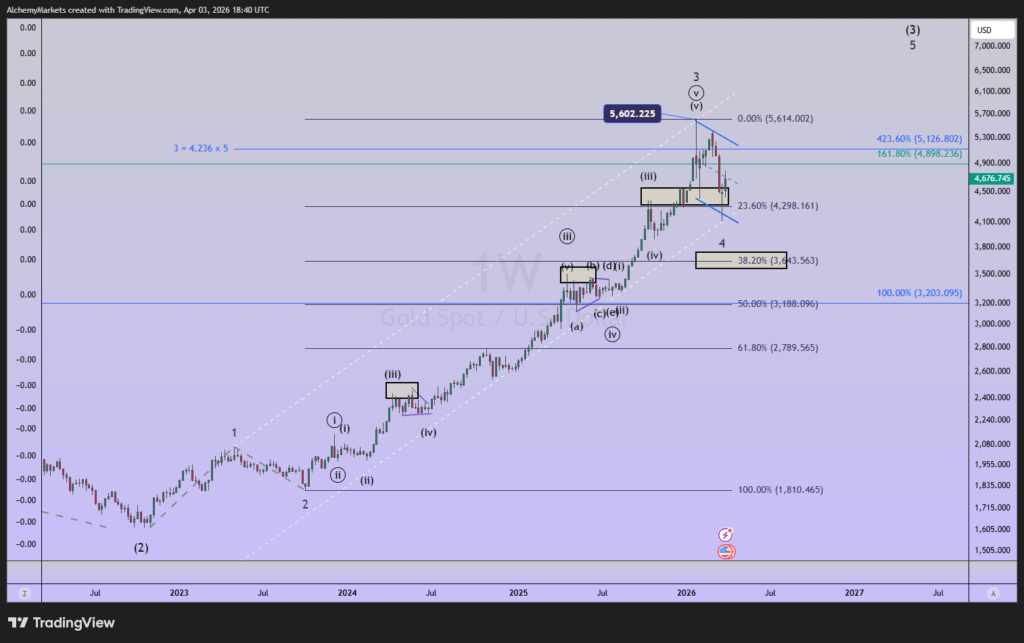
We also can see the minimum waves in place for wave 4 to be completed and a rally in wave 5. I am not certain of the odds for each model. $5,000 is a price zone, if broken, would lean more towards wave 5 is currently underway.
Therefore, if gold holds below $5,000, then be mindful of another dip that could dig as low as $3,600.
Silver
Silver enters Q2 2026 with a supportive medium-term fundamental backdrop but a more complex near-term macro setup. The key bullish anchor remains the persistent physical market deficit: the Silver Institute expects the global silver market to post a sixth consecutive annual deficit in 2026, at roughly 67 million ounces, even as total supply rises to a decade high of 1.05 billion ounces. That keeps the market dependent on above-ground inventory drawdowns and reinforces the idea that silver is not yet in a comfortably balanced regime.
Additionally, geopolitical instability tends to support investor demand for hard assets and precious metals. However, higher silver prices could create demand destruction. Also, higher oil and transport costs can pressure industrial margins, slow activity, and reduce cyclical demand. That makes silver more nuanced than gold in a geopolitical crisis: geopolitical stress is generally bullish for investor interest, but not automatically bullish for industrial side demand.
Silver Elliott Wave Analysis
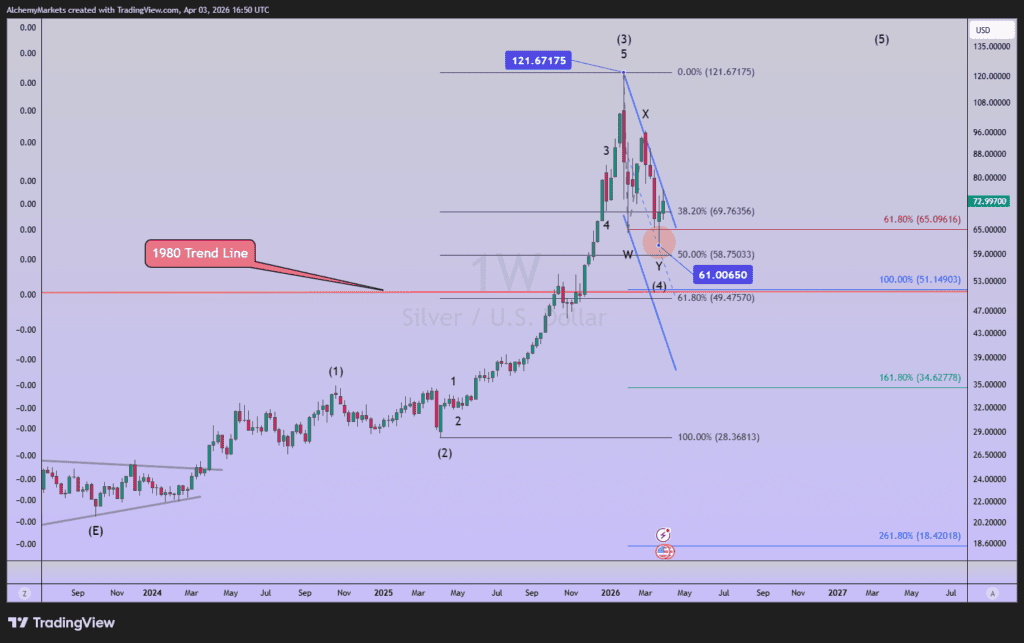
Silver’s monster rally continued through January, then abruptly reversed. The extreme rally is indicative of a major top and a stronger decline or consolidation is likely needed to fully correct the all-time high.
After topping at $121, silver has corrected nearly 50% to March’s low of $61. This correction is viewed as wave (4). Oftentimes, in an extended 3rd wave, the 4th wave will retrace a Fibonacci 38% the length of wave (3). The current decline has surpassed that amount. Plus, we can count the minimum waves in place to consider wave (4) complete.
The structure of the rally since March will provide a clue if indeed the low is in place. Right now, we don’t have enough evidence to show the new rally is forming a bullish impulse for (5). As a result, the rally from the March low could be the start of wave (5) or a continuation of an incomplete wave (4).
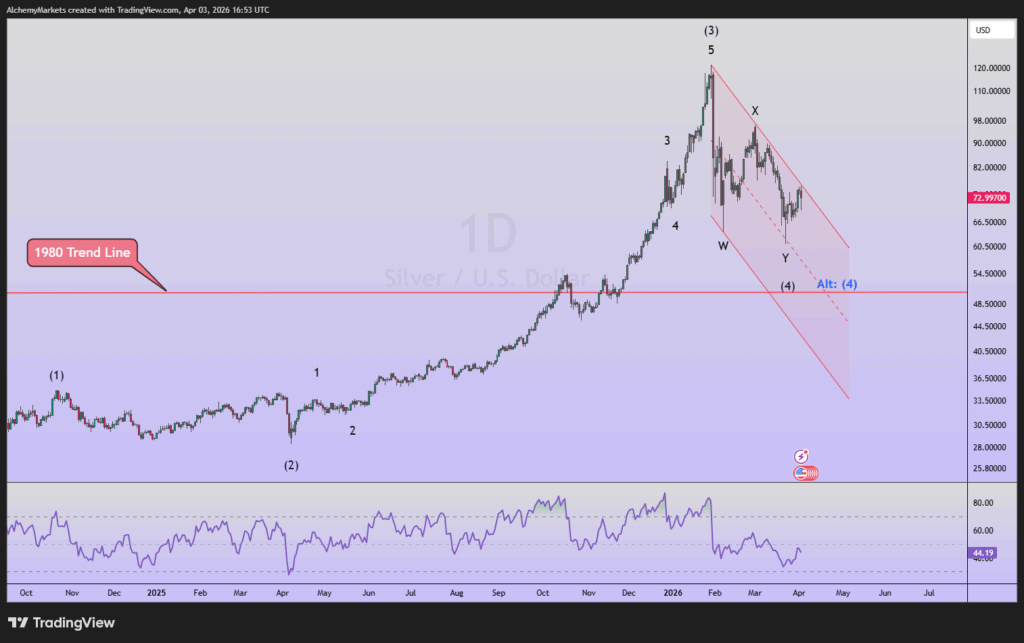
Dialing down to a daily chart, we can see silver prices have yet to break higher out of this downward sloping price channel. The inability to break higher out of the price channel will keep pressure on prices to the downside.
Bottom line, wave (4) may be incomplete and require one more poke lower to near $51-58 before starting wave (5). If silver completes a bullish impulse pattern from the March low that presses higher outside of the price channel, then we’ll consider wave (5) has begun and is rallying to new all-time highs.
Bitcoin Forecast (Digital Gold)
Our Q1 2026 forecast was spot on as we were tracking the potential for a significant decline in Bitcoin. The main Elliott wave count we are tracking calls for an additional decline to $49k and possibly lower levels. There is an alternate count that suggests the current decline was wave (4) and wave (5) to new highs is about to begin. Let’s explore both.
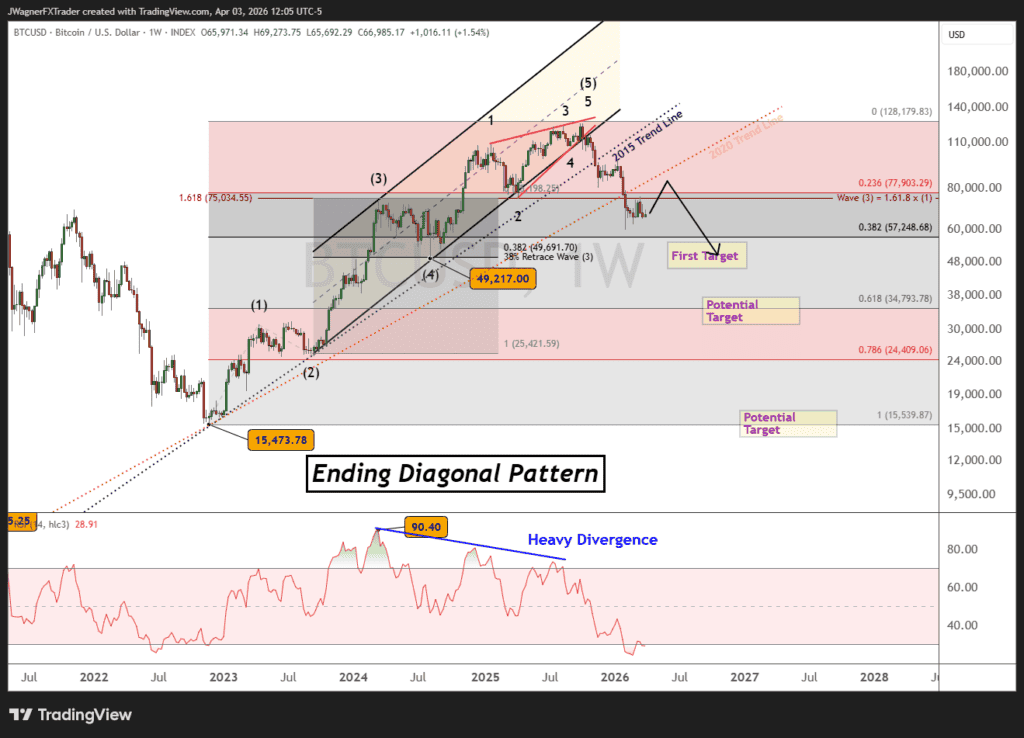
The main Elliott wave count suggests that an important and long-term top formed in October 2026. This count calls for a decline down to $49k, the origination of the ending diagonal pattern. It is important to keep in mind that even lower levels are possible like $35k and even $15k.
If the 2022 rally is a completed Elliott wave impulse pattern, then wave (5) of the impulse can be counted as an ending diagonal or rising wedge. These patterns tend to be completely retraced leading to a decline back to $49,217.
Most of the damage has been done with the current trend low at $60,132. However, the rally does not appear to be motive and hints that another low is around the corner. Perhaps some seasonality may push Bitcoin up to the underside of the 2020 trend line ($85-90k) but it doesn’t have to.
Once the countertrend bounce is complete (likely in Q2 2026), then this Elliott wave model suggests another decline towards the $49k target or lower levels.
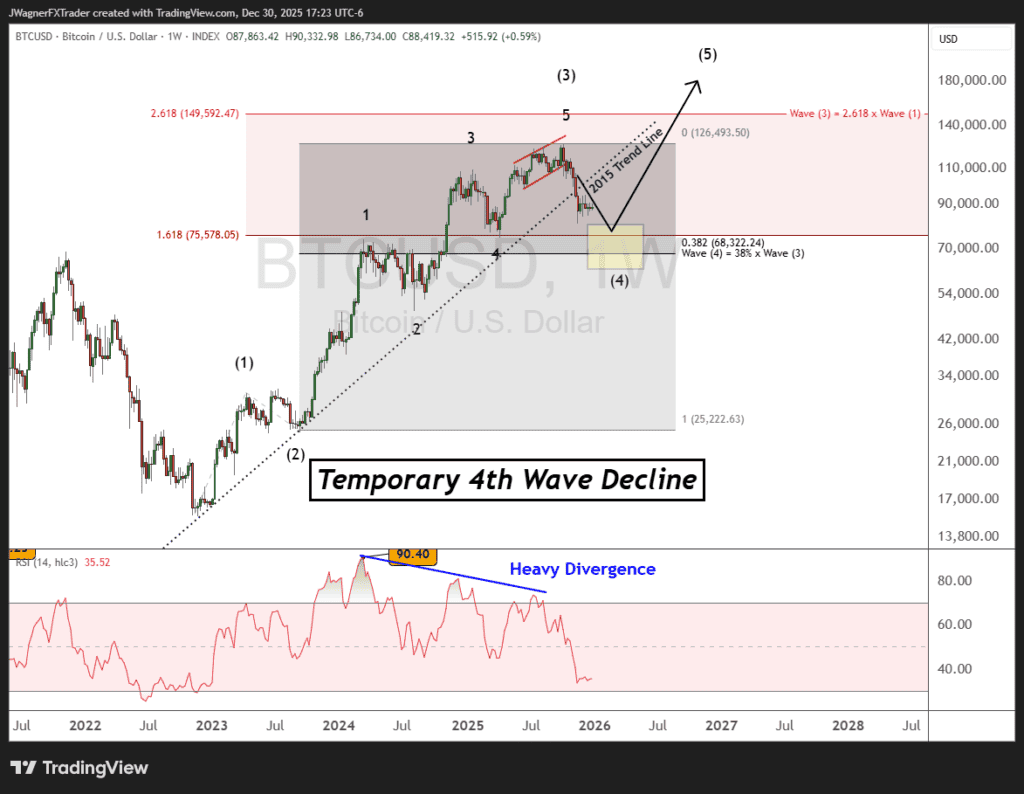
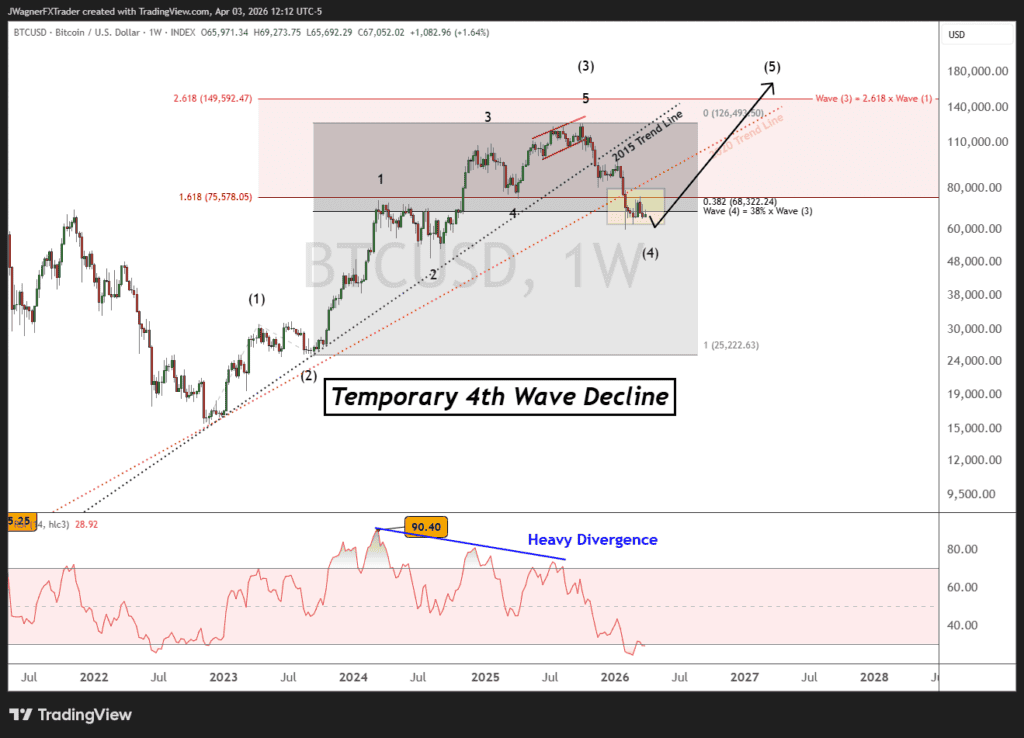
There is a secondary alternate pattern that we are following that calls for Bitcoin prices to stabilize near current levels where the 38% Fibonacci retracement sits. For this count to get moved to higher probability, I’d like to see a quick jolt to new lows then an immediate burst higher with an impulsive structure.
However, this wave count is relegated to a lower probability because the heavy RSI divergence appearing at the end of wave (3) is not typical. Oftentimes, the end of wave (3) would see a high RSI value. Additionally, wave 4 is much longer and time and deeper in price relative to its cousin wave, wave (2).
However, this wave count does not break any of Elliott’s rules, so we’ll keep an eye on it. I’m not a huge fan of this count but we’ll keep it in mind.
Bottom line, it appears the decline in Bitcoin is not complete and further losses may appear down the road. There may be a temporary bounce in the first part of Q1 2026, followed by the decline to new lows later on in Q1.
If Bitcoin pushes above $95k, then we may consider the alternative count with new highs on the horizon.