
- Quarterly Forecast
- December 31, 2024
- 7 min read
Q1 2025 Forex Forecast: US Dollar Looking For A Top
2025 is upon us and we take a look into what the price patterns may suggest regarding some key forex trends in Q1. We use Elliott Wave Theory as a basis for these forecasts. We’ll analyse the current patterns, see where we are at within those patterns, and anticipated trends for the first part of 2025.
DXY
From September 2024 to December 2024, the Fed cut the target interest rate 100 basis points. Looking out into 2025, the aggressiveness of Fed rate cuts is expected to take on a much slower pace. The first rate cut of 25 basis points is expected in March 2025. The next cut isn’t expected until December 2025 with a total of 50 bp cut for the 2025 calendar year.
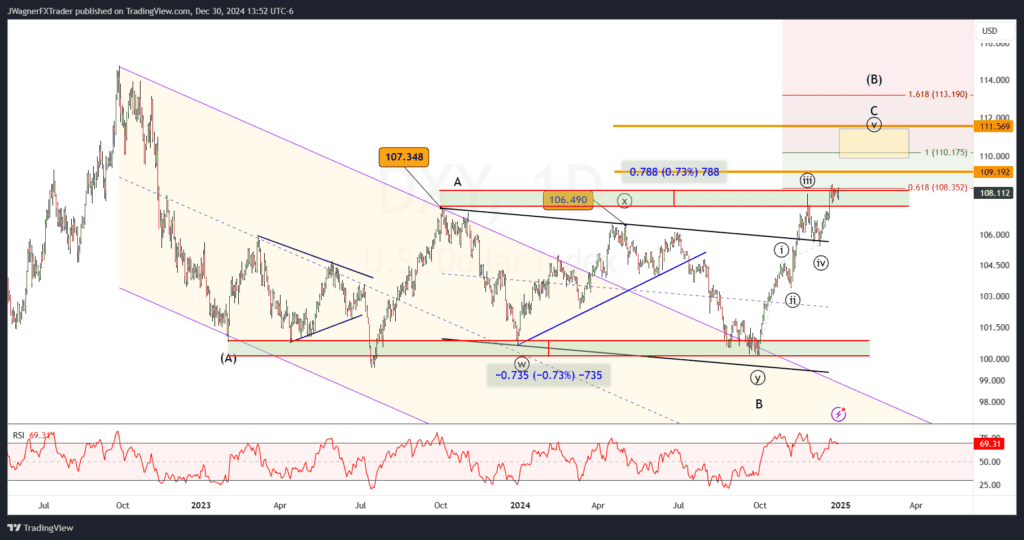
This has kept the US Dollar trading in strong fashion. Couple this with positive seasonalities as January tends to be the strongest month for DXY. This suggests we’ll see continued strength for DXY in the early parts of Q1.
The Elliott wave count suggests we are in wave ((v)) of C of (B). Some upside targets include 110-111. If DXY is successful in reaching those upside targets, then DXY will be at risk of a very strong bearish reversal.
Bottom line, we are anticipating a continued bull trend up to 110-111 in Q1. Then, a larger bearish reversal that likely pushes DXY to below 100 over the next several years.
EURUSD
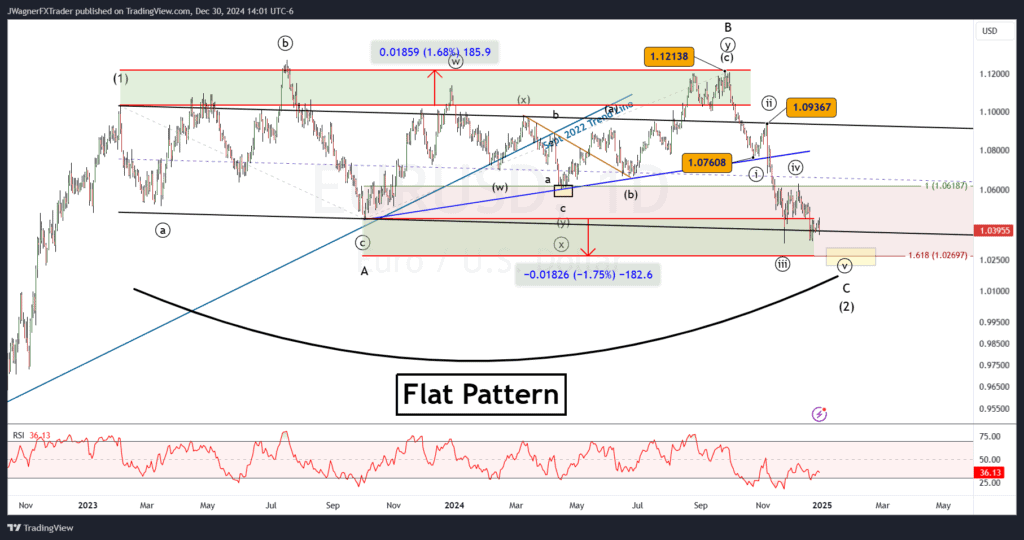
EURUSD is putting the finishing touches of a multi-year flat pattern that also includes a double top from 2023 and 2024. The pattern appears to be in the final wave at two-different degrees of trend. Therefore, sentiment against EUR is likely to get ugly while endless gains for US Dollar will be on most people’s minds. It is at just that time when a large degree trend reversal appears and when prices reverse from a downtrend to an uptrend.
We are showing some wave relationships down near 1.0220-1.0270. Lower levels are possible, but this downtrend is approaching its end.
Once the bear trend is over, then a new bull trend would rival the distance of the 2022 rally and could be 1500+ pips.
GBPUSD
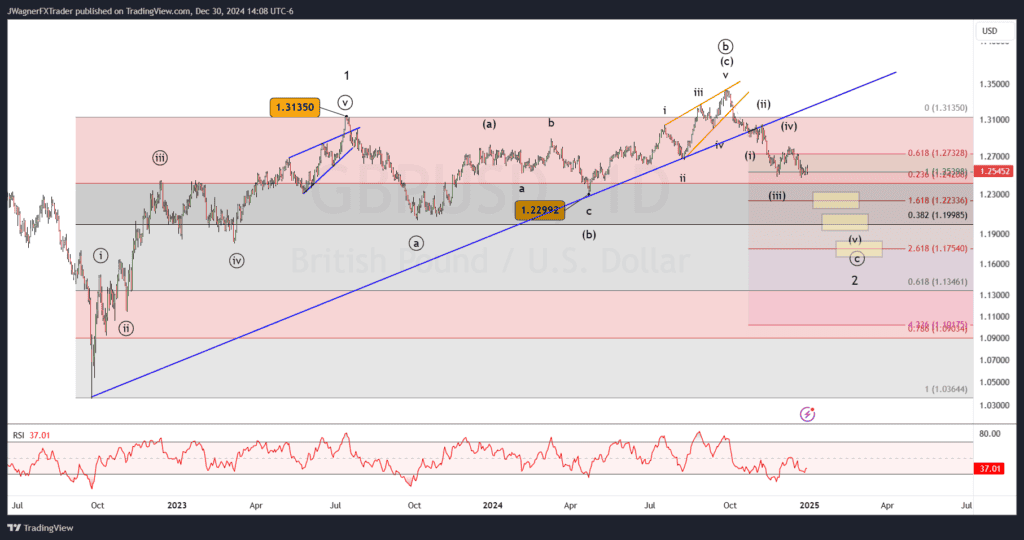
Similar to EURUSD, Cable appears to be carving a large flat pattern that began July 2023. It appears we are currently in wave (v) of ((c)) of 2. This means we are in the terminal wave at two degrees of trend for this flat pattern.
As a result, lower prices in wave (v) are likely to revisit 1.2330, and possibly 1.2037 or 1.17-1.18. Once the lower pricing is established, then GBPUSD is likely to rally in broad based USD weakness.
USDJPY
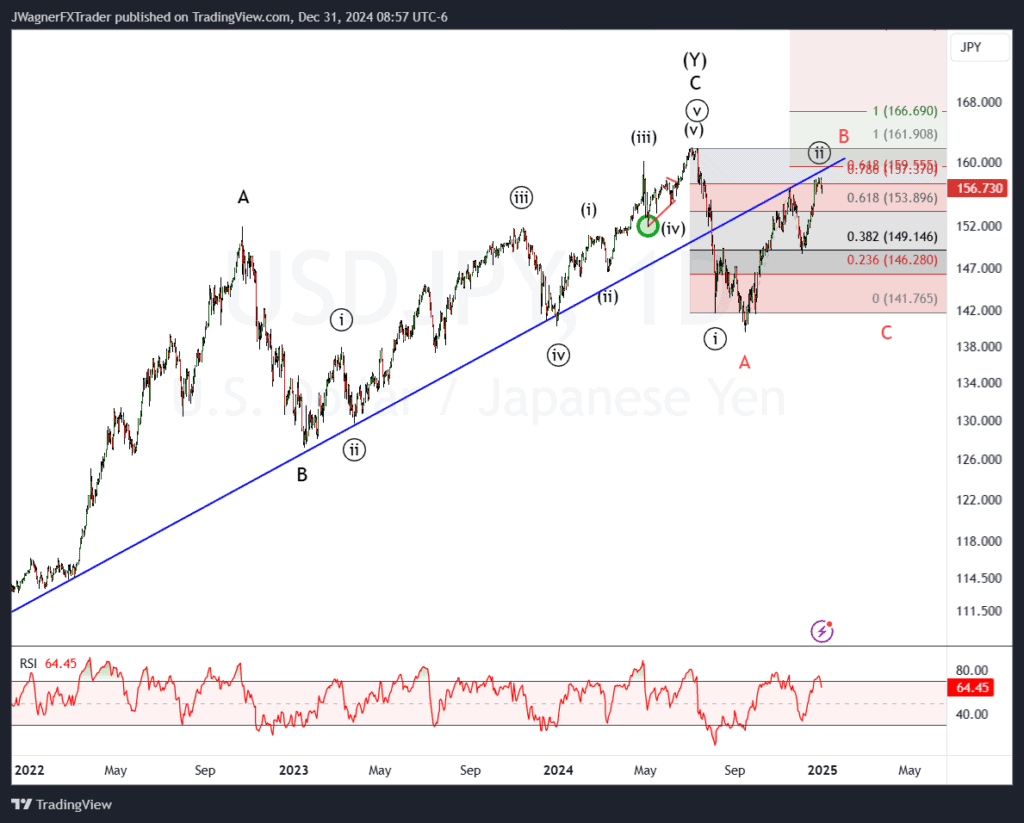
We believe an important top was reached for USDJPY in July 2024. That top, in our opinion, marks the end of a double zigzag rally. This means a significant downward retracement is underway.
So far, the September low has only minimally corrected and retraced the previous rally. Therefore, we are watching for two different scenarios to unfold.
- A deeper downward retracement to correct more price
- A longer sideways range to correct more time
The first pattern (black labels above) implies USDJPY is about to turn lower in Q1 to retest the 140 low. There are some wave relationships at 136, though deeper levels are possible.
The second pattern (red labels above) suggests a sideways triangle pattern. The recent Q4 rally is wave ‘B’ of the triangle. The next wave, wave ‘C’, will likely carry USDJPY down to near 146. Under the triangle scenario, USDJPY could continue to rally and perhaps make a new high (not required), but that it would be a temporary high.
I have my eye on the blue trend line as prices are retesting the bottom side of it with a bearish reversal likely appearing near the trend line.
AUDUSD
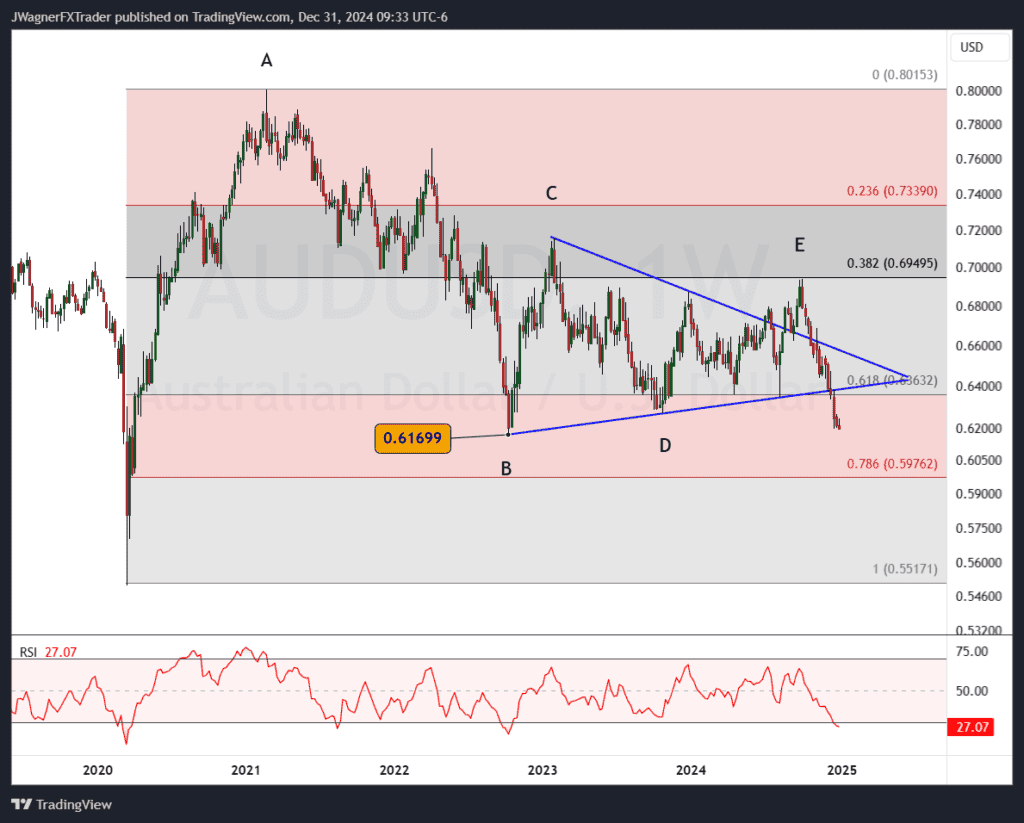
Aussie is breaking lower out of a symmetrical triangle. The pattern appears to be incomplete with further downside available. A break below .6169 will confirm the end of the triangle pattern and open the door for lower levels. We are anticipating most of Q1 to cover an additional decline that retests 55 cents.
It appears we are in the early stages of the decline as we watch for five waves to unfold from the September 2024 high. Currently, we appear to be in the middle stages of wave (iii).
Bottom line, anticipate Q1 to include further declines that a potential retest of the 2020 low at 55 cents.
EURGBP
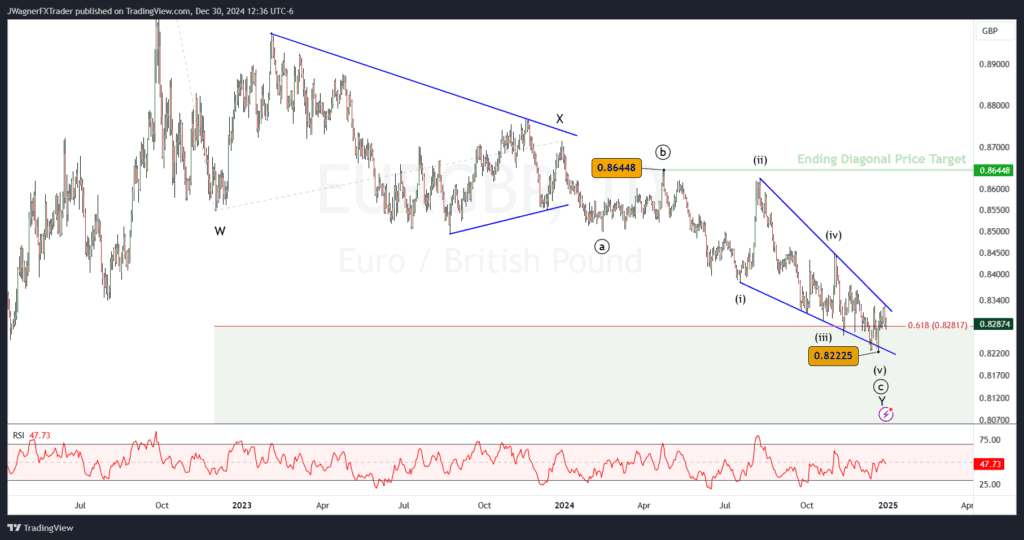
Though many people focus on the USD pairs, I’m not convinced that Q1 2025 will be purely a US dollar based trend. Looking at EURGBP, an ending diagonal, or falling wedge pattern, appears to be shaping into the December 2024 low.
Ending diagonals are an Elliott wave pattern that signals the end to that wave pattern. In this case, the ending diagonal is the final wave to a larger zigzag pattern. Under such a scenario, there is a strong likelihood that EURGBP rallies from the .8223 low up to the origination of the pattern at .8645.
Look for a bullish break of the (ii)-(iv) blue resistance trend line to be the kickoff to the new bullish trend. What’s more important to glean from this bullish pattern is that if it plays out as expected, EUR is anticipated to be an outperforming currency OR GBP becomes an underperforming currency.
Notice on my EURUSD and GBPUSD forecasts how GBPUSD has downside targets further away. GBPUSD may need to decline further to finish its flat pattern where as EURUSD may end its pattern sooner.
Keep this EURGBP market in mind as you trade the larger trends of EURUSD, GBPUSD, EURJPY, or GBPJPY.
EURJPY
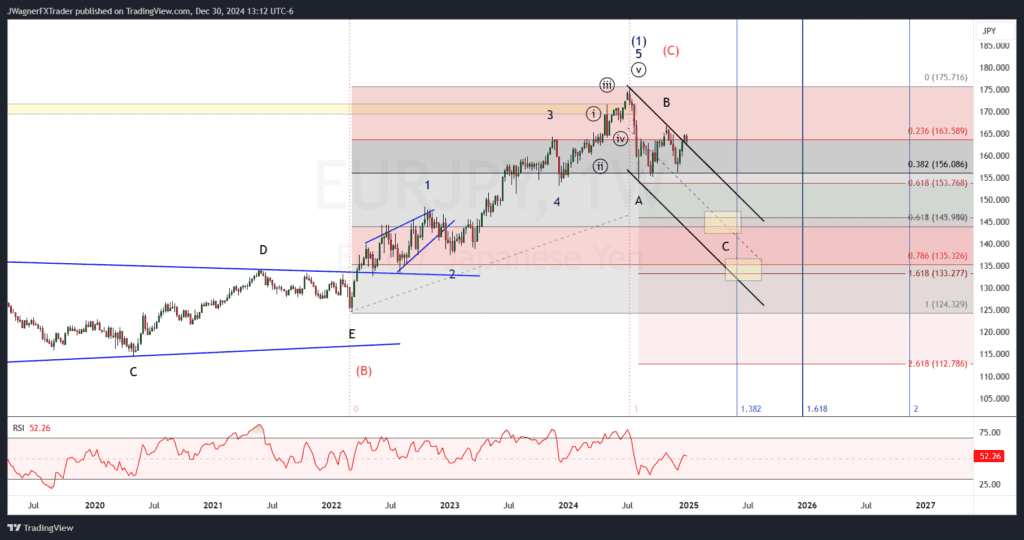
In Q3 2024, EURJPY appears to have completed a 2-year long impulse pattern. If this is correct, then a long corrective dip is underway.
Many times, the correction to the impulse is equal in time or has Fibonacci proportions to the time taken to carve the impulse. Mapping this sequence on EURJPY, this implies a larger downtrend in force that carries through most of Q2 2025, if not longer.
With corrective pressure remaining for several months, I suspect we’ll see EURJPY punch below the August 2024 price low. As a result, I’m anticipating the decline from the 2024 high to be an A-B-C zigzag decline. Waves A & B appear in place. Wave C is in the early stages of its decline with downside targets including 143-146 and 133-135.
If EURJPY continues to rally, then we’ll consider wave B incomplete and still developing.
GBPJPY
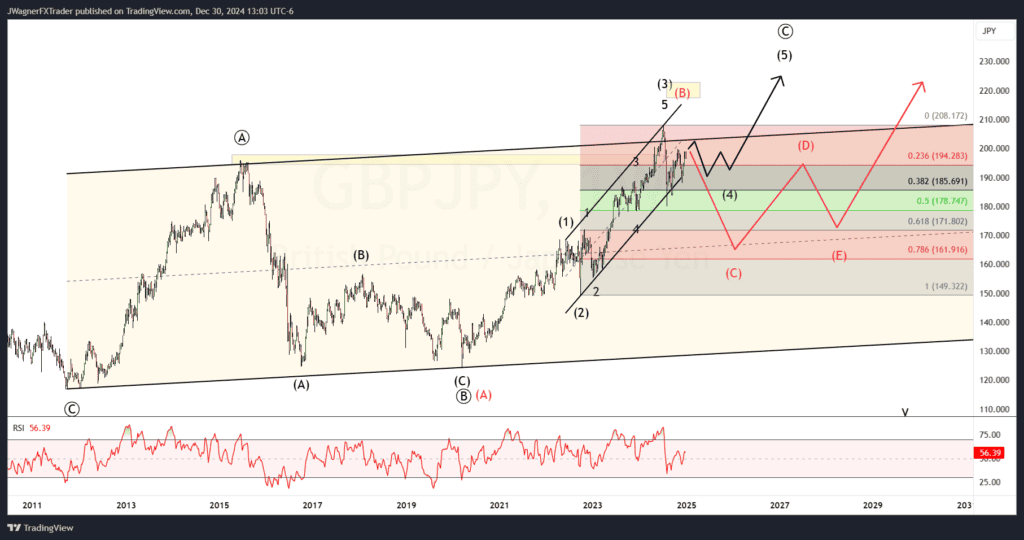
When GBPJPY poked a new high in 2024 above the 2015 high, this limits the options to wave counts.
The new high is part of an ongoing c-wave of a zigzag. The high in 2024 is viewed as wave (3) of ((C)). This means GBPJPY is correcting lower and sideways in wave (4) of ((C)). A common pattern to find in the 4th wave position is a triangle and that could be the case here. The depth of wave (4) has satisfied the minimum expectations reaching the previous wave 4 of (3) and 38.2% Fibonacci retracement of wave (3).
Therefore, if GBPJPY breaks higher above 210, then it would suggest a wave (4) triangle. Under this scenario, GBPJPY may take up most of Q1 and possibly Q2 sloping back and forth in the triangle pattern.
The other main wave count under consideration is that the 2024 high is a larger ((B)) wave high (see red labels on the chart). If this is the pattern, then GBPJPY would dig into lower levels likely below 170 in wave ((C)) of a larger triangle pattern.
We can’t glean too much information from the GBPJPY singularly, except that rallies are likely muted over the course of Q1. If prices fall hard below the August 2024 low, then the red labels are the dominant path.
If GBPJPY grinds sideways making little progress, then the black labels are favored.
See our other Q1 2025 forecasts:


