
- Quarterly Forecast
- December 30, 2024
- 7 min read
Q1 2025 Commodities Forecast: Energy Markets Diverge Sharply
As we step into a new year and the first quarter of 2025, the commodities markets paint a picture of mixed trajectories. While Gold and Silver rides high with economic uncertainty, the oil markets face the potential issue of oversupply. Meanwhile, natural gas emerges as a promising outlier, offering a bullish outlook amidst the energy market.
Gold (XAU/USD) Q1 2025 Analysis
Since the start of 2024, gold has experienced an impressive rally, reaching a new all-time high of $2,789.59, driven by anticipated rate cuts from the Federal Reserve throughout the year. However, recent hawkish shifts in the Fed’s outlook have raised questions about how gold will react moving forward in Q1, 2025.
The likelihood of rate cuts from other major central banks, such as the European Central Bank (ECB) and the Bank of Canada, could make the US Dollar a more appealing asset in Q1, potentially applying downward pressure on gold.
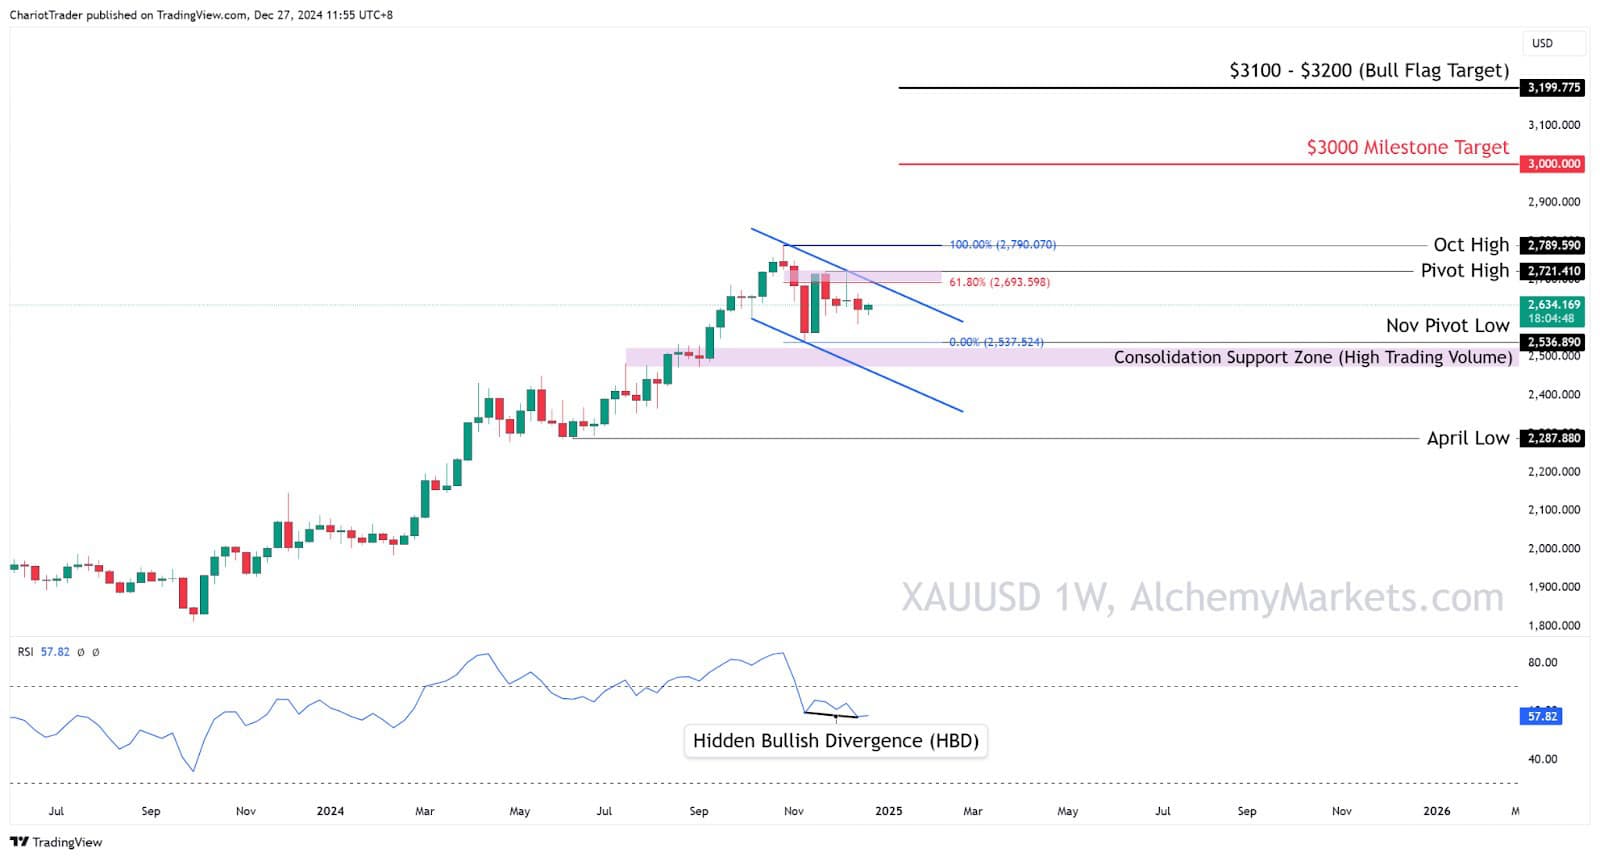
On a technical analysis level, Gold could be consolidating within a weekly bull flag, which is a trend continuation pattern. This comes in conjunction with a small hidden bullish divergence, dating back to November.
As of now, the Nov Pivot Low at $2,536.890 acts as the lowest low in a weekly hidden bullish divergence – this level must first be broken (on a weekly timeframe) for us to a further drop towards the downside.
However, that may prove difficult as it sits right above a Consolidation Support Zone, ranging from $2,475 – $2,525.
- Watch for a break and close above the bull flag’s upper trendline and pivot high, which aligns with a 61.80% Fib Retracement.
- October 2024’s High at $2,789.590, also the current All-Time High, could provide some major resistance.
- A break above Oct High could send Gold towards the $3,000 mark, a major psychological milestone.
| Overall, we remain bullish on Gold in Q1, possibly tapping into $2,475 – $2,525 first, then continuing its bullish trend. |
Silver (XAG/USD) Q1 2025 Analysis
Silver’s industrial use is expected to grow significantly as renewable energy projects expand globally. Additionally, investment in silver ETFs continues to rise, reflecting growing confidence in its long-term potential.
On the technical side, the Relative Strength Index (RSI) shows a battle of divergences between a classic bearish divergence, and a hidden bullish divergence on the weekly timeframe. Silver is currently trading at $29.70 after tapping into the 61.80% Golden Fib Level at $29.40, increasing its likelihood of bullish continuation.
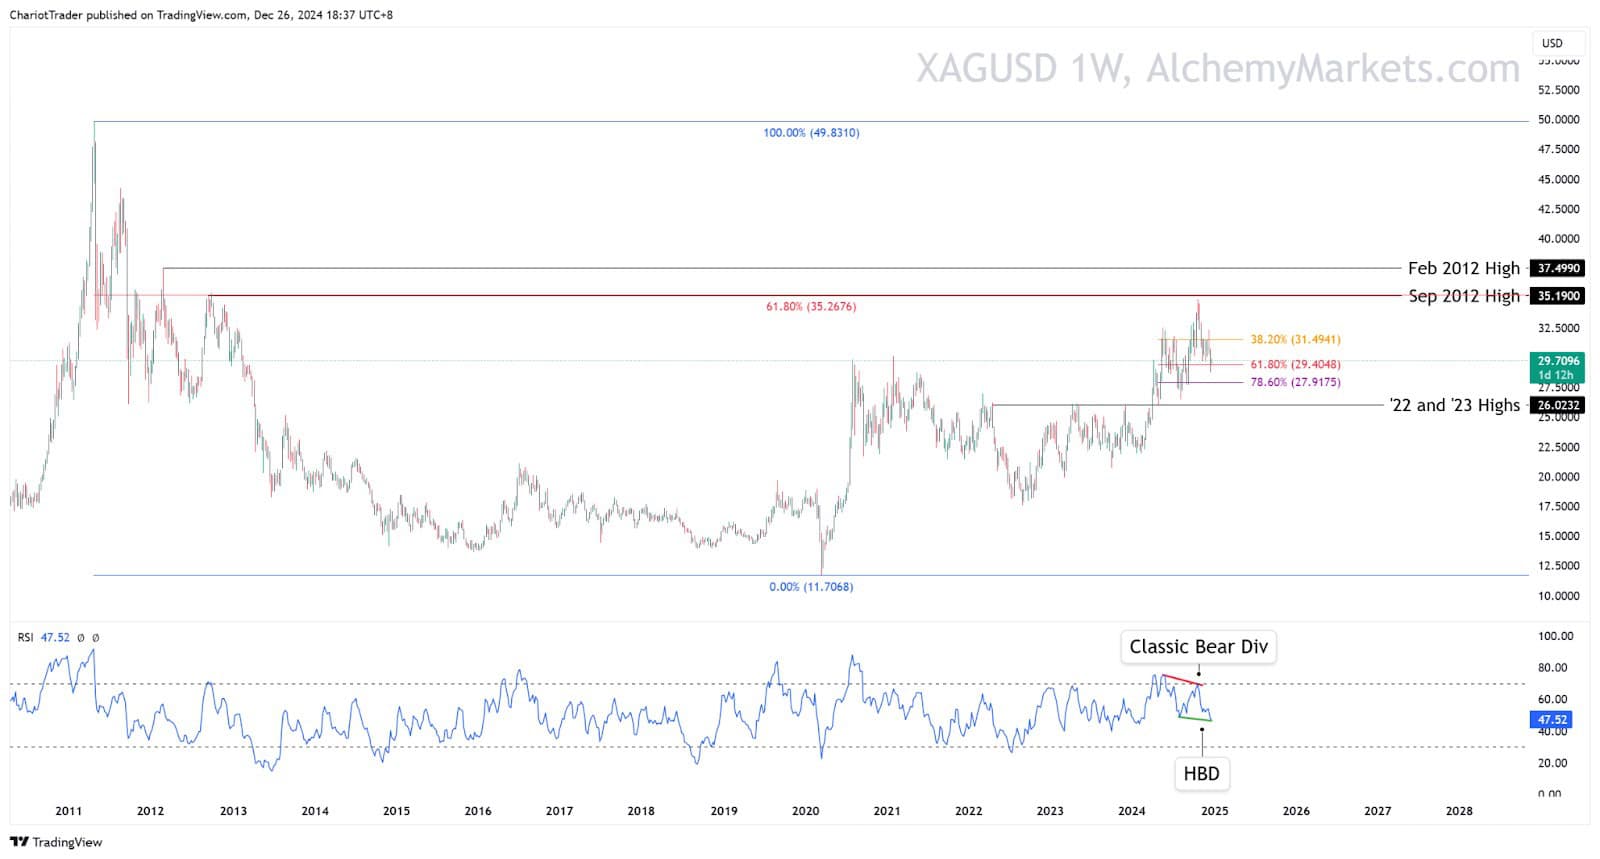
If Silver is able to push higher, a major key resistance zone to watch would be $35.1900 to $35.2676, as they are respectively Silver’s highest high in September 2012, and also the Golden Fib Retracement drawn from 2011 to 2024.
Alternatively, should Silver begin to decline in value, then a major key support to watch is the 2022 – 2023 Highs, at $26.02. This level marks the lowest low of a weekly bearish RSI divergence, which if broken, could confirm bearish reversal to around $20.00.
| Overall, we remain bullish on Silver in Q1, unless the ‘22 and ‘23 Highs level is broken on the weekly timeframe. |
WTI Crude (USOIL) Q1 2025 Analysis
WTI Crude Oil has a tough road ahead in Q1. Fundamentally, crude oil has an oversupply issue and waning demand, which exerts bearish pressure on the product:
- US Shale Production Surge: The United States has ramped up shale oil production, reaching record-high levels, which has flooded the domestic market with excess supply.
- Sluggish Demand Recovery: Key importers like the European Union and China have exhibited slower-than-expected economic growth, leading to weaker demand for crude oil exports.
- Non-OPEC Production Growth: Increased production from non-OPEC countries, particularly Brazil and Canada, adds to global supply, intensifying competition and reducing prices.
Coupled with oversupply pressures and bearish technicals, the asset could range within a weekly descending triangle for the coming months, and perhaps even breakdown towards the $40 price zone.
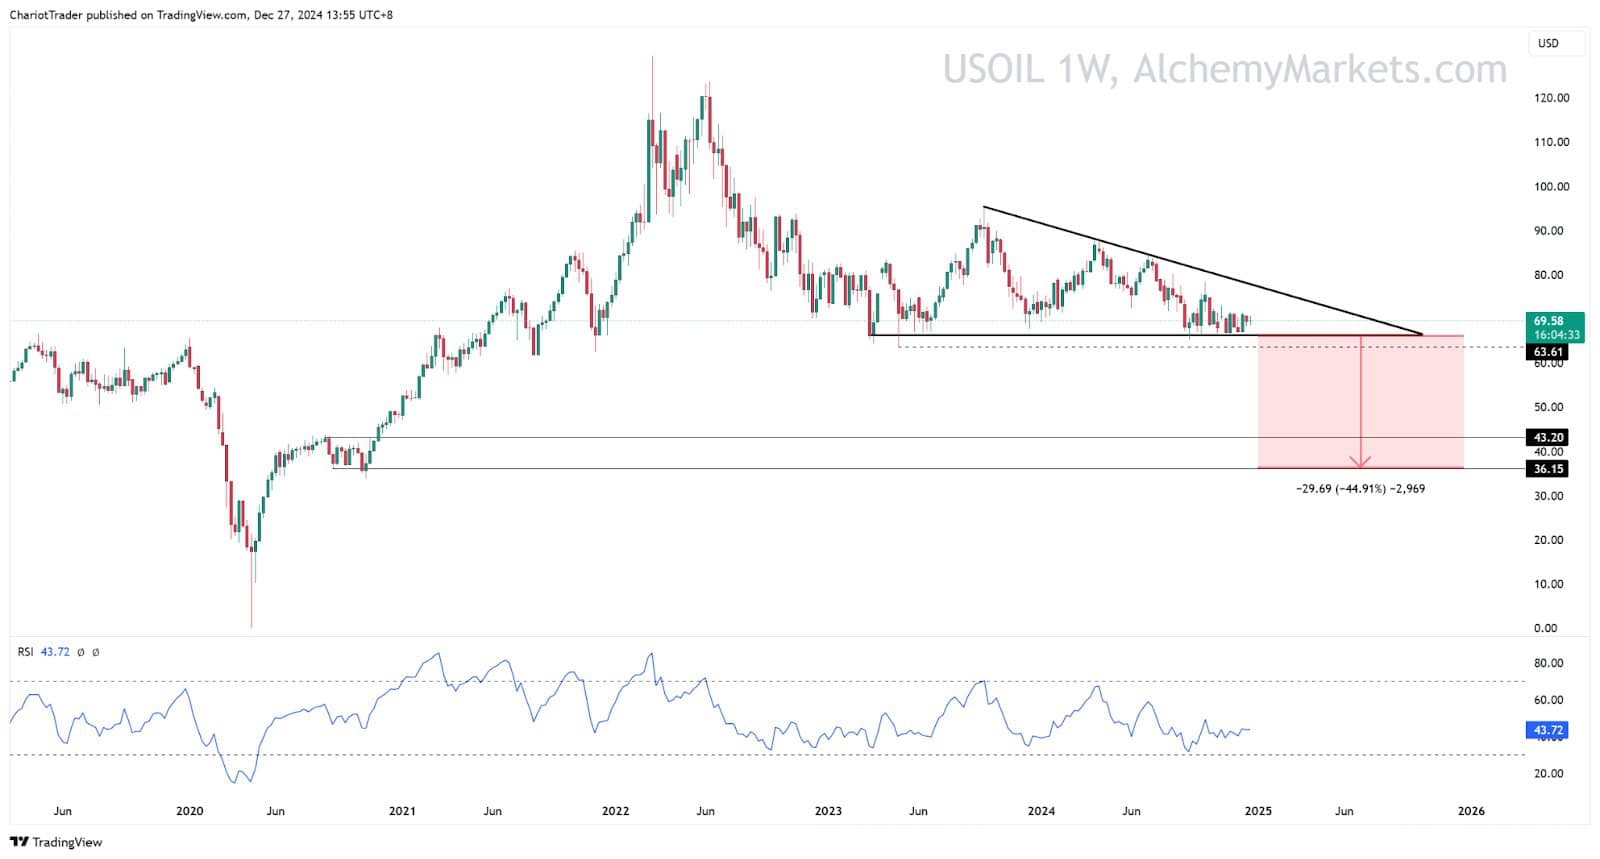
Give or take, the descending triangle’s low is placed at approximately $66.40. However, if the price of USOIL has a weekly close below $63.61, the lowest low of the descending triangle, it may confirm further downside of about -2,969 points. This measured move target would take USOIL down to $36.15, where price previously consolidated in November 2020.
Should prices hold above $64, there is potential for consolidation as the market awaits clearer signals from OPEC+. However, the Q1 outlook for WTI crude remains bearish, with risks skewed towards further downside unless demand significantly surprises to the upside.
| Overall, we remain bearish on USOIL in Q1 unless the upper trendline of the descending triangle is broken, signalling a bullish trend reversal. |
Brent Crude (UKOIL) Q1 2025 Analysis
As with WTI Crude Oil, the challenges Brent Crude Oil faces are practically the same: rising supply with waning demand, and a technically bearish descending triangle.
However, the challenges may be even greater for UKOIL as major players in the EU zone have reported modest GDP growth of 0.4% in the third quarter of 2024, while the UK economy stagnated with flat 0.0% GDP growth during the same period. Employment figures in the UK also face concerns amid warnings of job losses due to policy shifts, further complicating the demand outlook for Brent crude.
These weak economic numbers tell a story of a slowdown in UKOIL’s regional demand, all while oil as an asset class is combating these bearish factors:
- Rising Non-OPEC Output: Non-OPEC producers, including the United States and Brazil, continue to expand their output, undermining OPEC+ production cut efforts.
- Weak Global Economic Growth: Lacklustre economic performance in major economies dampens demand for Brent crude, particularly in Asia and Europe.
- Limited OPEC+ Flexibility: While OPEC+ has maintained production cuts, the growing output from competitors has limited their ability to significantly impact prices.
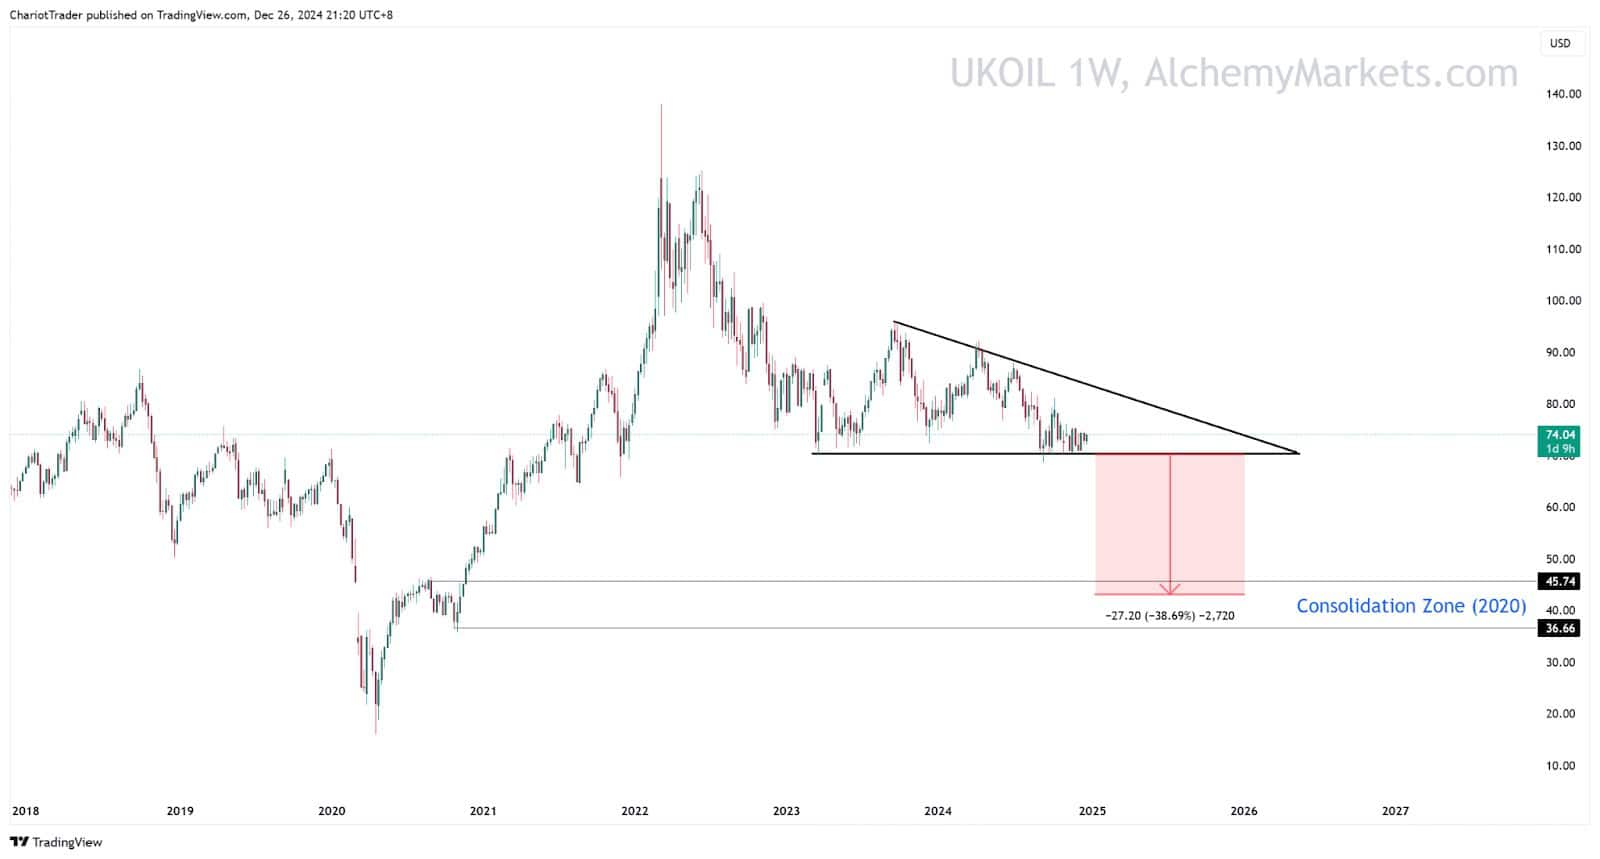
If UKOIL is able to close below the descending triangle’s support trendline at $70.40, we may see a bearish measured move towards the Consolidation Zone at $36.66 – $45.74. This would take us to approximately $43.11.
However, if UKOIL can hold support at $70.40, we may just simply range within the descending triangle for Q1 until a clearer technical signal is seen – such as a break above, or below the pattern.
Geopolitical factors may act as a catalyst to push the price of oil to either direction. Watch for:
- Strengthening economic data – Jobs, Unemployment Claims, GDP, Lowering PPI.
- Escalating wars – This would increase the demand for oil, particularly if the conflict is in close proximity to the EU (i.e. Ukraine).
- OPEC+ Policies – Tighter restrictions on oil production could help hold the UKOIL price at support.
| Overall, we remain bearish on UKOIL in Q1 unless the upper trendline of the descending triangle is broken, signalling a bullish trend reversal. |
Natural Gas (NGAS) Q1 2025 Analysis
Natural gas stands out as a rare bright spot in the commodities market for Q1 2025. Bolstered by robust demand for liquefied natural gas (LNG) exports and ongoing efforts in Europe to reduce reliance on Russian gas, the outlook for natural gas remains bullish.
The United States has solidified its position as a leading LNG exporter, benefiting from increased infrastructure capacity and strong global demand.
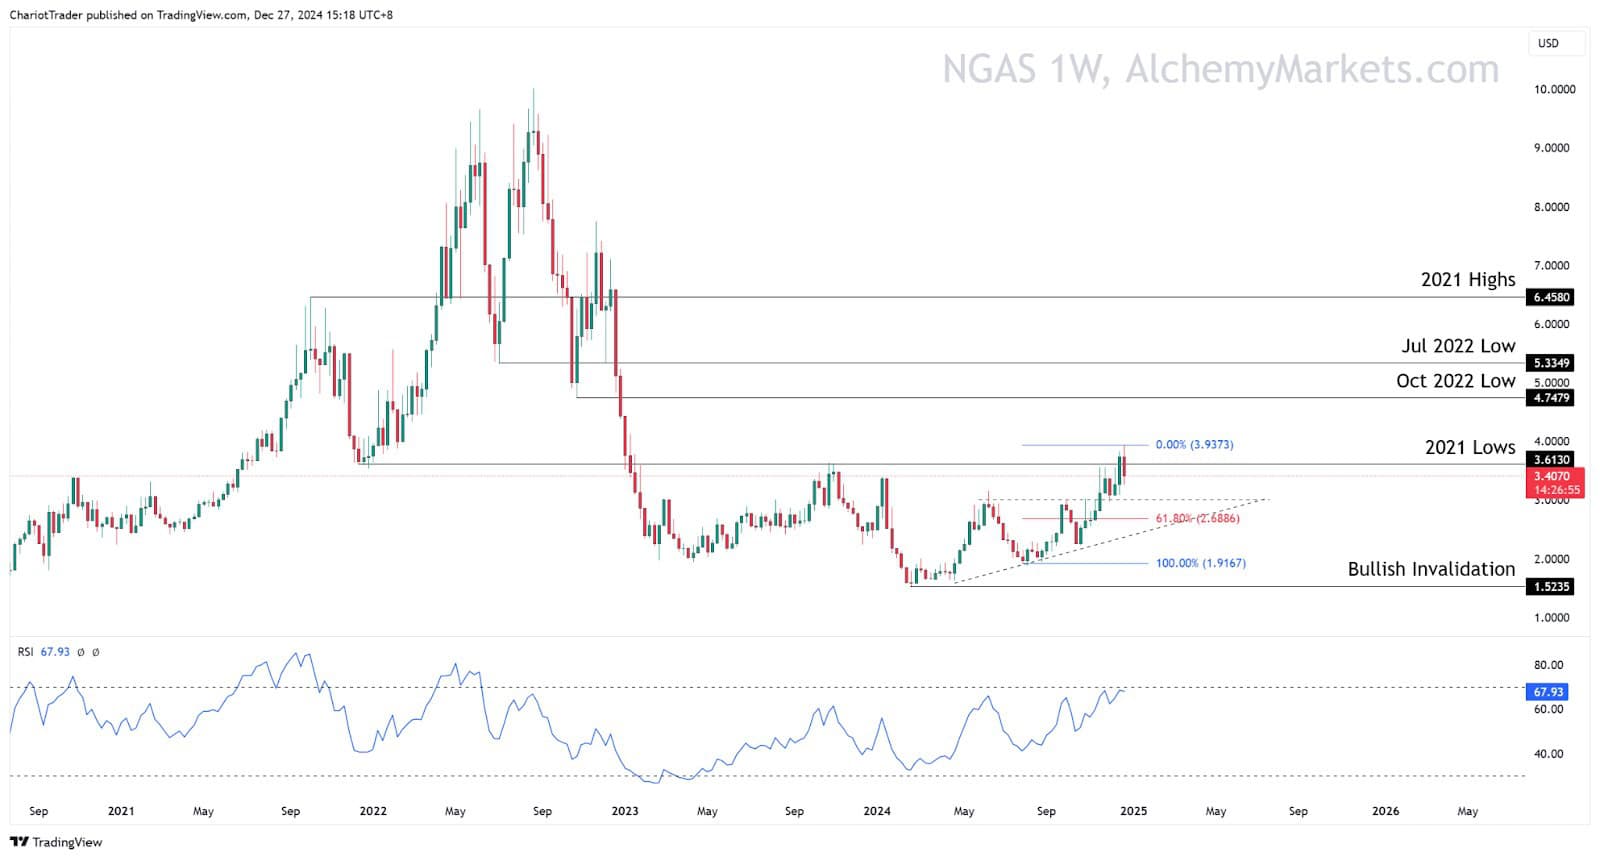
Technically, NGAS is currently seeing a weekly rejection of a major resistance area at $3.6130, the lows formed during 2021. If the price can overcome this zone, a rise towards the 2021 Highs should be in the works. Minor resistances before that are the Oct 2022 Low, and the July 2022 Low at $4.7479 and $5.3349 respectively.
Either way, a rejection at the 2021 Lows is not the end of the world for NGAS. Paired with strong fundamentals and a clear break from an ascending triangle pattern, NGAS is well positioned for further upside in Q1.
A temporary retracement here could take us back to the upper trendline of the Ascending Triangle, at approximately $3 dollars. However, a further drop could take us to the 61.80% Fibonacci Retracement level at $2.6886.
| Overall, we remain bullish on NGAS in Q1 unless it closes below $1.5235 (weekly), which would confirm a resumption of its broader downtrend. |
You may also be interested in:


