Written by:


- Opening Bell
- June 29, 2026
- 5 min read
Markets Enjoy a Relief Rally After a Chaotic Weekend
Markets spent the weekend trapped in another troubling cycle: expectations of de-escalation, fresh US-Iran strikes, then another stand-down and renewed talk of negotiations.
Each headline changed the risk picture without resolving the conflict. For now, investors appear to be treating the situation as contained rather than concluded.
That was enough to help Wall Street recover from last week’s hard sell-off. The rebound is welcome, especially across technology, but relief rallies are easiest near the lows. The harder test begins when price returns to broken support, moving averages and the fundamental pressures that caused the decline.
Bullish divergence helped trigger the recovery
Both USTEC and US500, Nasdaq and S&P 500 CFDs, formed four-hour bullish RSI divergences near last week’s lows.
A bullish divergence appears when price makes a lower low while RSI forms a higher low. It suggests that selling momentum is weakening, although it does not guarantee that the trend has reversed.
Both CFD indices have since reclaimed their four-hour 200 EMA, giving the recovery a stronger technical base.
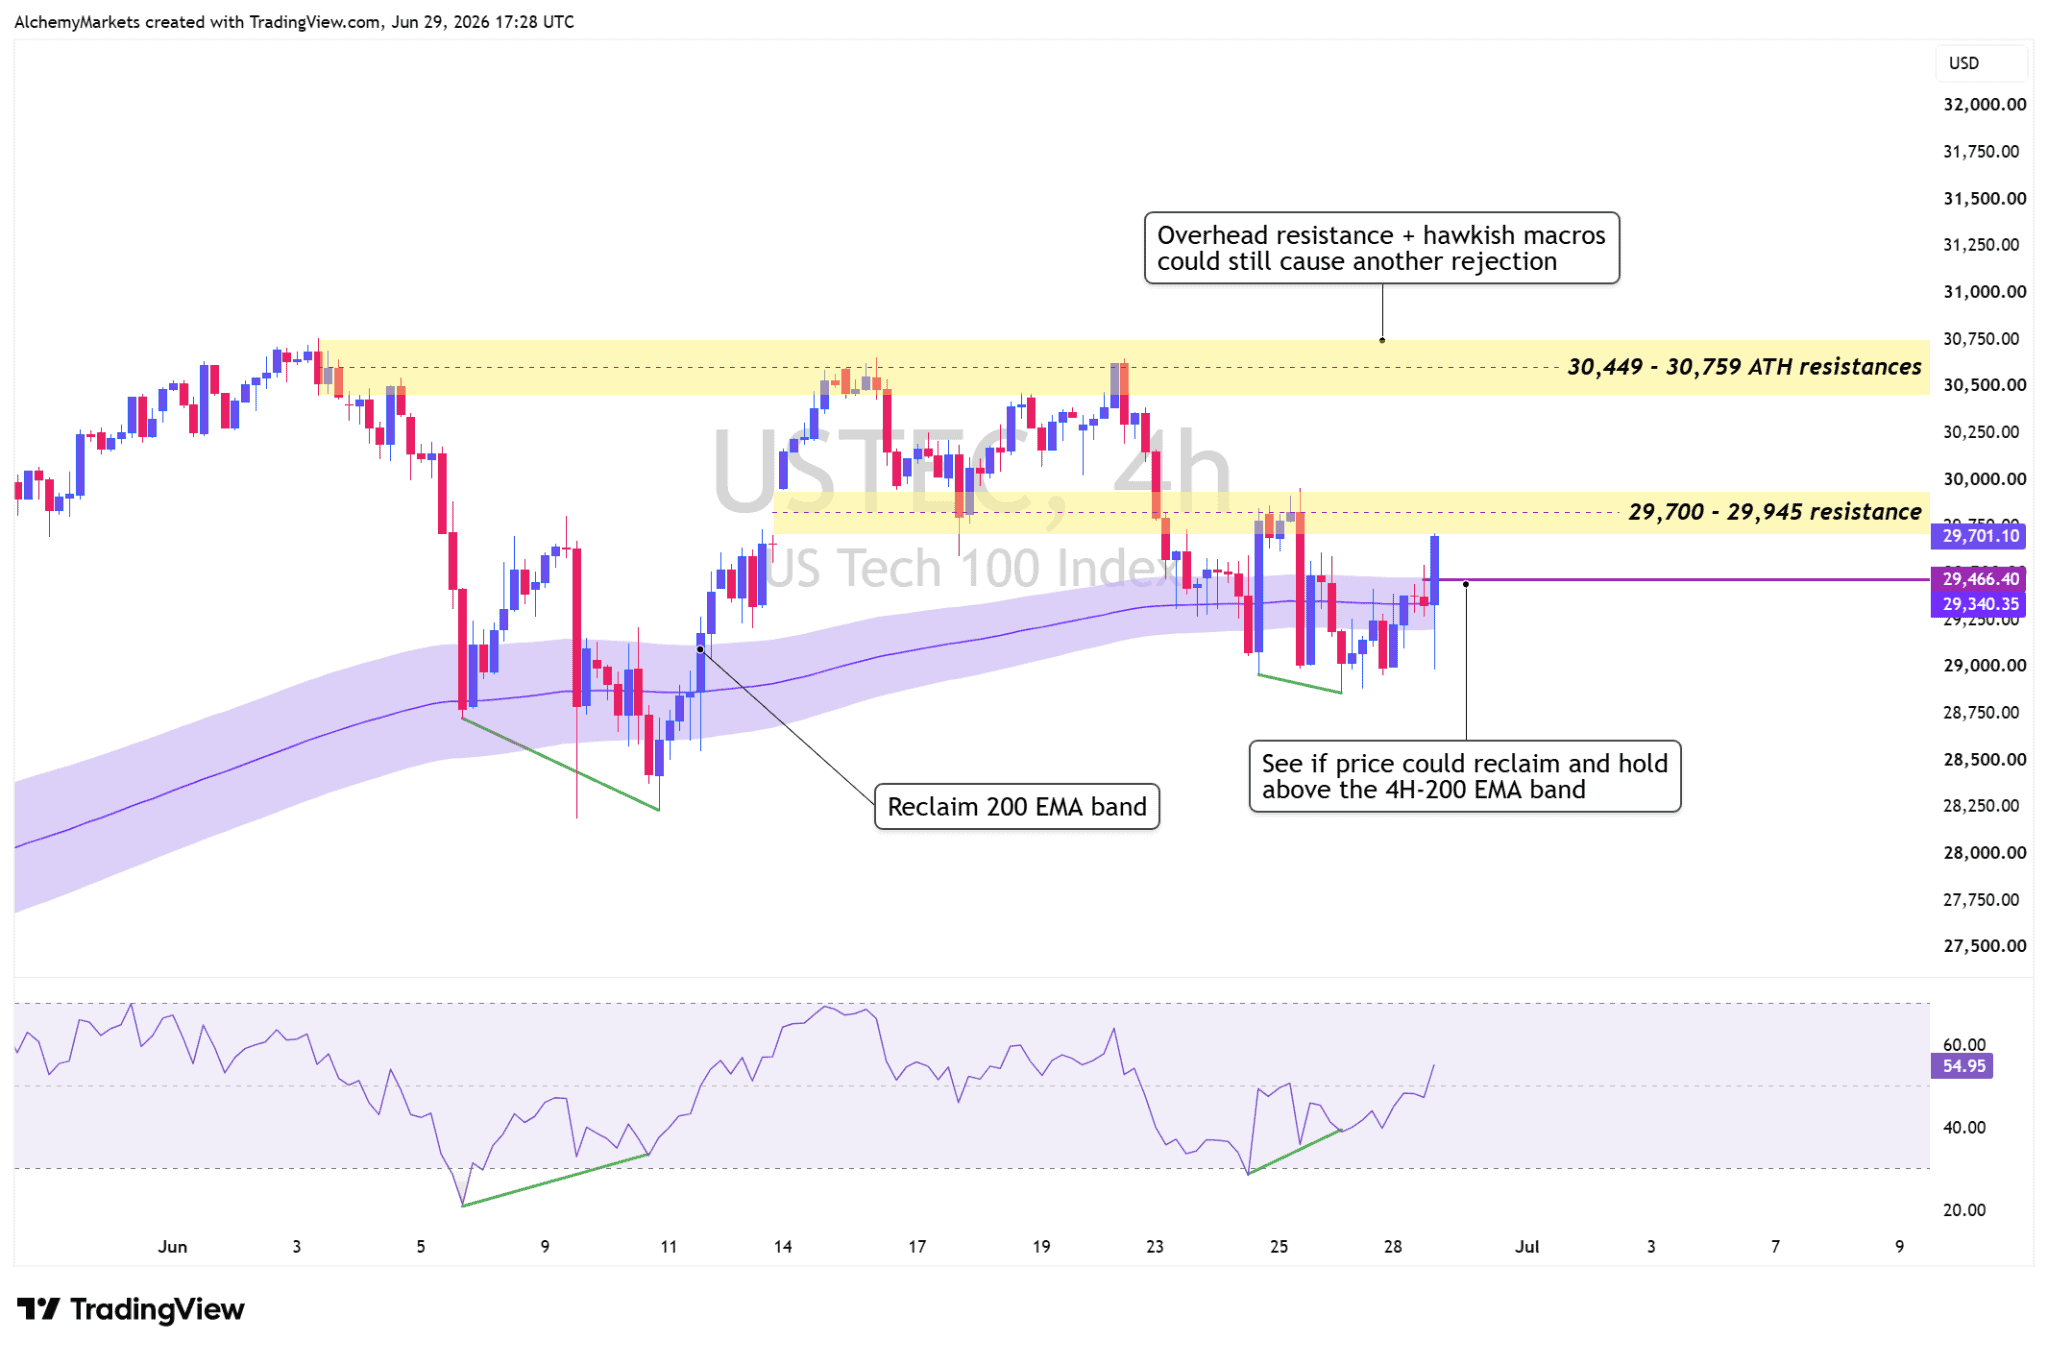
Nasdaq (USTEC) 4H Chart:
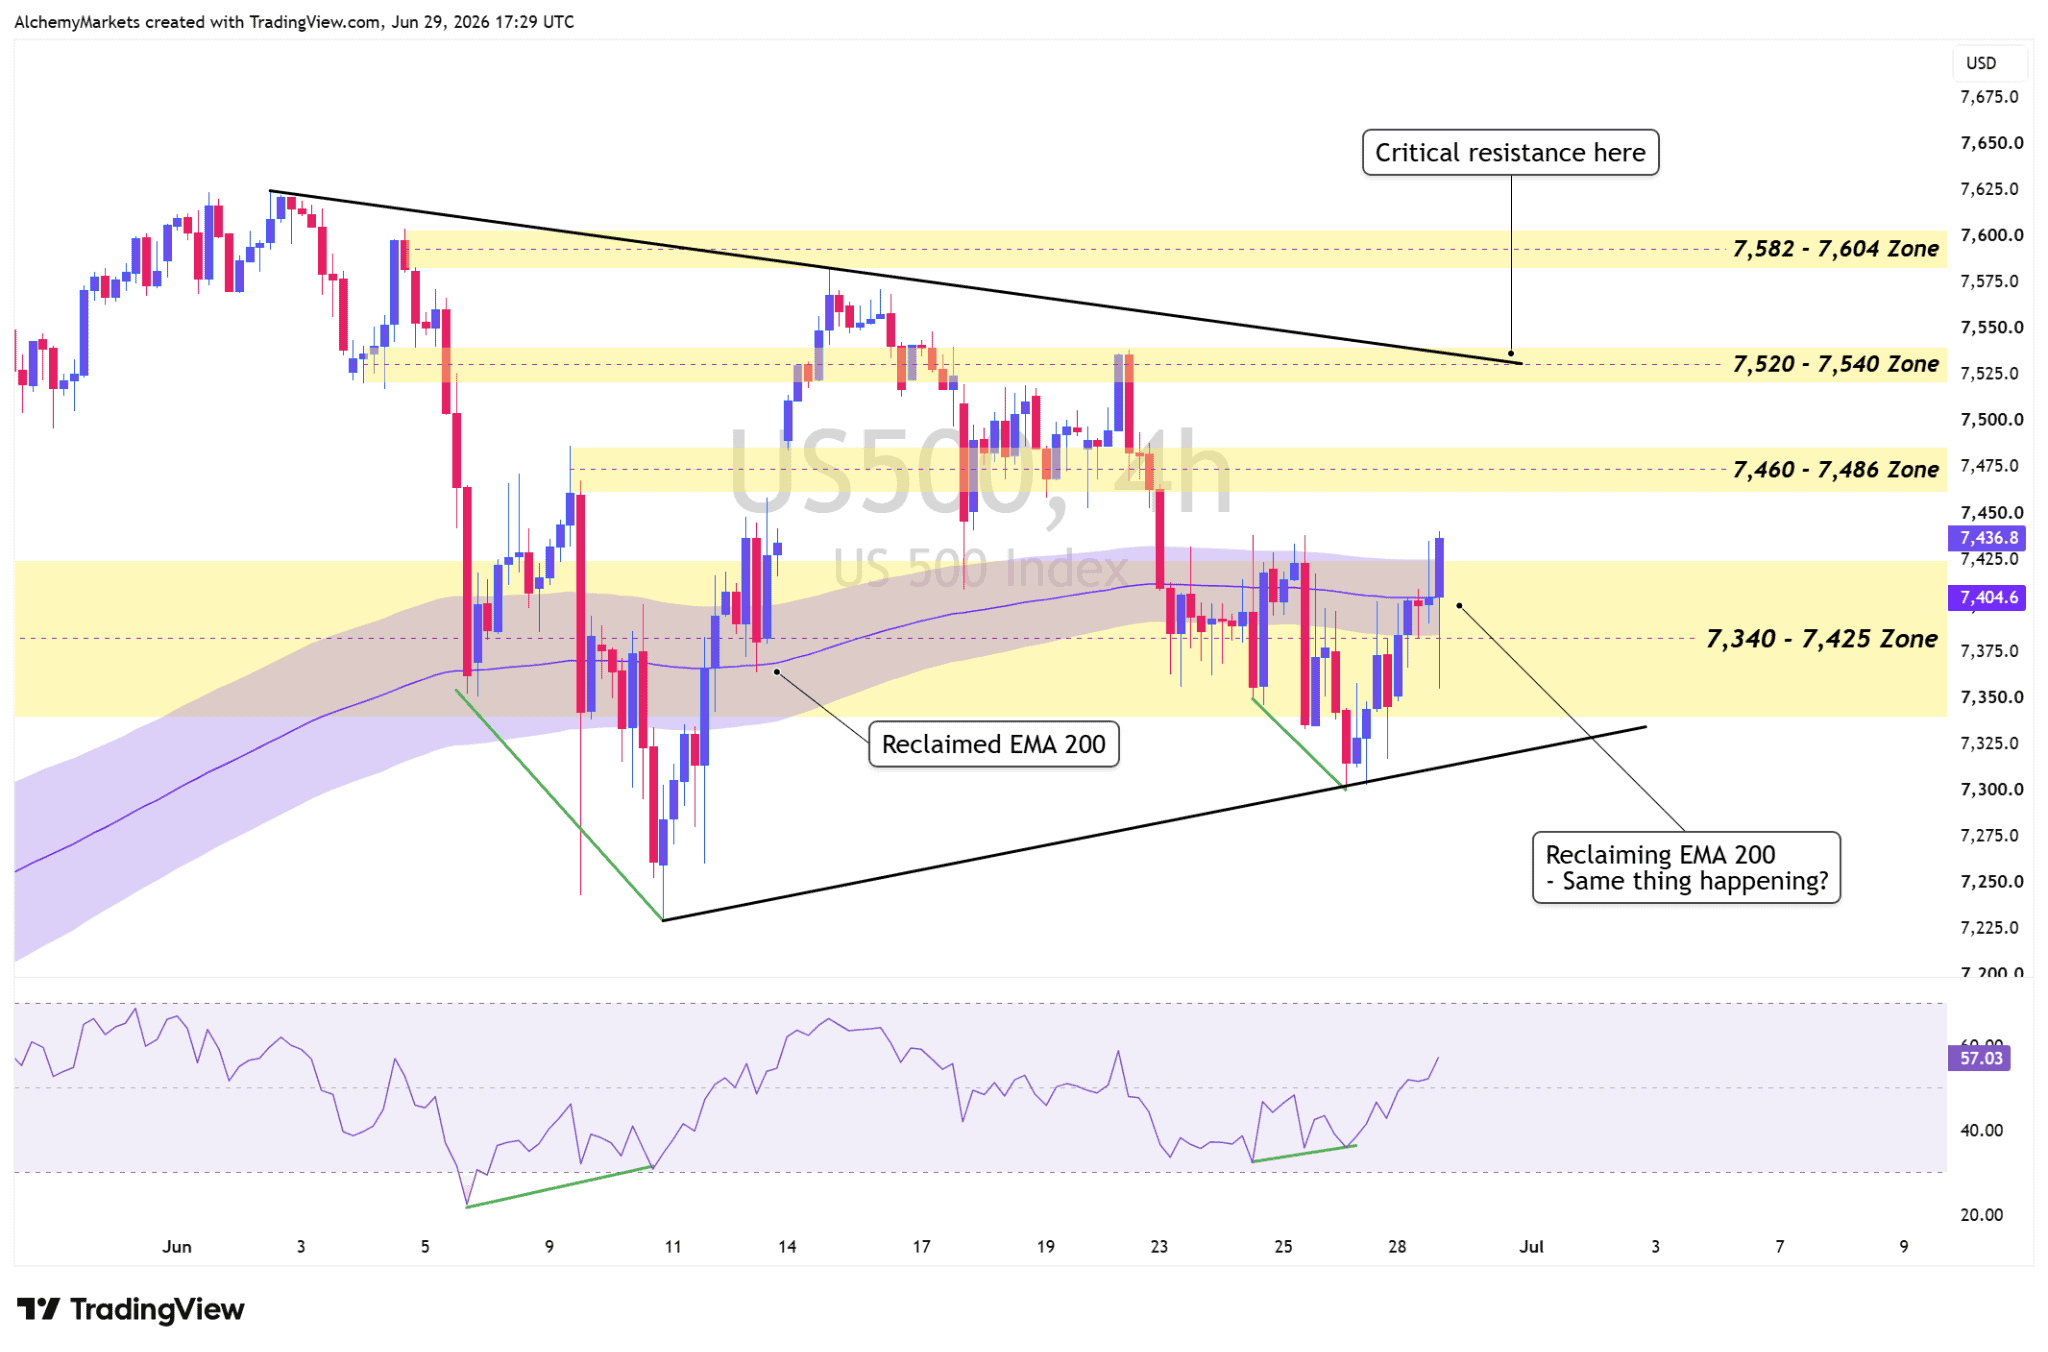
S&P 500 (US500) 4H Chart:
The next issue is overhead resistance.
| Market | Reclaimed support | Next resistance | Larger target |
| USTEC | 29,340–29,466 | 29,700–29,945 | 30,449–30,759 |
| US500 | 7,340–7,425 | 7,460–7,486 | 7,520–7,540, then 7,582–7,604 |
USTEC is already testing the lower edge of its first resistance zone. A clean move through 29,945, followed by a successful retest, would make the recovery more convincing.
US500 has also improved, but it still faces several layers of support and resistance. The falling trendline around 7,520–7,540 may be the more important test.
If both indices hold their reclaimed 200 EMA bands and clear their first resistance zones, the rally begins to look broader than a short-covering bounce.
If they fall back below those moving averages, last week’s downtrend remains in control.
The Magnificent Seven are bouncing too
The Roundhill Magnificent Seven ETF has rebounded from its 61.8% retracement near 61.20, supported by another four-hour bullish divergence.
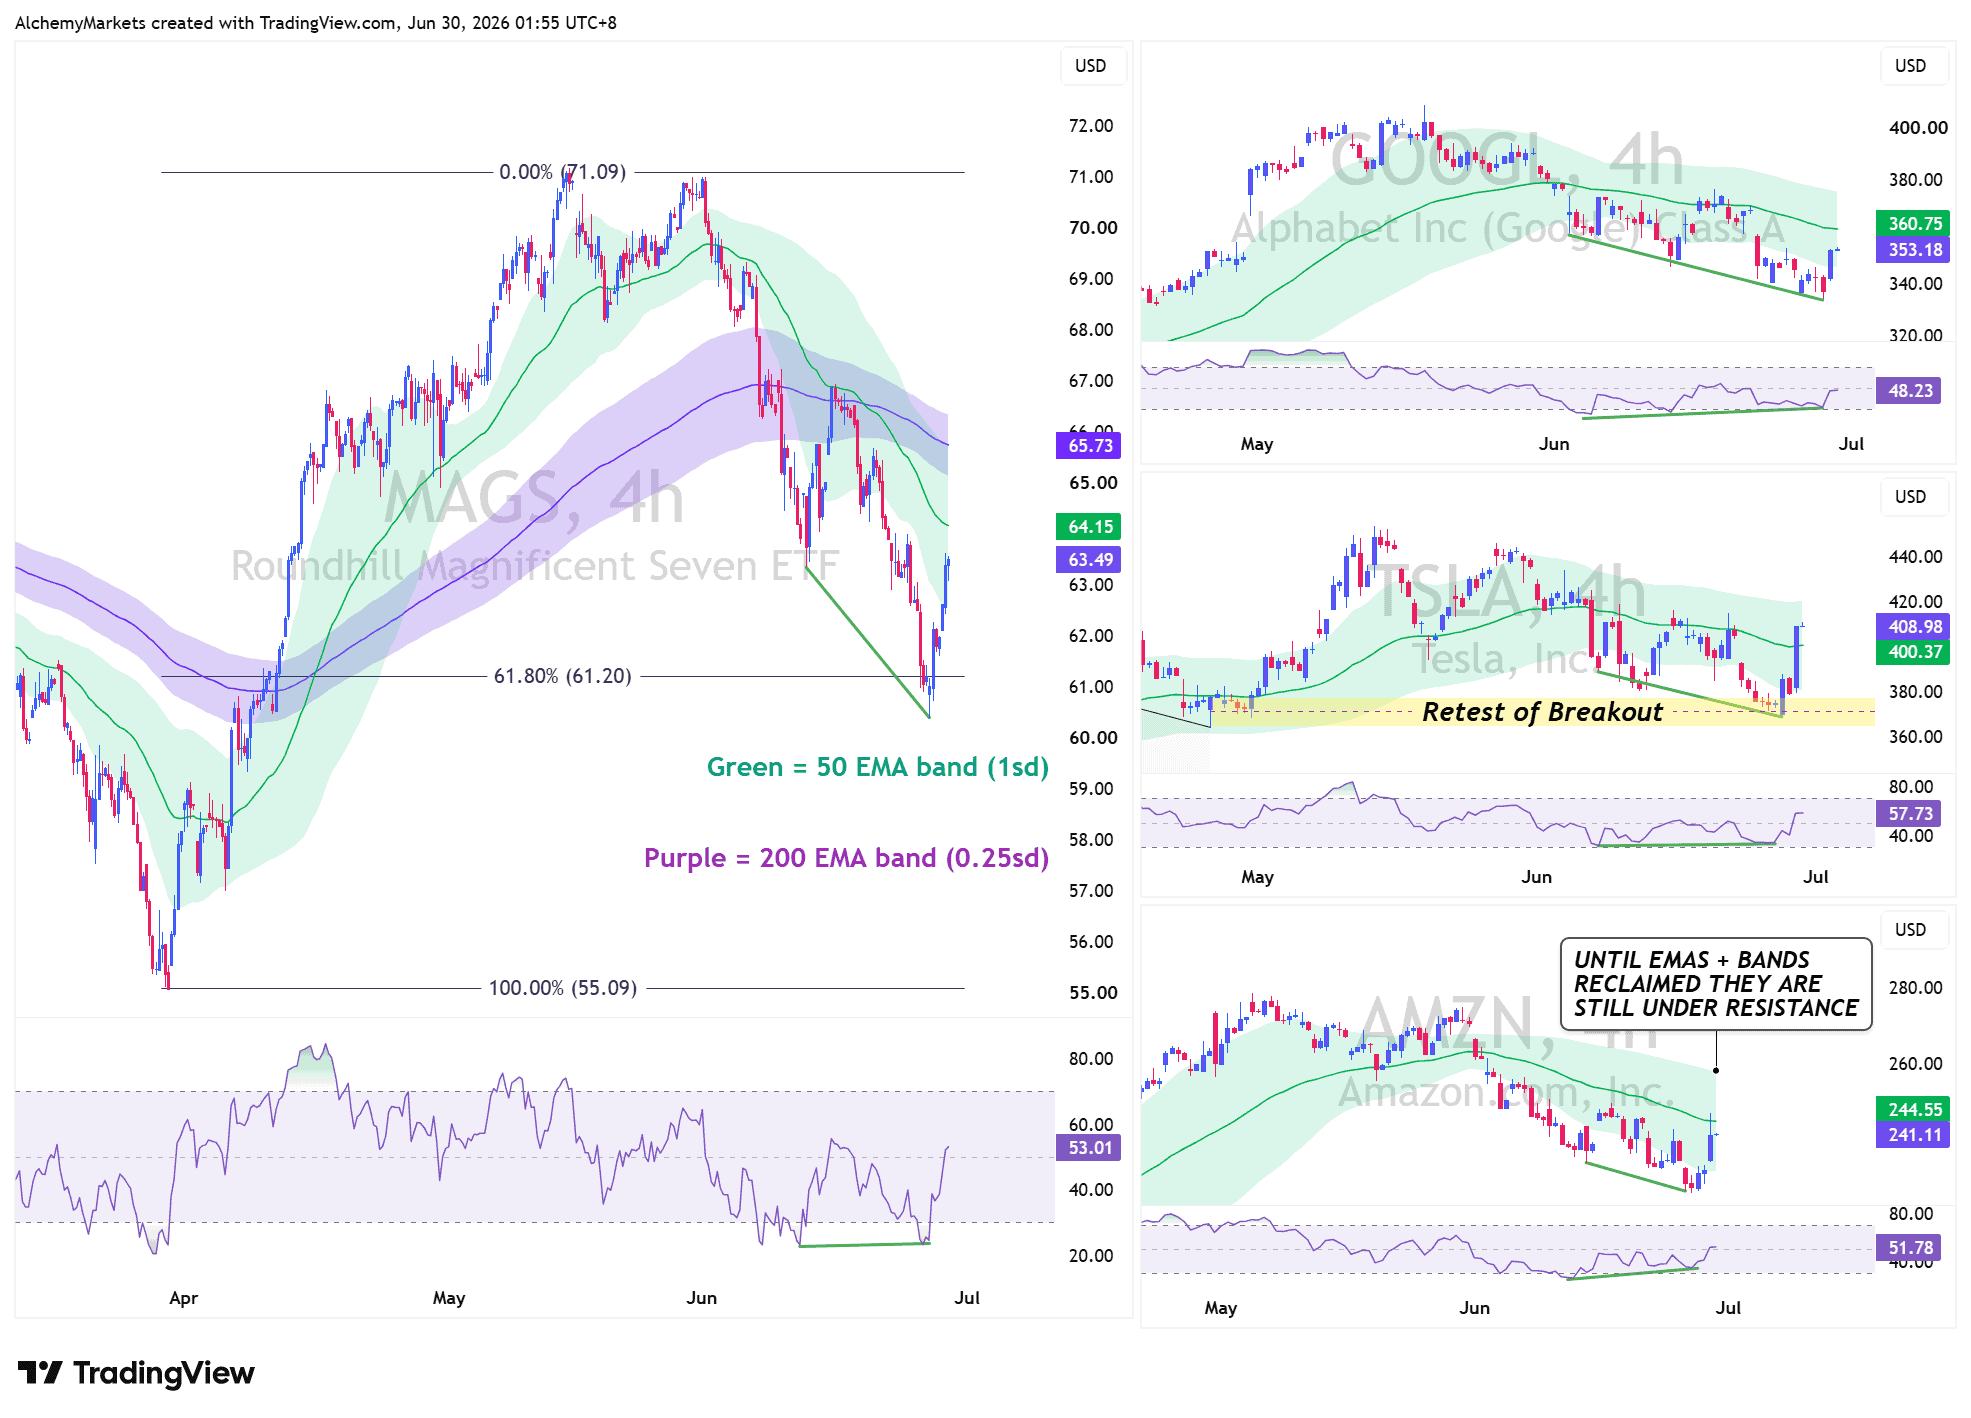
Alphabet, Tesla and Amazon are showing similar momentum improvements. In each case, RSI held or formed a higher low while price retested lower levels.
However, most of these stocks remain underneath important EMA resistance.
| Asset | What improved | What still needs to happen |
| MAGS | Rebounded from 61.20 with bullish divergence | Reclaim the 63.50–65.75 EMA cluster |
| Alphabet | Recovered above its 4H 200 EMA near 344 | Clear 353, then the 50 EMA near 361 |
| Tesla | Held the 367–380 breakout-retest zone | Hold above 400 and clear the 200 EMA near 409 |
| Amazon | Bounced from channel support | Reclaim and hold the 241–245 EMA region |
This is why the MAGS chart matters.
The large technology stocks are participating in the rebound, but most are only now reaching the moving averages that broke during the sell-off. Until those bands are reclaimed, they remain resistance.
The recovery therefore has breadth, but it has not yet repaired the trend.
Why the rally could still be rejected
The geopolitical situation has calmed, but it remains fragile. Another round of attacks or a formal breakdown in negotiations could quickly lift oil, inflation expectations and defensive demand for the dollar.
Inflation is also still a problem. May PCE inflation reached 4.1%, while core PCE rose to 3.4%. That leaves the Federal Reserve with little reason to support markets through easier policy.
The AI trade has its own unresolved pressure. Strong memory demand is good for semiconductor suppliers, but rising component prices can squeeze the margins of the companies purchasing those chips. They must either absorb the costs, raise product prices or reduce investment.
None of those choices is especially comfortable for expensive technology stocks.
| Rejection risk | Why it matters |
| USTEC and US500 fail at resistance | Confirms sellers are still using rallies to exit |
| MAGS remains below its EMA cluster | Shows the megacap trend has not repaired |
| Treasury yields and DXY rise | Tightens financial conditions and pressures valuations |
| Oil rebounds on renewed escalation | Revives inflation and rate-hike concerns |
| Payrolls are too strong | Supports higher rates and the dollar |
| Payrolls collapse | Replaces rate relief with growth and earnings fears |
The next three sessions will test the bounce
Monday’s rally developed during a quiet US data window. That can change quickly during this week.
| Date | Event | Why markets care |
| Tuesday, 30 June | RBA meeting minutes | Tests whether further Australian tightening remains possible |
| Tuesday, 30 June | China PMIs | Important for global growth, AUD and Asian risk sentiment |
| Tuesday, 30 June | US JOLTS and consumer confidence | Early read on labour demand and household confidence |
| Wednesday, 1 July | BoJ Tankan | Could strengthen or weaken expectations for further BoJ tightening |
| Wednesday, 1 July | ISM manufacturing | Tests whether US growth remains strong enough to sustain higher rates |
| Wednesday, 1 July | Global central-bank policy panel | Fed, ECB, BoE and BoC guidance could move yields and currencies |
| Thursday, 2 July | US nonfarm payrolls | The week’s main test for the dollar, yields and equities |
The ideal payroll result would be a moderate slowdown.
Markets want employment to cool enough to reduce rate pressure, but not weaken enough to create a recession scare. Strong jobs and wages could push yields higher again. A severe miss could initially help bonds before raising concerns about economic growth.
Relief rally or trend recovery?
The recovery is real, but its durability remains unproven.
USTEC and US500 have reclaimed their four-hour 200 EMA bands. MAGS and several of its largest holdings have also formed bullish divergences and bounced from support.
Now the rally must survive resistance, sticky inflation, central-bank signals and Thursday’s labour data.
The bullish case requires the indices to hold their reclaimed trend bands while the Magnificent Seven move above their EMA resistance.
Until then, this remains an encouraging relief rally with room to continue, but also one that could still be rejected by the same technical and fundamental pressures that caused last week’s decline.