


Written by:

- Opening Bell
- April 13, 2026
- 5 min read
Ceasefire Fragility: US-Iran Talks Fail, Futures Reprice Hormuz
New developments in the US-Iran war over the weekends have not been good for equities.
Talks in Islamabad failed, and Washington then said it would begin blockading maritime traffic entering and leaving Iranian ports from 10 a.m. ET / 1400 GMT on April 13. That is not a full shutdown of Hormuz for every ship, but it is still a clear escalation around a route that handles more than a quarter of global seaborne oil trade and about one-fifth of global oil trade.
The futures market has already reacted at the Asian open today. In USOIL futures, price gapped up from below $96 to around $102, while US500, the CFD equivalent that tracks S&P 500 futures pricing, gapped down from 6,808 to 6,769. That gives us the clearest early read on how traders are pricing the failed talks and renewed Hormuz risk.
US500 4H chart: gap down puts the 6,850 retest in doubt
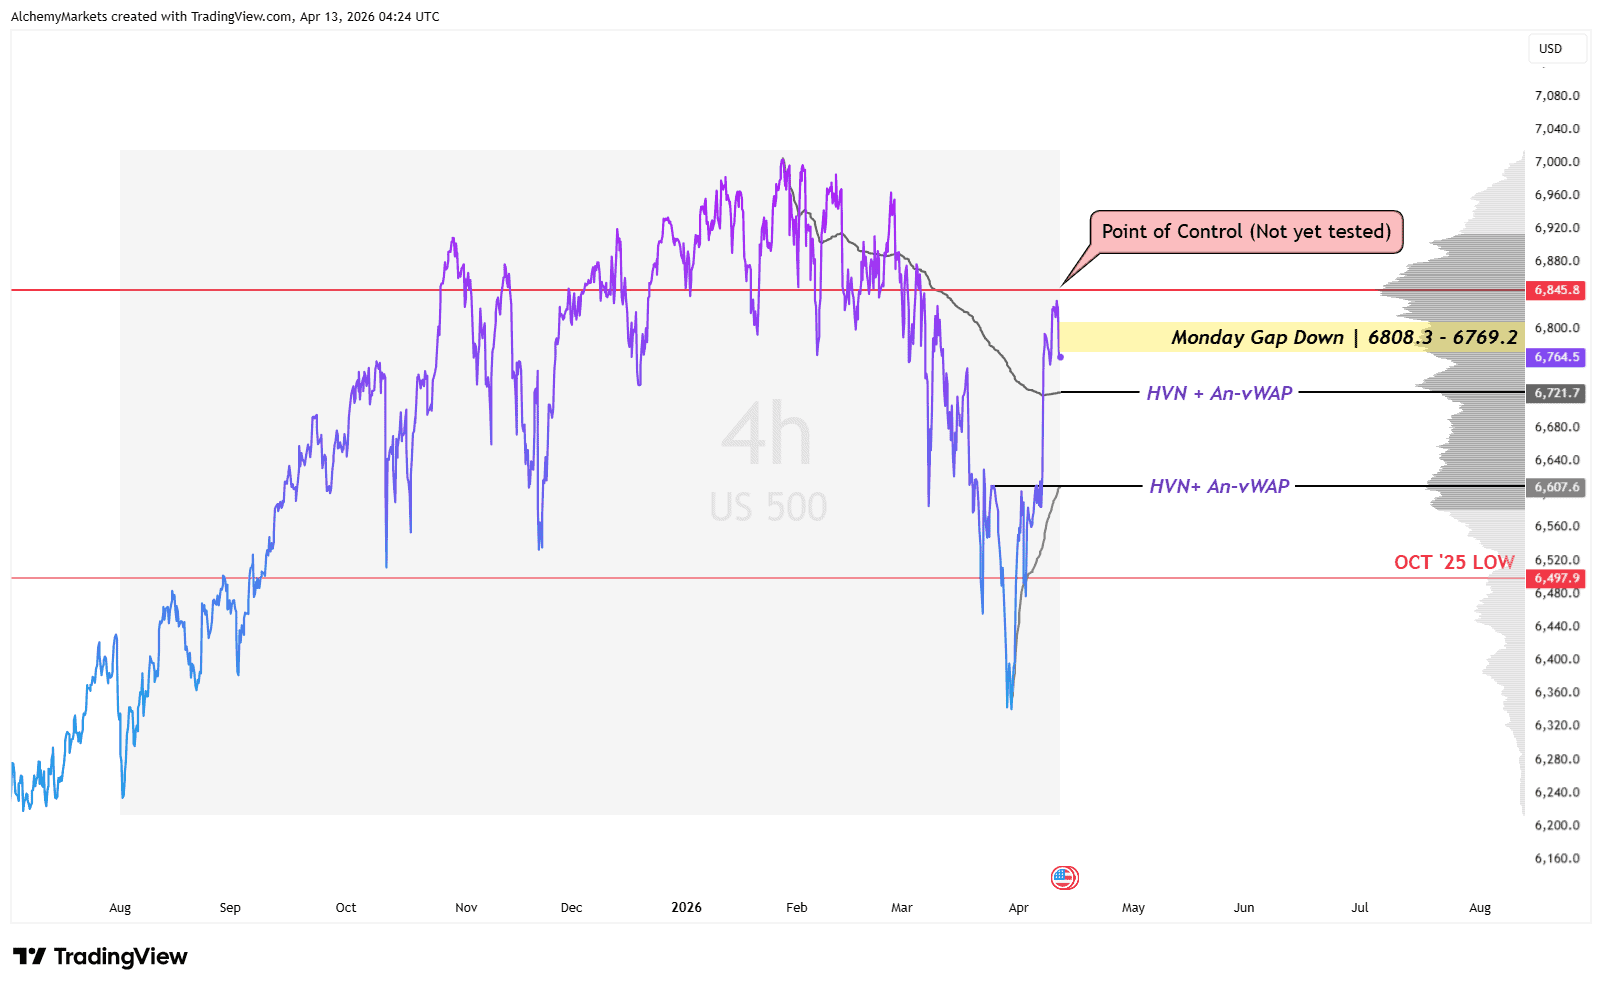
On the US500 4H chart, the Asia open gave us the reaction straight away with a gap down. Last week, the market still looked capable of grinding a bit higher into the 6,850 Point of Control, which is the highest-traded volume area since the August 2025 lows. That move is not fully dead yet, but it is harder to argue for now because price first has to work through the 6,808 gap with fresh bearish news sitting behind it.
Below that, two supports stand out cleanly on the chart. The first is around 6,721, where the anchored VWAP from the 2026 highs lines up with a high-volume node (HVN), and the second sits near 6,607, where the anchored VWAP from the 2026 lows lines up with another HVN. If both fail, then the bigger level to watch is the 6,500 zone near the October 2025 lows, which could act as an ultimate low test and possible liquidity sweep if the market wants to reclaim higher later.
Fundamentally, though, the backdrop still looks rough. Reuters reported that the blockade announcement hit financial markets while oil surged, which fits the gap-down tone already showing up on the equity chart. So even if a technical bounce comes in, it is starting from a weaker narrative than the one bulls had a few days ago.
USOIL futures: the cleaner read on immediate market thinking
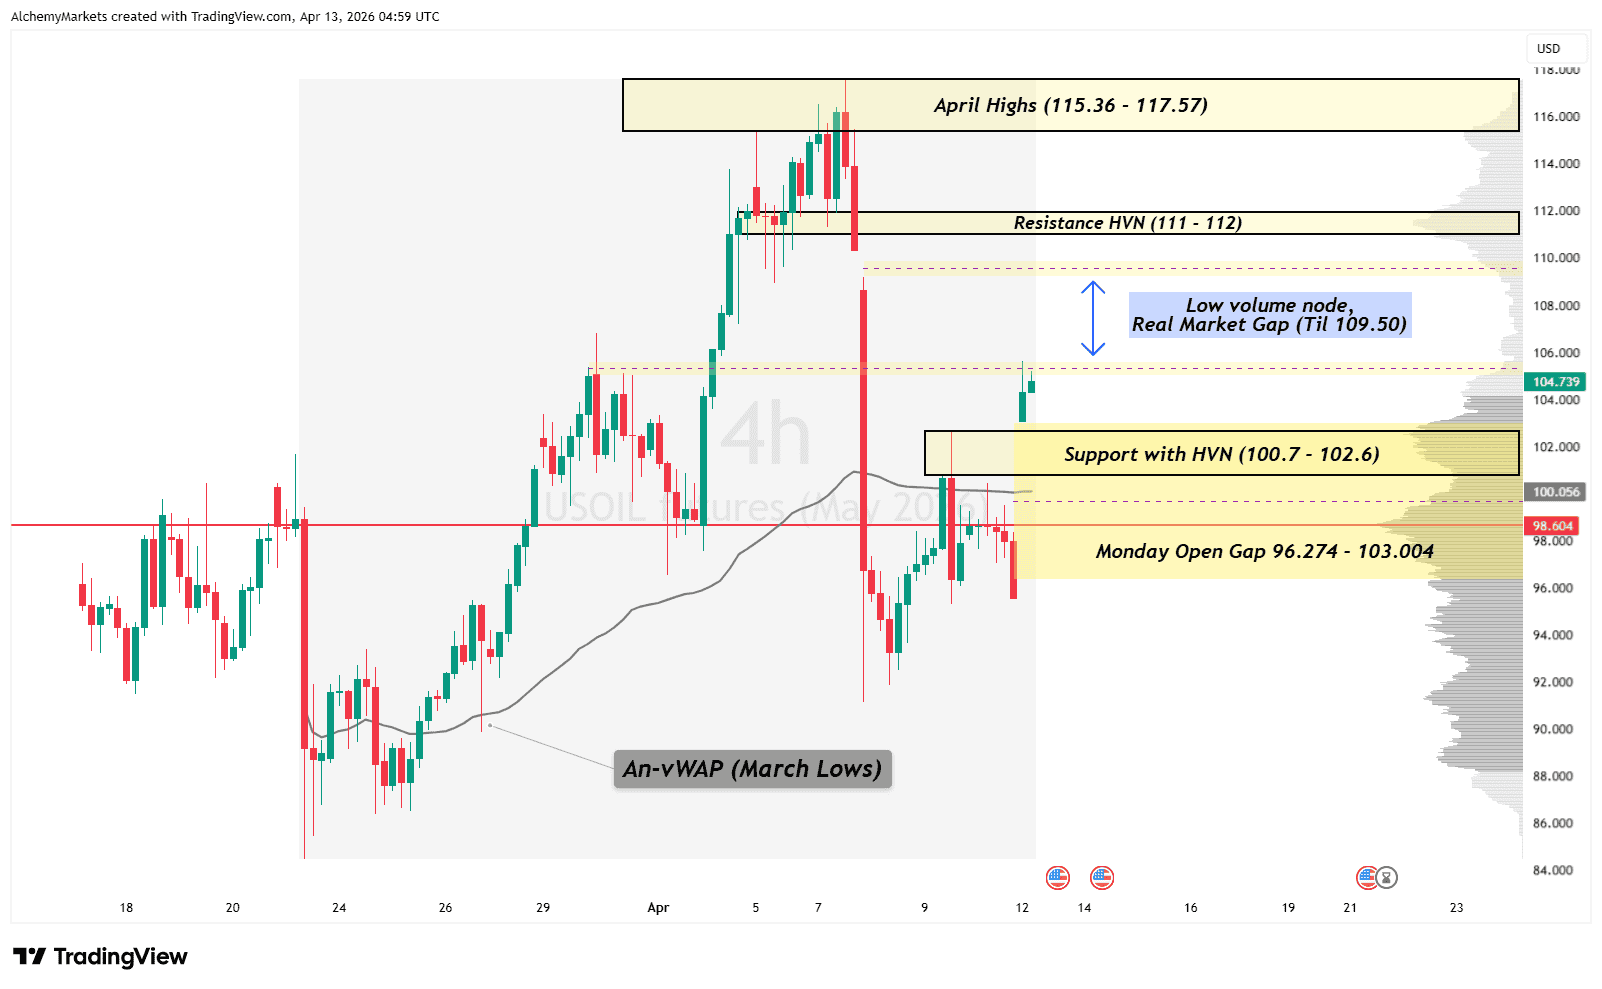
For oil, USOIL futures 4H chart already shows the market treating this as a proper overnight shock, not just a small wobble. We have the big Monday gap, support at $100.7 to $102.6, and a smaller resistance area right around $105.
If price cuts through that $105 area, the low-volume zone above could let oil travel faster than usual. That matters because the LVN overlaps with a real gap on the futures chart, and gap areas can offer very little friction when a strong headline is doing the pushing. Above that, the nearest meaningful resistance is around $111 to $112, then higher resistance comes in from roughly $115.3 and upward.
Several pressures are now stacking up
| Several pressures are now starting to stack up. The first is the failure of the peace talks themselves. The ceasefire was foremost, a temporary one, and presumably set for the purpose of further peace negotiations. However, results so far have not proven fruitful. |
| The second is the growing pressure around Hormuz, with Iran still posing a threat to free passage while the U.S. moves to blockade maritime traffic tied to Iranian ports. Reports that tankers were already steering clear of the strait before the blockade took effect suggest this is already changing market behaviour, not just generating headlines. If the conflict spreads further, oil is likely to stay firm while equities continue trading under a cloud of uncertainty. |
| Private credit is still a background risk worth watching. The market is now roughly $2 trillion, defaults hit a record 9.2% in 2025, and retail ownership in private credit funds has climbed to 16.6% from 5.5% in 2020, which matters more when liquidity is thin and withdrawals start rising. BlackRock, Blackstone, and Blue Owl have all faced redemption pressure, and the Fed has already started asking major U.S. banks about their exposure, so this is not the main driver today, but it is clearly not nothing either. |
| The AI capex story is still a support for equities, but it is not getting a free pass. Big Tech was expected to spend about $635 billion on AI infrastructure in 2026, up from $383 billion in 2025 and just $80 billion in 2019, while Nvidia’s gross margin was still running around 75%, which shows how profitable the buildout has been. The catch is energy: S&P Global warned that if oil keeps pushing higher and energy costs stay elevated, capex plans could get revised and that could become a real catalyst for a broader equity correction. |
Bottom Line
The market gave the ceasefire a chance last week, but futures now suggest confidence has slipped. US500 has a gap overhead with key supports below, while oil futures are trading like Hormuz risk is back in the price.
For equities, the recovery path still runs through 6,808 and then the 6,850 Point of Control. For oil, a break above $105 could open the way toward $111–$112, with the $115–$120 shock zone above.
For now, futures are giving the cleaner read for today’s sentiment. So far it is leaning towards defensive (USD/USOIL positive, Equities negative), but NY open will show if the market follows through on this primary reaction.


