


Written by:

- Opening Bell
- January 29, 2026
- 3 min read
Dollar Debasement Hums Grow as DXY, EUR/USD Test Key Levels
Markets digested last night’s FOMC with little drama on the surface, but the message was clear enough: the Fed remains comfortable letting financial conditions stay loose (dovish).
This is clearly a weakness for the US dollar, and yields eased, with gold and the stock markets grinding higher on positive earnings. In short, the Fed did nothing to interrupt the prevailing narrative.
That puts the focus firmly back on the charts, which is now telling us an interesting story.
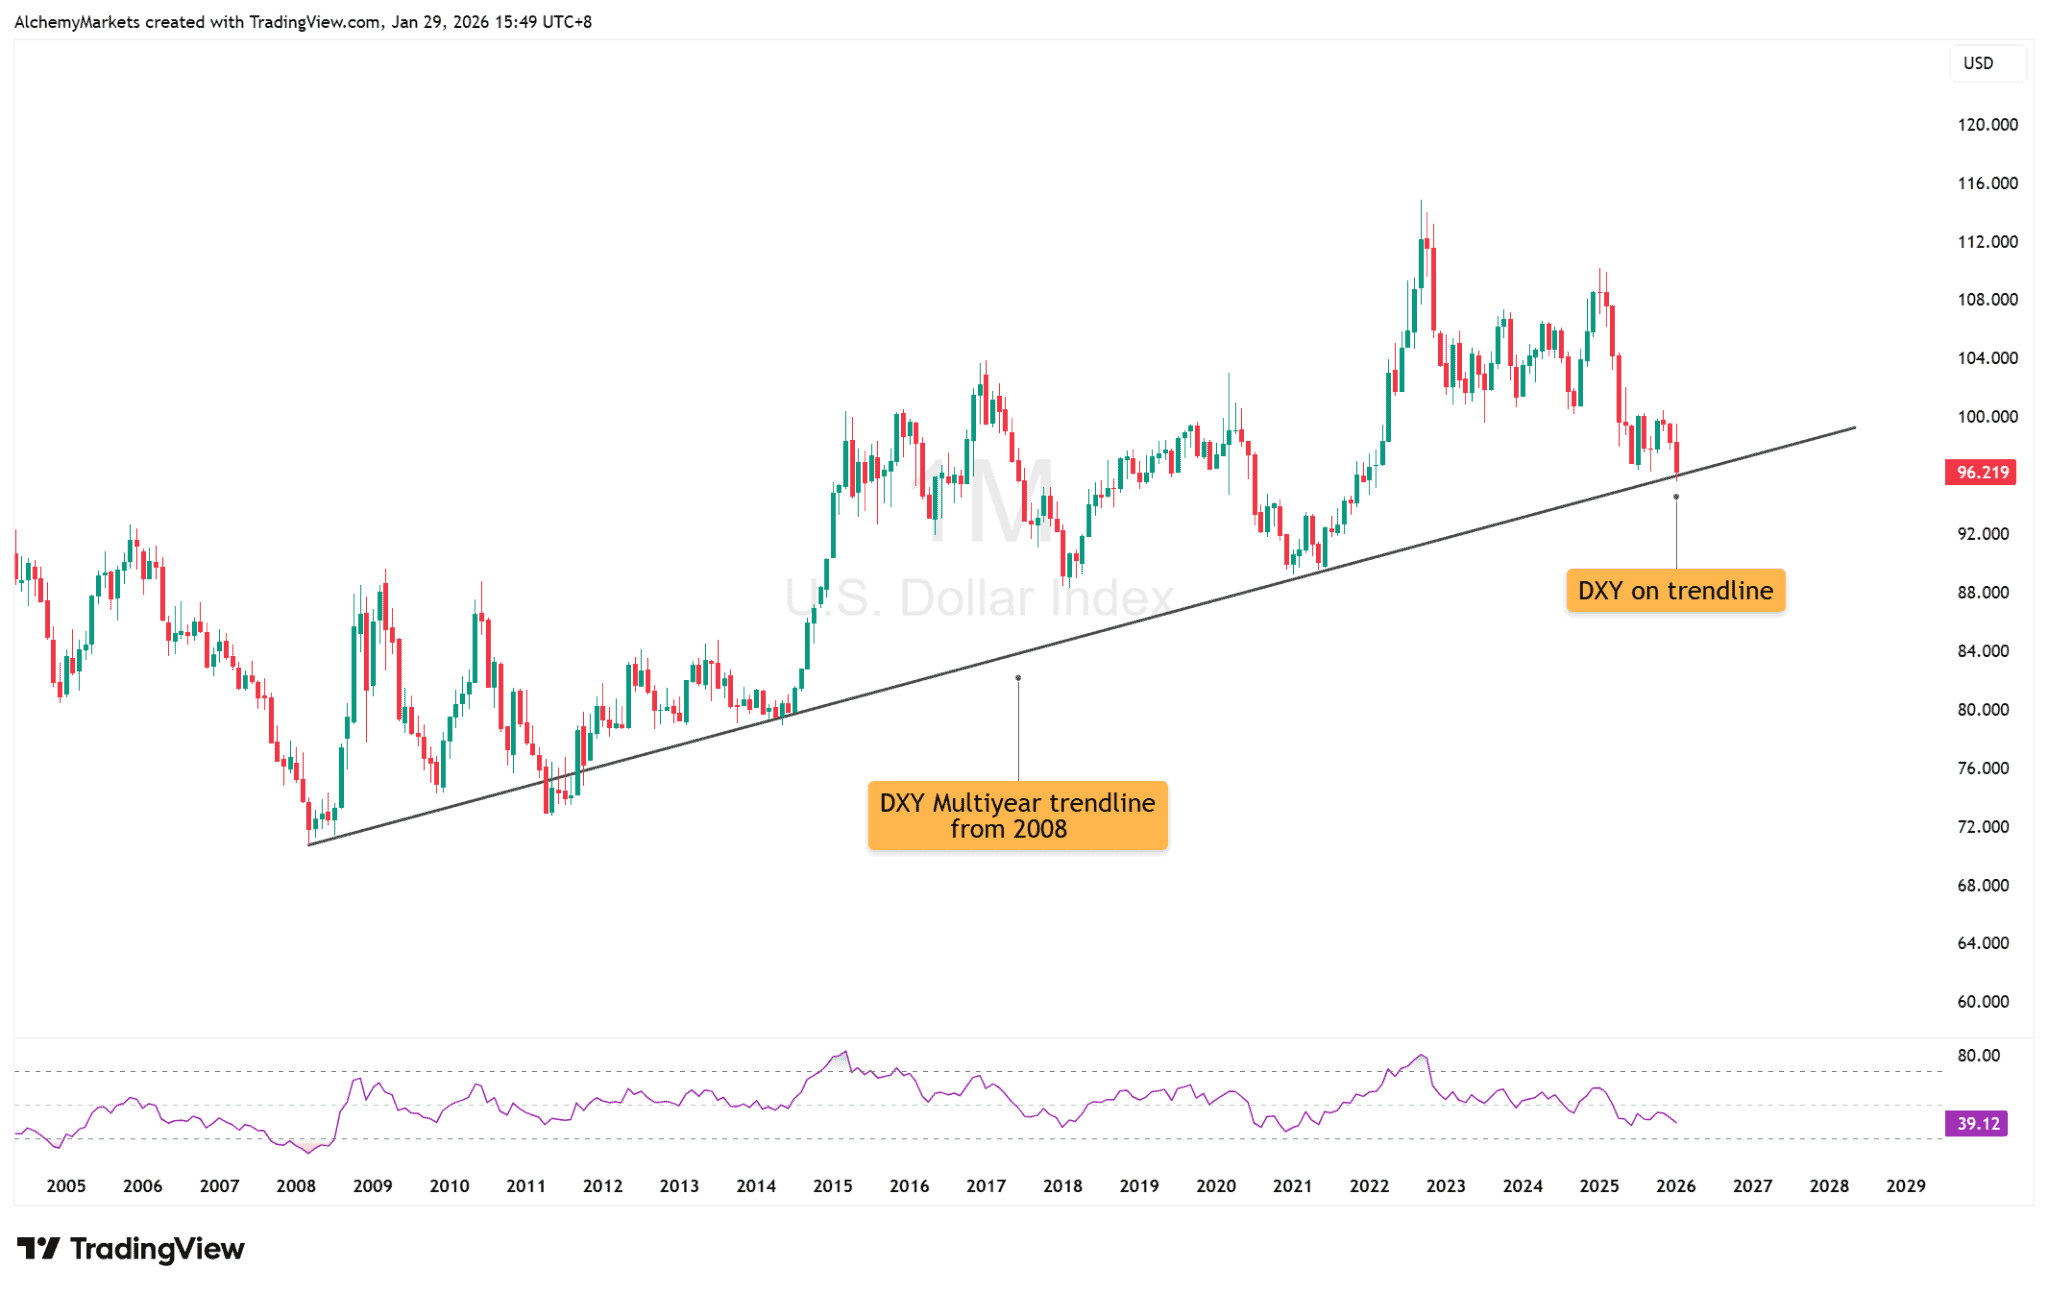
Could it be? DXY falls back onto a 2008 Trendline
DXY has slid back into a long-term monthly trendline area that’s acted as a structural “floor” before.
This is still a test, not a breakdown.
What matters next:
- A clean weekly close below that support zone is what turns this into a true structural failure.
- If DXY holds and rebounds, that’s your first warning that “everyone short USD” may be getting squeezed.
This is exactly the kind of spot where sentiment can be correct long-term, but traders get punished short-term.
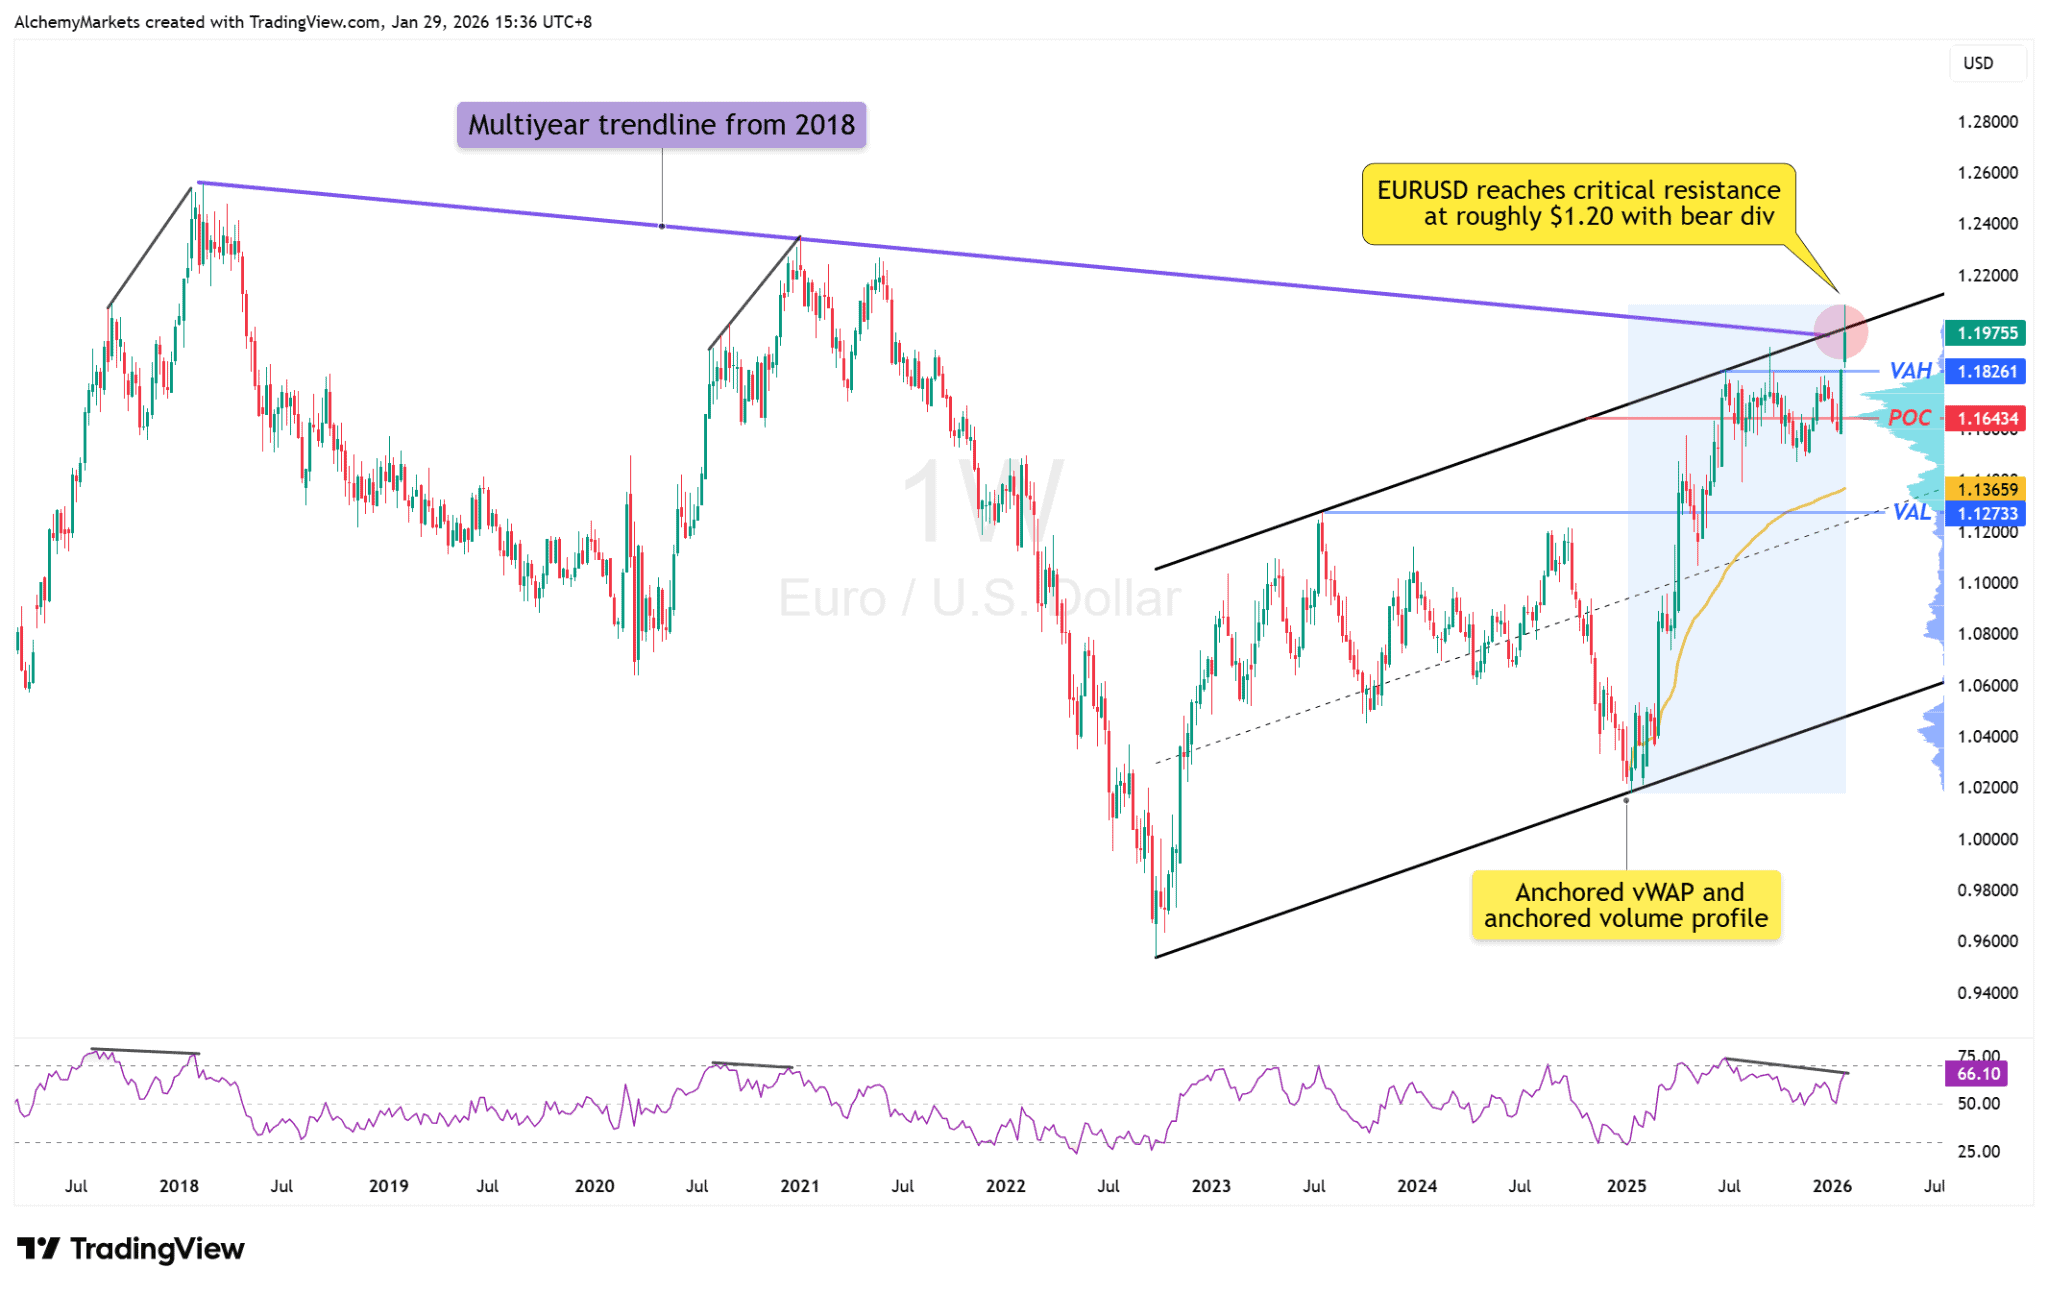
EURUSD Signals a Cooloff Period (USD Gaining Some Strength)
EUR/USD is pressing into a stacked resistance cluster:
- the 1.20 psychological zone
- a multi-year trendline
- channel alignment
- and a bearish weekly RSI divergence signal
That mix usually produces at least a cool-off / pullback, even if the longer-term bias stays bullish EURUSD (bearish USD). If EURUSD rolls over, it’s the cleanest “risk-on USD bounce” you’ll get without guessing.
Key idea: EURUSD stalling here, means that DXY can breathe.
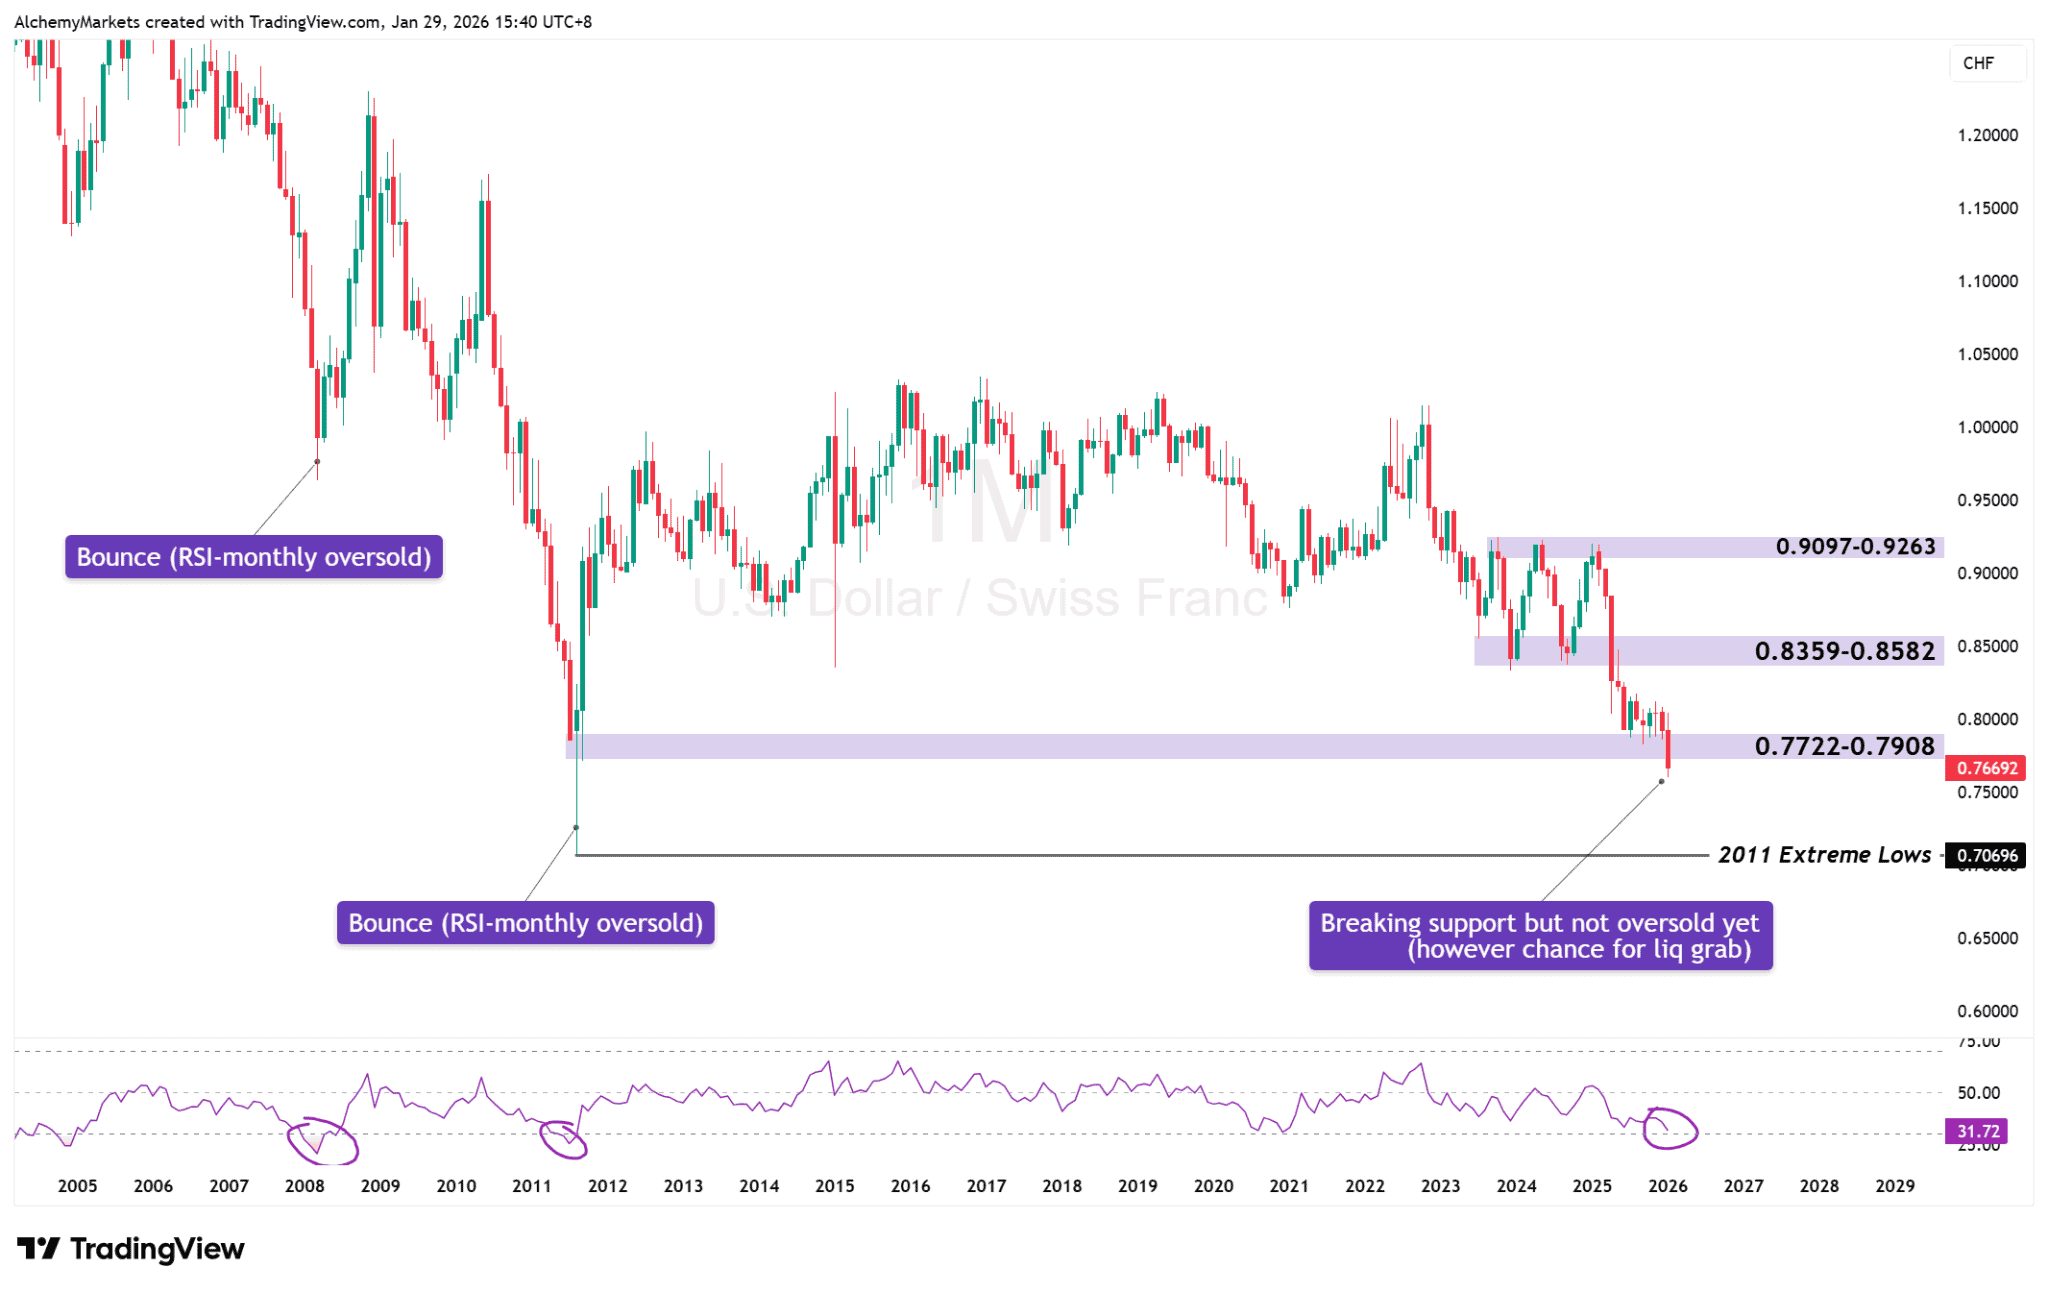
USDCHF is Also Trading at Extremes
USD/CHF is one of the purest “USD pessimism” expressions. When it hits extreme zones, two things tend to happen:
- downside progress slows (because the trade is crowded)
- volatility rises (because tiny catalysts force repositioning)
So even if USD weakness continues, this is a zone where you stop expecting smooth continuation.
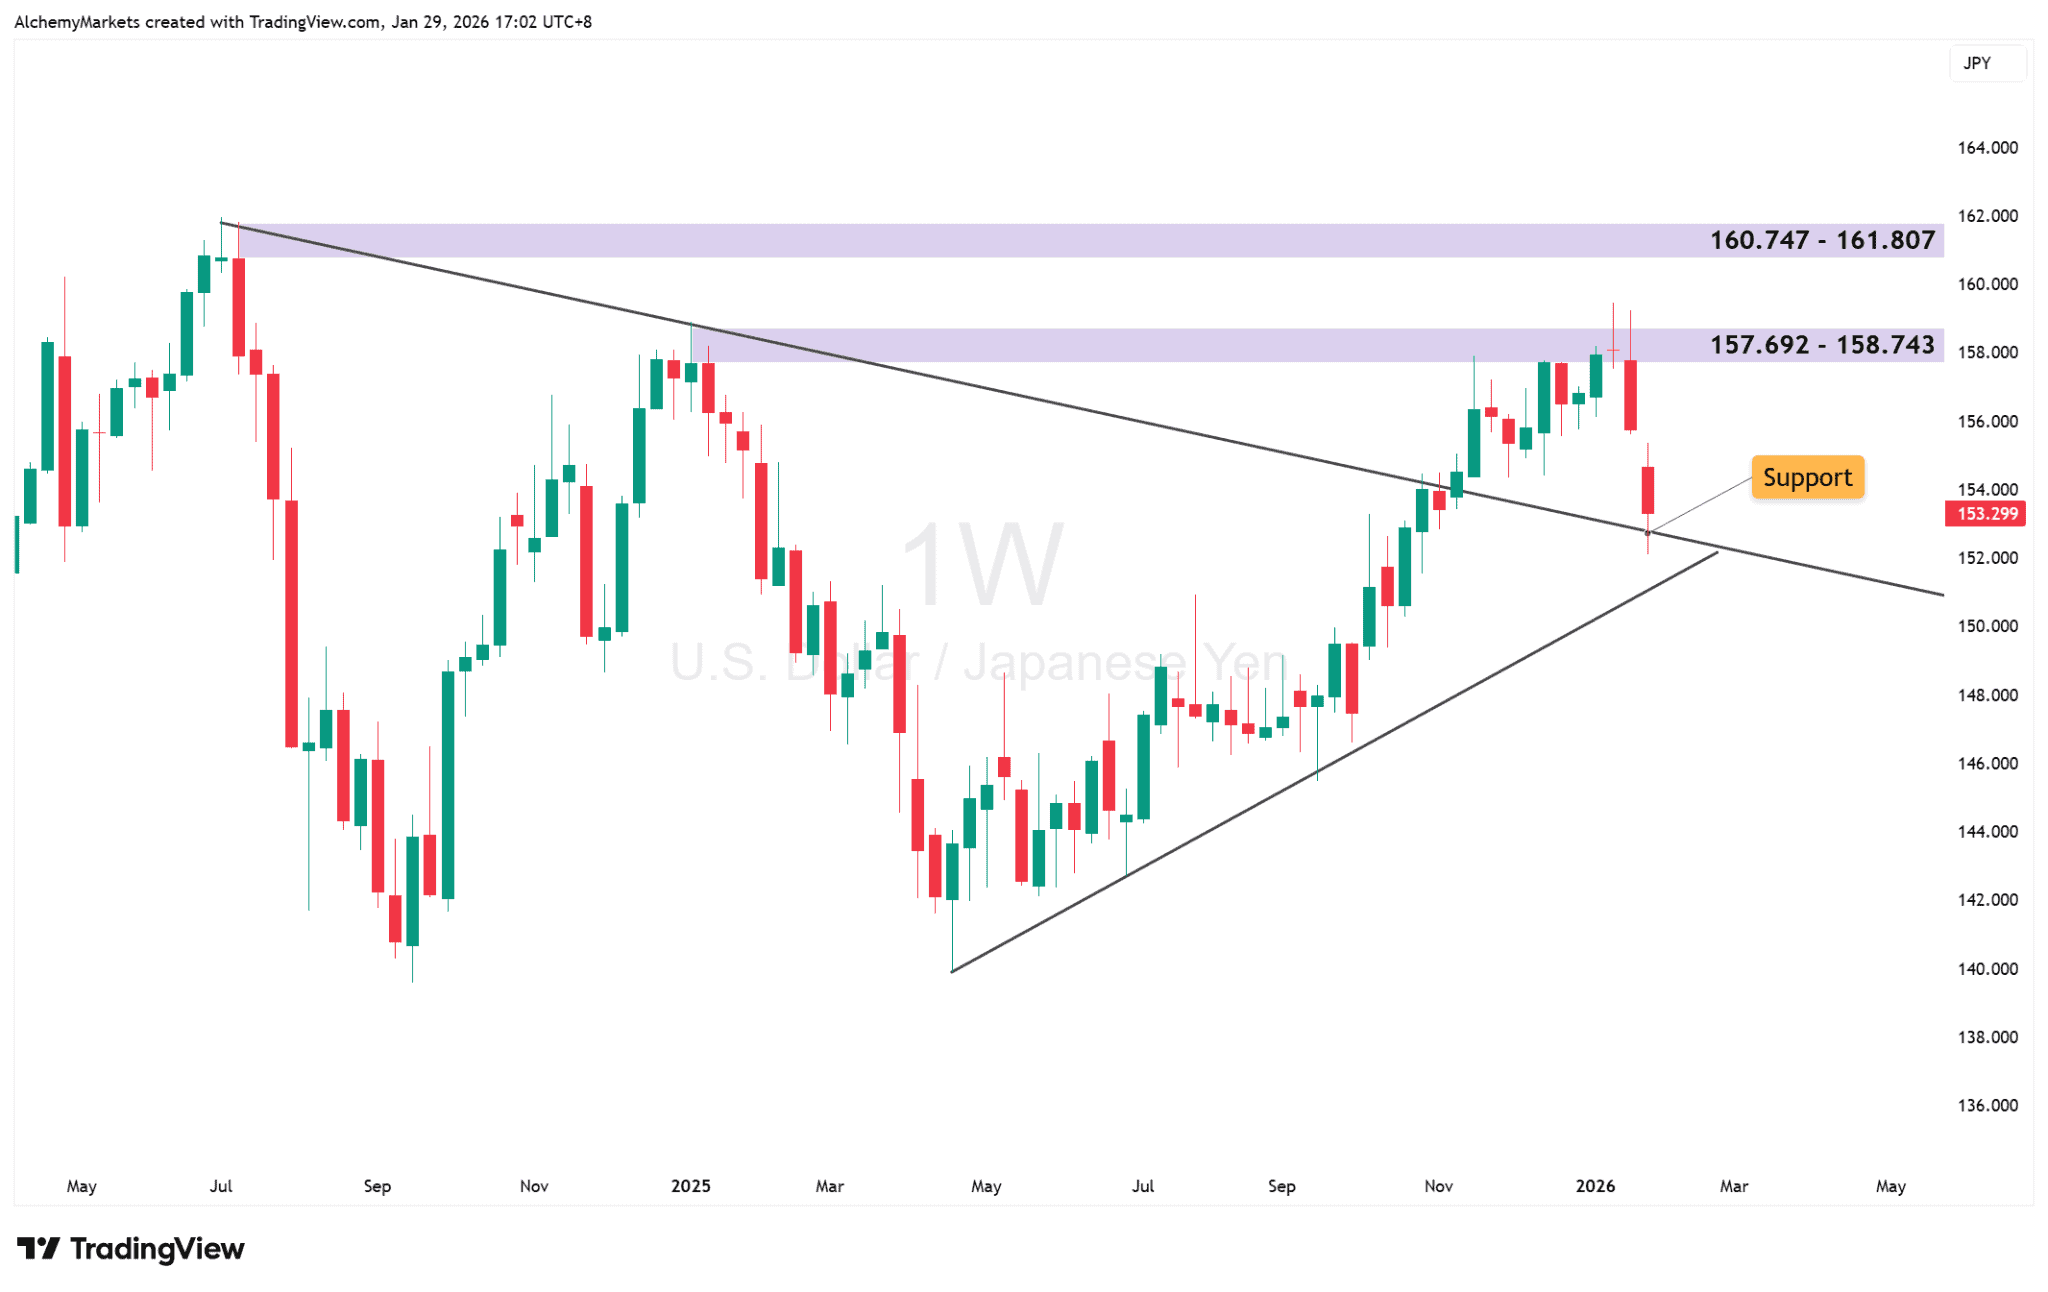
USDJPY: The Pressure Point for a USD Reversal
USDJPY is where macro theory meets reality. If there’s going to be a meaningful USD squeeze, this pair will almost certainly be involved.
On the weekly chart, USDJPY is reacting around a major structural pivot. Price previously is now pulling back into a former resistance zone that’s attempting to act as support around 151-153.
For now, the price has created a wick at this support level; signalling that USDJPY could at least pause here a little before accelerating lower.
If this support holds:
A rotation higher becomes plausible, with upside targets back into the prior supply zones:
- 157.7–158.7
- then 160.7–161.8
That wouldn’t signal a “new USD bull market”. It just signals a crowded-trade unwind, given how everyone right now is yelling from the hilltop about Yen Carry unwind, and USD bearish.
BOJ Policy Decision
The next Bank of Japan policy decision is on 18–19 March 2026.
Street expectations are fairly aligned:
- No rate hike in March
- Focus on guidance, tone, and any hint of follow-through later in 2026
- Continued preference for jawboning and tactical signalling over immediate, heavy FX intervention
In other words, the BOJ meeting is unlikely to be the cause of the move. It’s more likely to be the excuse, after price has already chosen direction.
That’s why USDJPY should be treated as a leading indicator, not a lagging reaction trade. Watch the level. Let positioning and price do the talking.


