- Opening Bell
- January 16, 2025
- 4 min read
CPI Relief Boosts the Market: S&P 500, Nasdaq, Bitcoin Surges
CPI data came in yesterday with a marginal miss, but for the most part is aligned with forecasted values.
| Data Release | Actual | Forecast | Previous |
| Core CPI m/m | 0.2% | 0.3% | 0.3% |
| CPI m/m | 0.4% | 0.4% | 0.3% |
| CPI y/y | 2.9% | 2.9% | 2.7% |
- The Core CPI m/m came in at 0.2% rather than 0.3%, suggesting that inflation is slowing down but remaining sticky.
- The CPI y/y inflation came in at 2.9% as forecasted, 0.2% higher than the previous reading.
- If the Federal Reserve wishes to meet their inflation targets of 2.0%, they would need to hold rates.
So with all this data in mind, why the S&P 500, Nasdaq 100, Bitcoin, and Gold all close higher on Wednesday?
CPI Relief
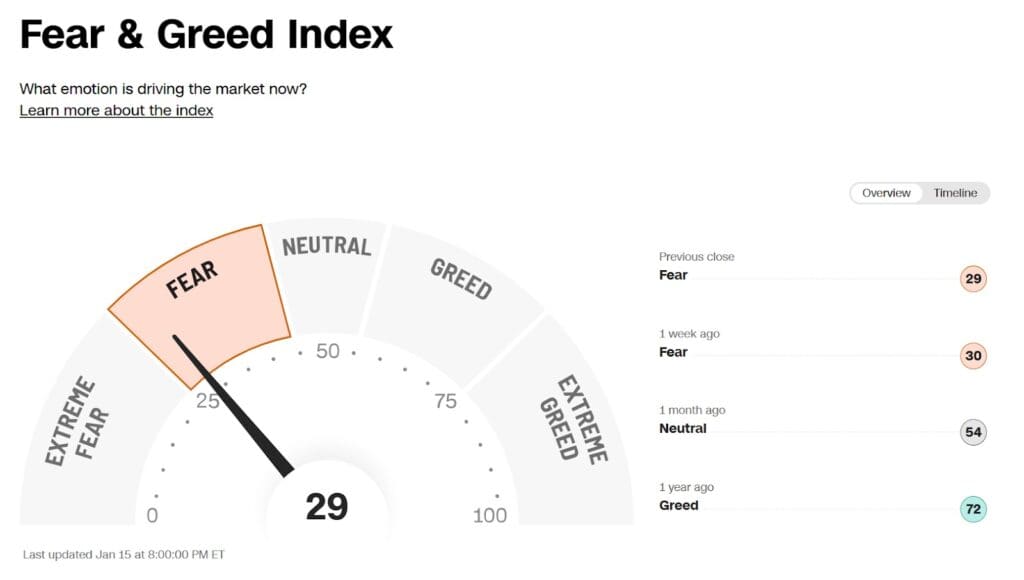
In a way, the CPI data was expected by the market, but also unexpected. Though forecasted values were reached, the markets were actually anticipating much worse (higher CPI), as reflected in the CNN Fear and Greed Index for the S&P 500.

After an inflation scare in December, the markets saw a sell-off on the S&P 500, Nasdaq, and Bitcoin. This precedence sets for a negative outlook going into January, with the index clocking in at 30 (FEAR) just last week.
This reflects the bearish sentiment of market participants, which turned a lack of surprises into relief.
So, the next question is: Are the markets going to resume a broader uptrend now?
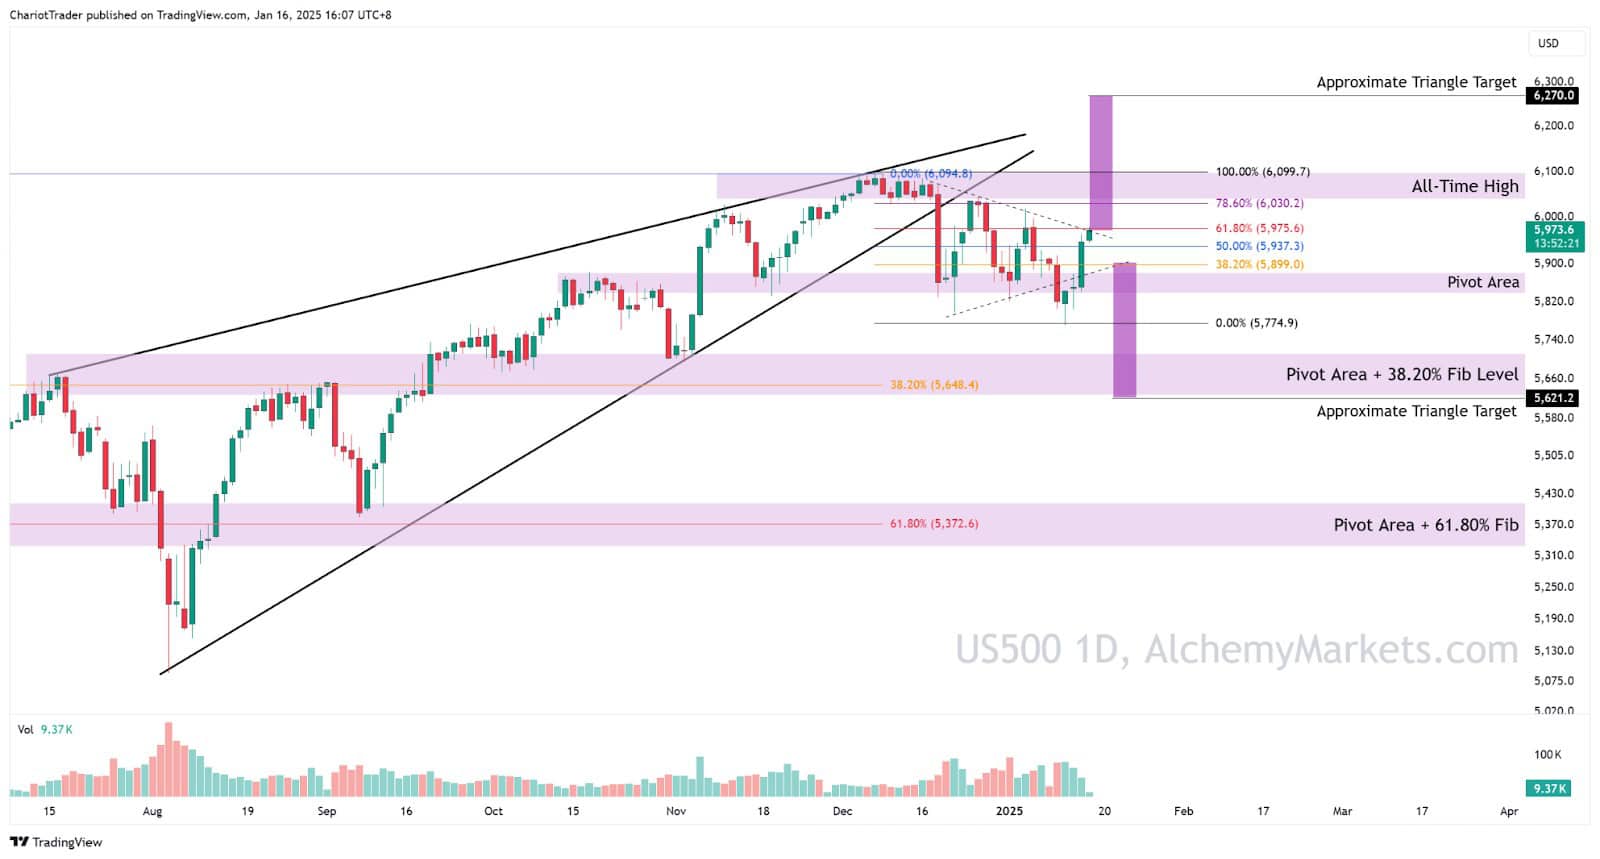
S&P 500 Analysis (US500) — Jan 16th 2025

The S&P 500 has reclaimed its symmetrical triangle pattern after briefly breaking lower on Jan 10. A daily close above ~$5,970 could signal a higher likelihood of bullish continuation. The updated measured move target for the pattern is ~$6,270, while downside risks align closely with the 38.2% Fibonacci Retracement at ~$5,621.
Key resistance lies around:
- 61.80% Fib Level at ~$5,975
- 78.60% Fib Level at ~ $6,030
- All-Time-High Consolidation at ~$6,100
The price could test the 78.60% Fib Level at around $6,030, see a rejection, then find its footing at the upper trendline of the triangle before continuation. A decisive break above the All-Time High could significantly increase the chances of reaching $6,200–$6,300.
With all that being said, the price is currently at technical resistance (61.80% Fib and upper trendline of Triangle).
Nasdaq 100 Analysis (USTEC) — Jan 16th 2025

Nasdaq 100 has seen a descending consolidation from December, and is now seeing a test of the 50.0% Fib Retracement at ~$21,311.39, which aligns closely with a descending trendline. A daily close above this level and the trendline would suggest upside for the Nasdaq in the coming days into key resistances.
Key resistance lies around:
- 50.00% Fib Level at ~$21,311.39
- 61.80% Fib Level at ~$21,507.16
- 78.60% Fib Level at ~$21,785.88
- All-Time-High at ~$22,142.19
If the price gets rejected here, the July ‘24 High at ~$20,762 could provide some support – but note that it has already been tapped into 3 times, making it a weak support level.
Should a further decline happen, the 50.00% Fib Support at $19,690.50 would provide strong support, with the ultimate support being at $19,111.89 which aligns with a Daily Fair Value Gap.
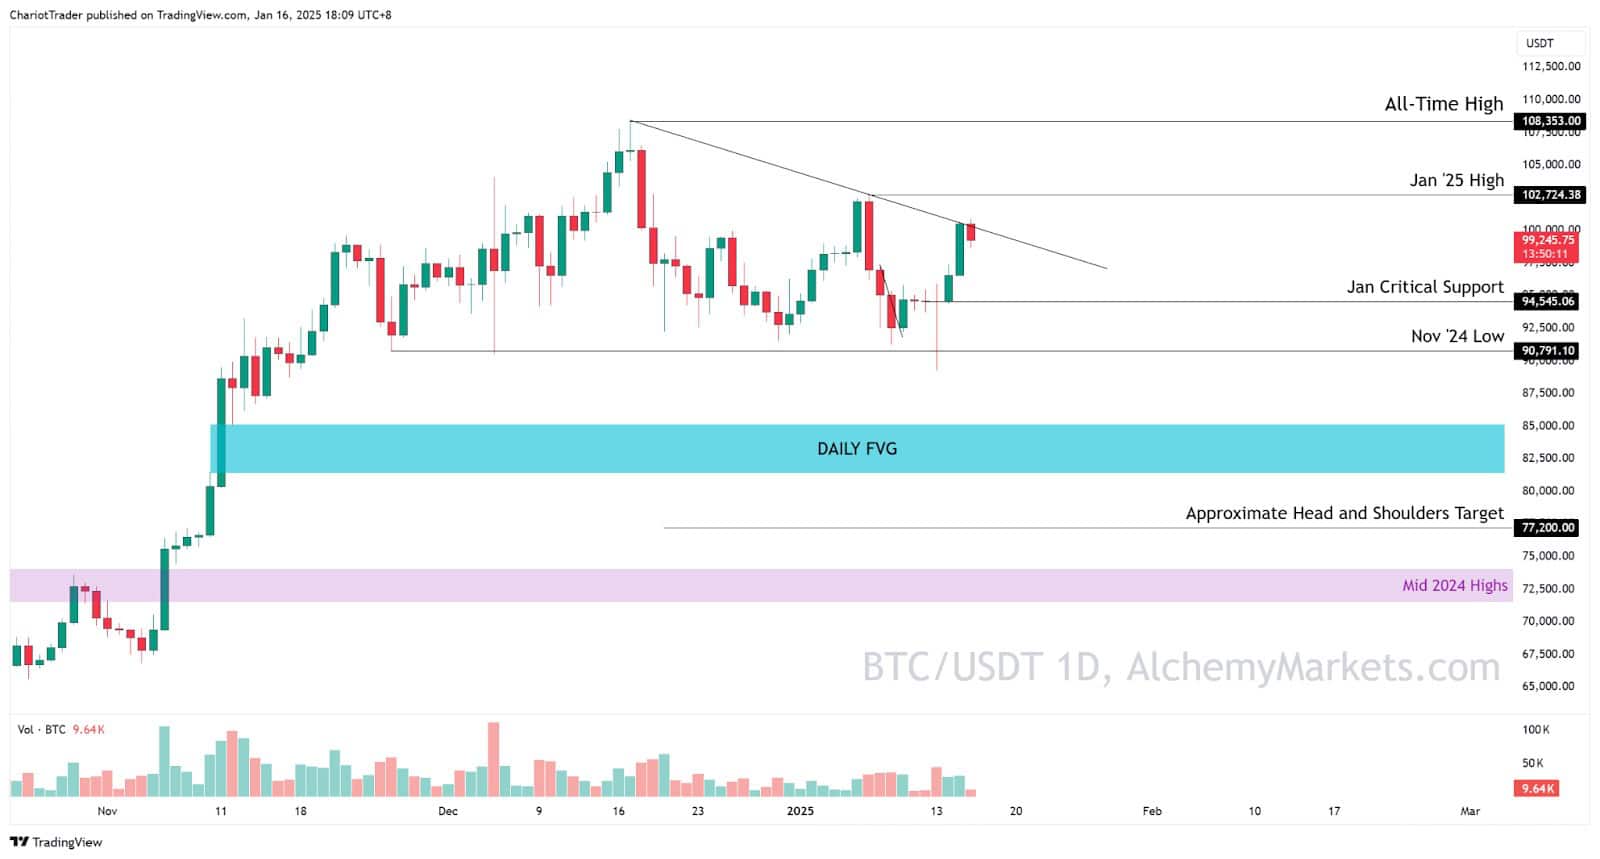
Bitcoin Analysis (BTC/USDT) — Jan 16th 2025

Bitcoin has seen a rally since tapping its November ‘24 Lows at ~$90,791, two days before the CPI data release. On Wednesday, the day of the CPI data itself, the price of Bitcoin surged by 4.14% and tapped into a descending trendline at ~$100,800. A close above this level could see Bitcoin test key resistances above.
Key resistance lies around:
- Current Resistance (Trendline) at ~$100,800
- Jan ‘25 High at ~$102,724
- All-Time High at ~108,353
If Bitcoin is rejected from this point, we could drop lower to retest the critical support at $94,545 – where Bitcoin bulls defended for three days straight, just a few days ago.
If that level is broken, Bitcoin could retest the Nov’24 Low, either forming a double bottom, or breaking down, confirming the Head and Shoulders Pattern which has a measured move target to ~$77,200.
However, before that price is reached, a fair value gap between ~$81,395 to ~$85,163 could provide support to the Bitcoin price, potentially serving as the launchpad for Bitcoin to rally to new All-Time-Highs.
You may also be interested in:


