


- Elliott Wave
- January 14, 2025
- 2 min read
Gold Elliott Wave: Wave 4 Takes Center Stage
Executive Summary
- Trend Bias: Gold (XAUUSD) has completed Wave 3 and is now undergoing a Wave 4 correction.
- Key Levels: Support zones to watch include $2,300 and $2,400 (previous 4th wave).
- Alternate Count: A potential triangle formation in Wave 4 (red labels) could lead to a shallower consolidation before Wave 5 resumes.
Current Elliott Wave Analysis
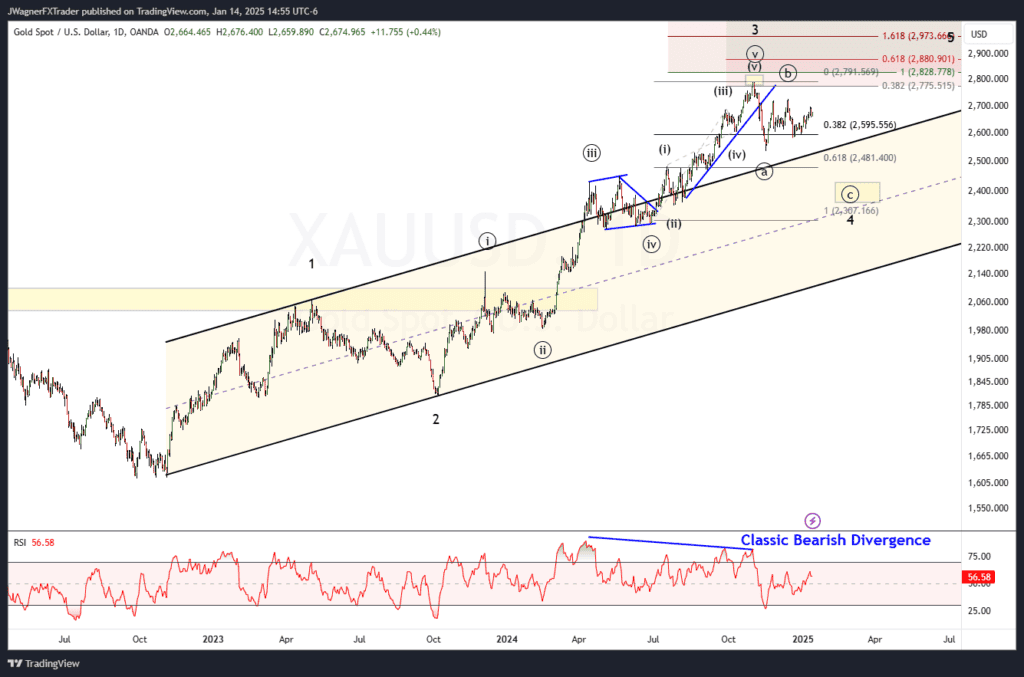
Gold’s price action confirms that Wave 3 has peaked, and a Wave 4 decline is in progress. Back in January, after a secondary peak, we forecasted an additional decline that has struggled to take hold. We are anticipating a sharp decline in wave ((c)) of 4 to reach the previous fourth wave low near $2300-$2400.
We are also keeping an eye on an alternate count that calls for a shallower retracement.
Alternate Count (Triangle Scenario)
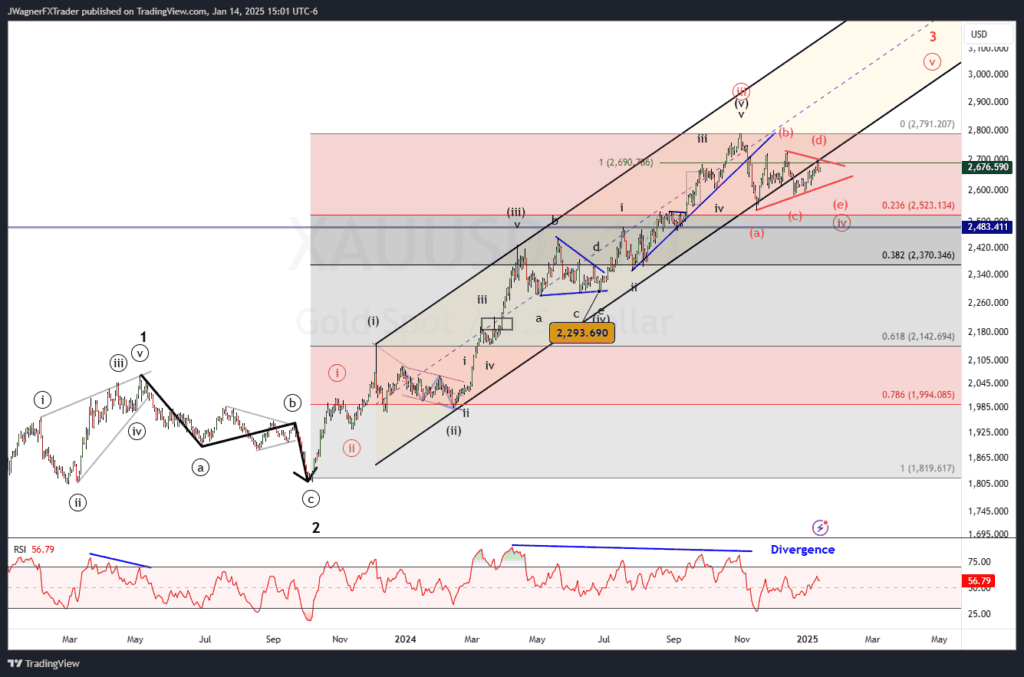
The inability of gold prices to break down is hinting that a symmetrical triangle pattern may be underway. Therefore, we can present a valid alternate count, where Wave ((iv)) is unfolding as a contracting symmetrical triangle (red labels). This scenario implies:
- Gold will trade sideways within a contracting range (labeled (a)-(b)-(c)-(d)-(e) in red).
- A short-term top may develop at or near Friday January 10 highs in wave (d)
- Support should hold above the wave (c) low of $2,583.92, limiting downside potential.
- Wave (e) likely declines to near $2630 to finalize the triangle of wave ((iv))
- The final Wave 5 breakout occurs after triangle completion, targeting above $2,800.
This triangular consolidation would indicate that selling pressure is fading, setting up the final bullish move.
Bottom Line
Gold is firmly in a Wave 4 correction, with support between $2,300 and $2,630 acting as key downside targets. If the alternate triangle count holds, a sideways consolidation will precede Wave 5 rather than a deep correction. Watch for a decisive break to confirm the next bullish leg.
You might also be interested in:


