- Elliott Wave
- December 17, 2024
- 3 min read
Triangle Pattern Complete for Crude Oil? (Elliott Wave)
Executive Summary
- Crude oil volatility collapses as price hovers near a support shelf
- Current Elliott wave pattern is bearish with targets below $64
- A rally above $71.38 will cause us to reconsider the pattern at play
Crude Oil Volatility Deadens
Crude oil is trying to lull investors to sleep.

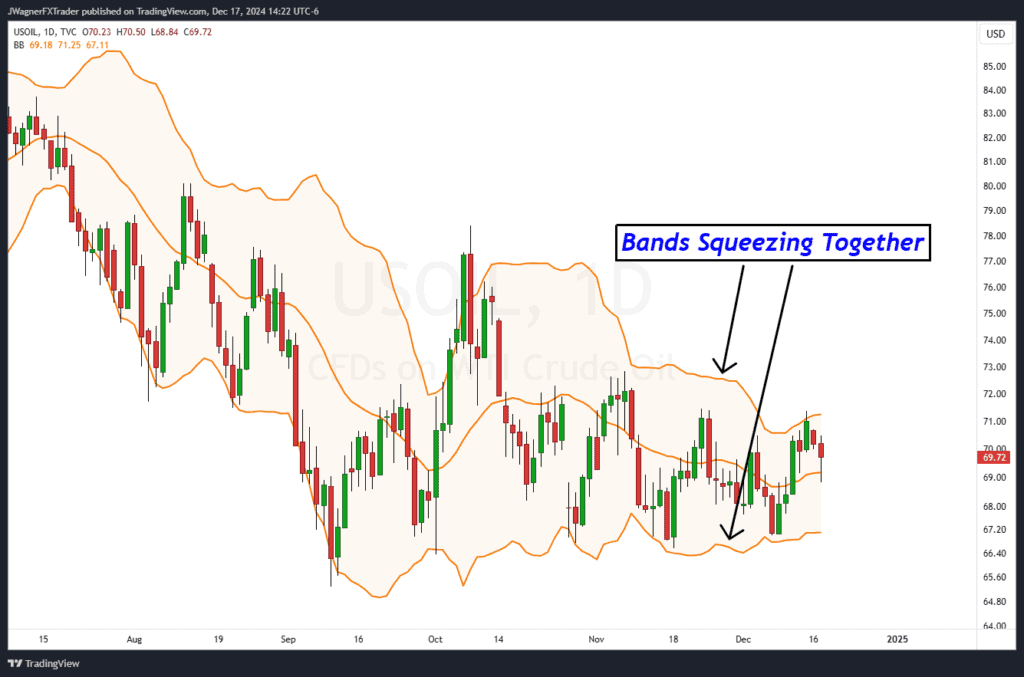
The daily price chart with Bollinger Bands® study illustrates a tightening range as the bands squeeze closer and closer together. This squeezing of the bands means volatility is deadening for crude oil. Eventually, volatility will expand again and when it does, a directional breakout is likely to appear.

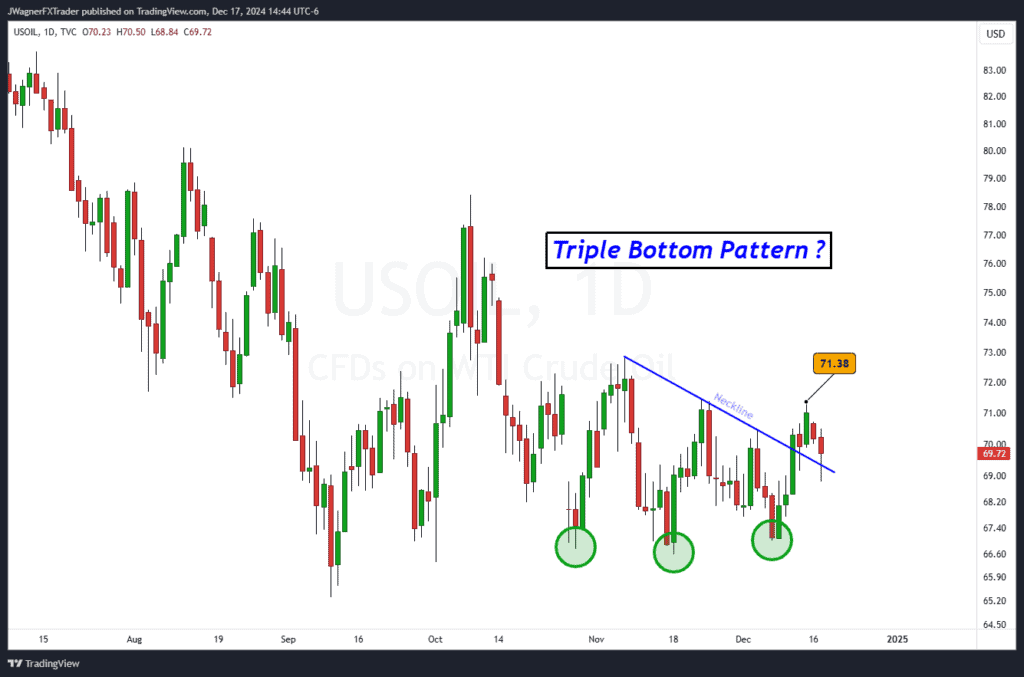
Some traders may view the triple bottom bottom and support shelf for crude oil to signal the potential for a bullish breakout. Of course, that is possible and begins to build more credibility on a break above the recent high at $71.38.
However, our bias is towards a bearish break of support when using Elliott wave.
Crude Oil Elliott Wave Analysis

Our last crude oil report from November was anticipating a mild rally, then decline in price.
Since November, price hasn’t moved that much as indicated in the daily charts above.
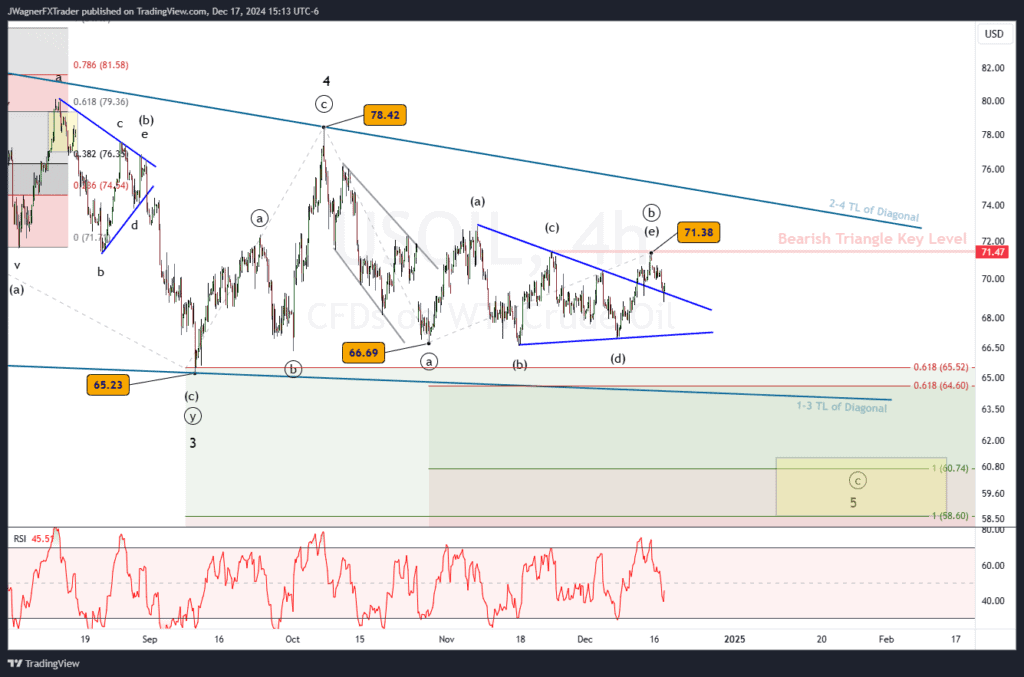
From an Elliott wave perspective, I’m viewing recent price action as a descending triangle where the next move is a break lower. The triangle is viewed as wave ((b)) of a bearish zigzag. Therefore, once the triangle is completed, then a trend lower in wave ((c)) is anticipated.
It does appear that the minimum waves are in place for the bearish descending triangle to be completed. Therefore, a break down below today’s low may be an early warning dashboard signal of additional declines.
This bearish zigzag is counted as wave 5 of an ending diagonal pattern. As the name states, the ending diagonal is the final wave of a larger pattern. In this case, the ending diagonal is like a falling wedge that signals a bullish turn is likely from lower levels.
Ending diagonal patterns have specific rules and guidelines regarding their shape and structure. A breakdown is likely to retest $64 with wave relationships near $60.75. The maximum decline under this pattern is $58.60. If crude oil does fall lower than $58.60, then we’ll need to reconsider the pattern it is carving.
Bottom Line
It appears that a descending triangle pattern finished this week and a decline is underway to new lows.
Downside targets include $60.75. If this week’s high of $71.38 is broken, then we’ll need to reconsider the pattern at play.
You might also be interested in:


