


- Elliott Wave
- December 13, 2024
- 3 min read
Gold Can’t Catch a Break (Yet) [Elliott Wave Gold]
Executive Summary
- Gold appears trending lower in wave ‘c’ of a bearish zigzag
- The larger degree pattern has gold declining in minor wave 4
- A decline to $2300-2400 appears higher probability
Gold’s Decline is Incomplete
Our previous forecast from October 31 proved timely. In it, we forecasted a completed Elliott wave 5th wave and that a decline to $2600-$2650 was higher probability.
“From there [$2600-$2650], the two Elliott wave models shared diverge with the first one calling for additional declines to $2400 while the latter calls for a rally to new highs above $2800.” – Gold’s Price Losing Shine, October 31
Gold’s price did embark on a decline from October 30 to November 14 drawing the price down to $2536. From there, a rally began and it became clearer which Elliott wave model to favor.
Current Elliott Wave Count
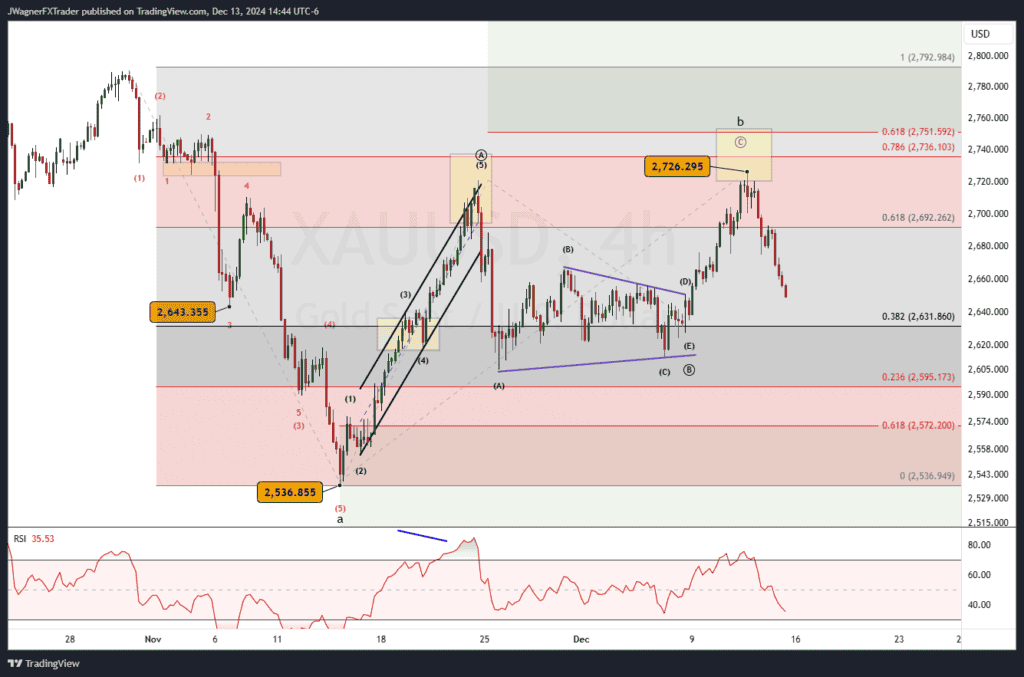
Based on the shape of the rally from $2536, it classifies best as a bullish zigzag with the b-wave as a symmetrical triangle. The rally in the c-wave then forms a double top leaving behind a 3-wave corrective advance.
As a result, the entire advance from $2536 to the $2726 double top high is labed as wave ‘b’ or a larger zigzag pattern.
This implies that wave ‘c’ of the larger degree bearish zigzag likely carries down to below $2536, perhaps pushing even lower to the target of $2400 we identified on October 31.
A break below $2634 would suggest the wave ‘b’ is in place and that gold may trend below $2536.
With wave ‘a’ and ‘b’ in place, we can use the Fibonacci extension tool to estimate the target for wave ‘c’ of the zigzag.
The Larger Degree Elliott Wave Count
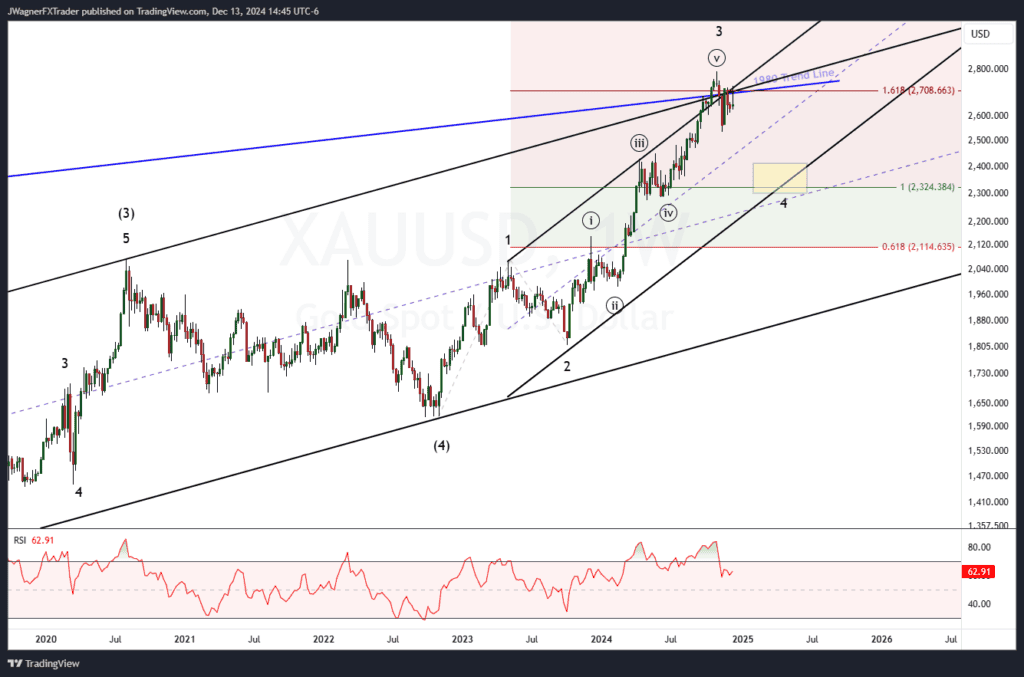
The high from the last week of October carved a bearish weekly pattern like a shooting star or bearish pin bar.
The top in October appears to be a completed wave from the October 2023 low. There were a few things going on at the $2800 price intersection.
- A trend line from 1980 was passing through the area.
- Minor wave 3 would be about 161.8% the length of minor wave 1
If minor wave 3 is complete, then we can anticipate the depth of minor wave 4 using the Fibonacci retracement tool. Measure out the length of wave 3 and anticipate a decline to the 38.2% Fibonacci level. This support level appears near $2363.
Additionally, we have the previous wave ((iv)) in the $2277-2431 price zone. So, we have a couple pieces of evidence suggesting that the gold decline is incomplete and may work down to $2300-$2400.
Bottom Line
The decline in gold’s price appears incomplete. We are anticipating prices will continue to fall while below $2726 reaching $2300-$2400.
You might also be interested in:


