- Elliott Wave
- January 17, 2025
- 2 min read
Crude Oil Elliott Wave: Topping Off The Tank
Executive Summary
- The current bullish trend for Crude Oil may be nearing the completion of a corrective rally.
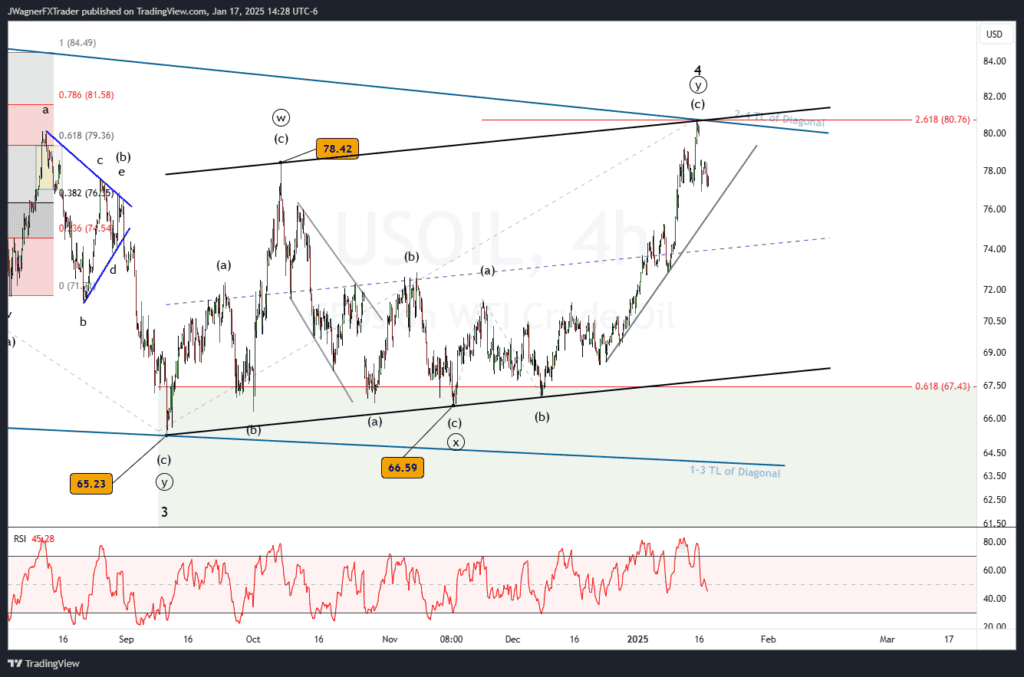
- Key resistance lies near $80.76, with Fibonacci extensions pointing this area as a possible upside target.
- A break below the grey trendline (near $76.50) would indicate a change in trend direction.
Current Elliott Wave Analysis

The Elliott wave analysis of Crude Oil on the 4-hour chart suggests that we are observing a double zigzag corrective rally labeled ((w))-((x))-((y)). From a higher degree perspective, the market appears to be in wave 4 of a larger five-wave cycle. This rally is likely completing the fourth wave of a “diagonal” formation, which is characterized by overlapping waves.
This makes the final wave higher ((y)) of 4. When wave 5 of the falling wedge pattern begins, it likely trends lower to retest $65 and possibly lower levels.
On the lower degree, the immediate movement could still have some room to run toward the upper boundary of the diagonal near $80.76. However, any price failure below the $76.50 (the grey upward sloping support trend line) would suggest a wave 4 top is in place and that wave 5 has begun.
Bottom Line
Crude oil appears to be placing the finishing touches on a corrective rally making for a larger wave 4 of a diagonal pattern. Once wave 4 is in place, then Crude oil prices would break below the grey support trend line signaling the beginning to wave 5. Wave 5 would trend lower and likely retest the $65 lows.
You might also be interested in:


