- Elliott Wave
- November 2, 2026
- 2 min read
AUD/USD Elliott Wave: Jumping from Triangle Low
Executive Summary
- Trend Bias: The AUD/USD pair is rallying within a larger uptrend that began in April 2025.
- Rally Target: Near 0.7277 – 0.7600.
- Key Support: Below .6893 and the daily triangle is void.
Aussie is rallying in the final stages of its impulse pattern that began April 2025. Several wave relationship targets appear between .7277 – .7600. According to the Elliott wave model we are following, once the final price is in place, AUDUSD would decline in a correction back to 0.70.
Current Elliott Wave Analysis
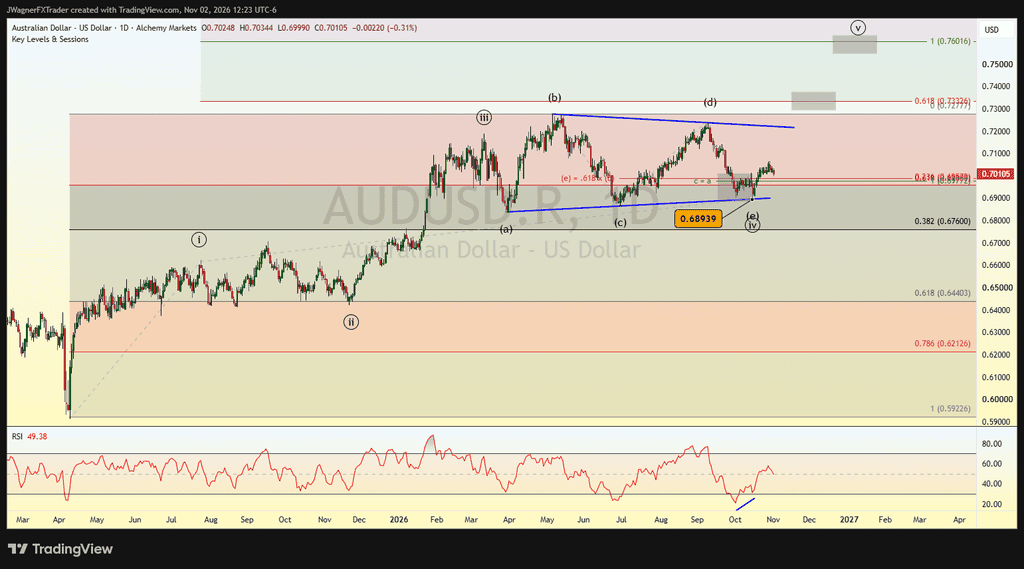
AUDUSD is in a mature rally on the daily chart and within wave ((v)), a terminal wave. This means the larger Elliott wave impulse pattern that began in April 2025 at .5913 is coming to end.
Wave ((iv)) appears as a triangle and looks to have ended at the .6893 low on October 15. There is nice RSI divergence running into the low that signals slowing momentum and the potential for a bullish trend change.
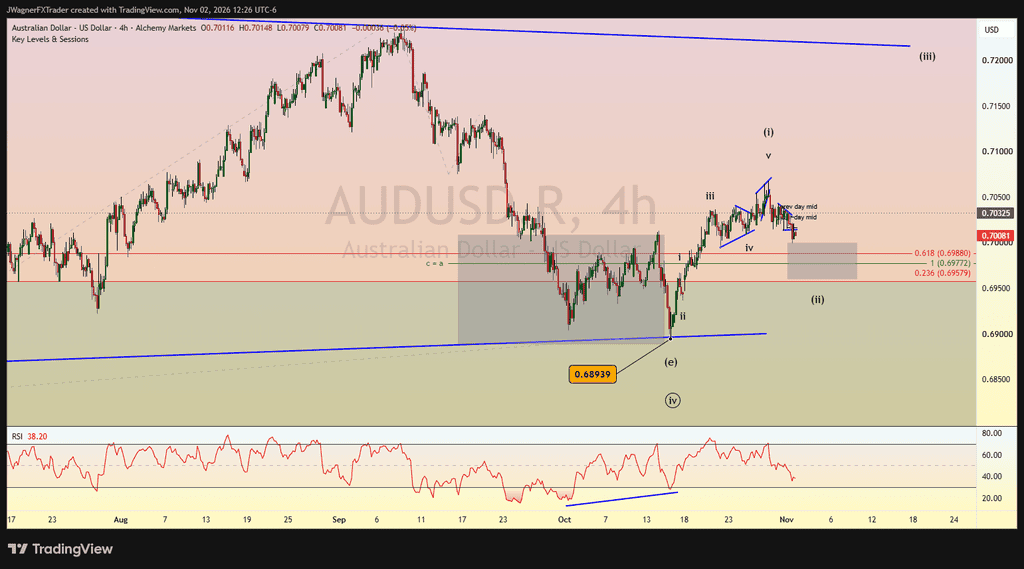
Zooming in on a 4 hour price chart, Aussie appears to be have completed wave (i) of ((v)) and the current decline is wave (ii).
We anticipate the current decline may terminate between .6960 – .7000 to finalize (ii).
Then, wave (iii) of ((v)) would be a strong push to .7200 and possibly .7300.
For wave ((v)), there are several wave relationships that appear between .7277 – .7600. Therefore, we suspect some resistance will begin to appear as Aussie tops leading to its next correction.
Here are some wave relationships so you can see them clustered together:
Wave (b) of ((iv) high → .7277
Wave ((v)) = .618 x ((i)) → .7333
Wave ((v)) = ((i)) → .7600
As a result, look for the rally in Aussie to start getting choppy if it reaches the levels above.
Bottom Line
AUD/USD appears to be in wave (ii) of ((v). After a brief dip to .6960 – .7000, AUDUSD may accelerate higher to .7200 and possibly .7300.
If AUDUSD declines below.6893, then we’ll need to reconsider that a more important top is already in place.