


Written by:

- Chart of the Day
- November 22, 2024
- 3 min read
Can S&P 500 Continue Higher in its Broadening Wedge Pattern?
The S&P 500 has recently seen a significant surge due to Nvidia’s better-than-expected earnings report, surprising the markets and pushing the index higher by 0.50% on Thursday.
With this positive earnings report, can S&P 500 continue higher after tapping the long talked about $6,000 price level?
Broader View Shows the S&P 500 In a Broadening Wedge
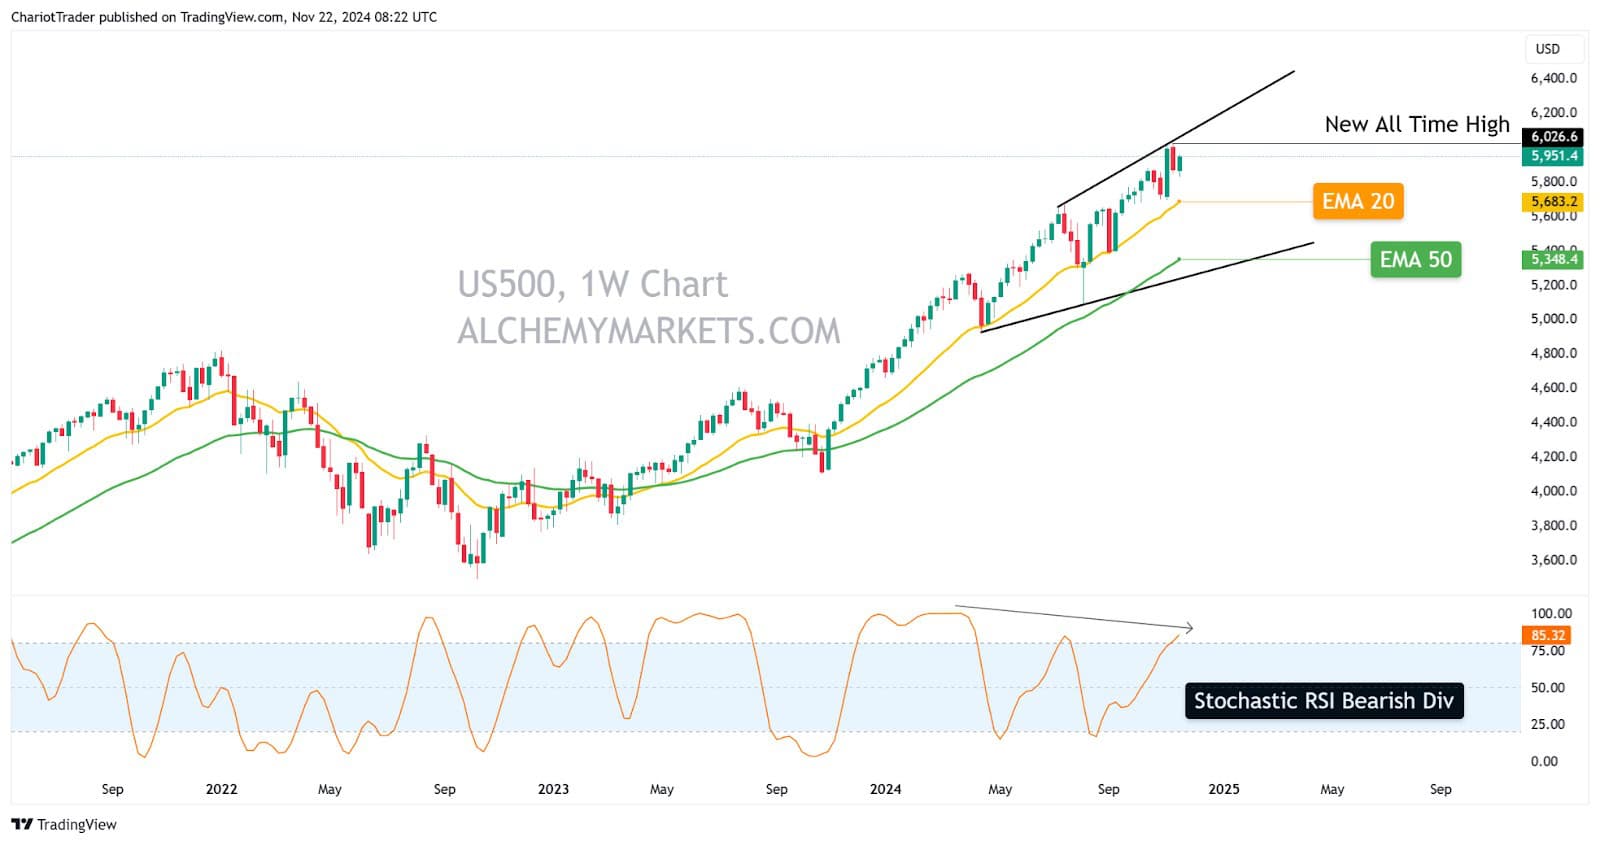
Despite the bullish year that 2024 has been for the S&P 500, the weekly chart shows a developing broadening wedge starting from April.
This highlights a possibility that S&P 500 could be temporarily topped out. If this is the case, then a retracement to the Weekly EMA 20 or EMA 50 is possible.
Lending more credibility to the broadening wedge idea, the Weekly Stochastic RSI is also signalling a bearish divergence – which is a sign of weakening bullish momentum.
| Alternative View: The S&P 500 is in a rising wedge pattern, also a bearish reversal pattern. |
Does the S&P 500 have technical reasons to drop lower?
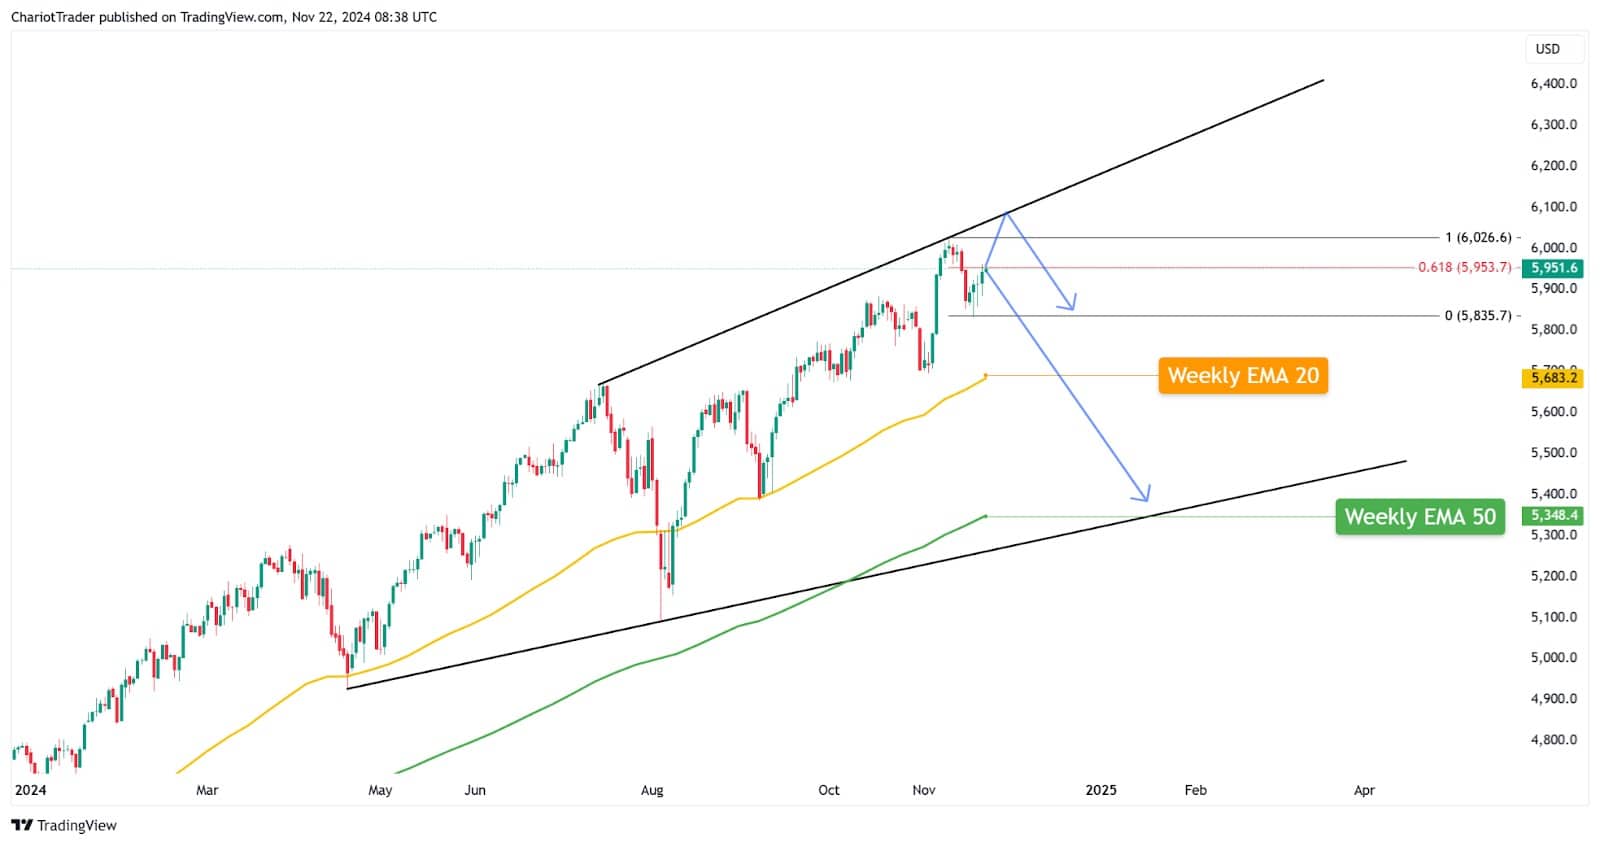
Going down to the daily timeframe, we can see a significant Bearish Fibonacci Retracement come into play. The 61.8% Fibonacci retracement is placed at $5,951.6, and is a major resistance level.
If the daily price is unable to close above this Golden Fibonacci retracement level, or closes above it then immediately loses it – it could spell some temporary downside for the index.
However, this is by no means calling for a major top on the S&P 500, as the index has several key support levels to break before traders begin to consider a prolonged downtrend:
- Weekly EMA 20 around $5,683.20
- Weekly EMA 50 around $5,348.40
- Lower Broadening Wedge Trendline around $5,350
If the daily price closes above $5,953.70 and holds above, then further continuation is likely – and the price could retest the upper trendline of the wedge at approximately $6,100 to $6,200.
Why the Nvidia Earnings Report isn’t As Bullish As You Think
Despite showing remarkable growth and EPS overshooting predictions by 8.66%, the Nvidia Earnings are not as bullish as you think. The last four earnings reports illustrate a clear slowdown in Nvidia’s growth, suggesting the company may be reaching a bottleneck in their growth.
This may incentivise investors to place their funds elsewhere, leading to a price decline on NVDA, which subsequently puts pressure on the S&P 500.
| Quarter | Year-over-Year Growth (Revenue) | Year-over-Year Growth (Net Income) |
| Q4 FY2024 (Jan 2024) | 265% | 769% |
| Q1 FY2025 (Apr 2024) | 261% | 780% |
| Q2 FY2025 (Jul 2024) | 122% | 174% |
| Q3 FY2025 (Oct 2024) | 94% | 109% |
We did an analysis on Nvidia Stock yesterday, which lays out possible scenarios for NVDA in the coming days.
Closing Thoughts
- Nvidia’s earning reports may serve more as a cautionary sign, rather than a bullish one.
- S&P 500 is currently facing resistance at the 61.8% Fibonacci Retracement ($5,953.70).
- If the index closes above the level, a test of the upper trendline in the Broadening Wedge is possible ($6,100 – $6,200).
- If the index closes below, a test of the weekly EMA 20 would be critical in gauging the bullish trend’s strength.
You may also be interested in:


