


Written by:

- Chart of the Day
- January 9, 2025
- 3 min read
S&P 500 Not Looking Good: Rising Wedge with More RSI Downside
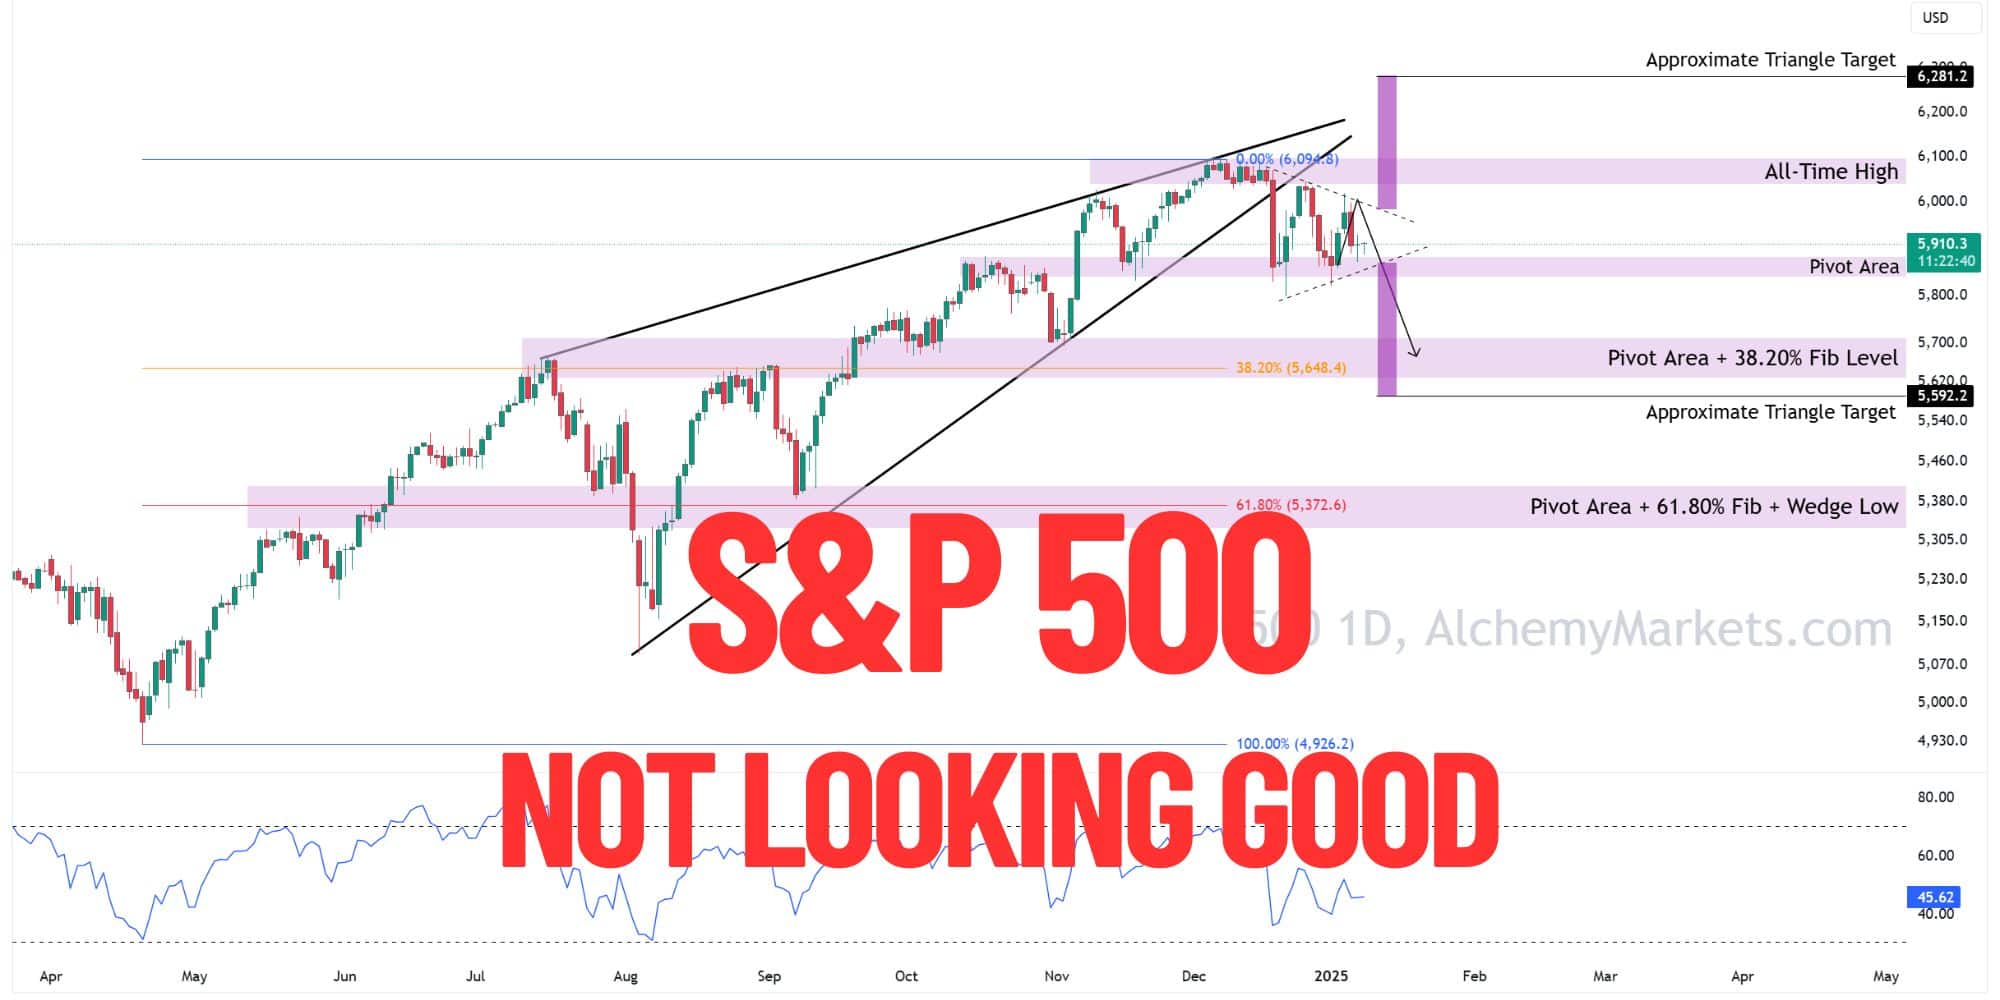
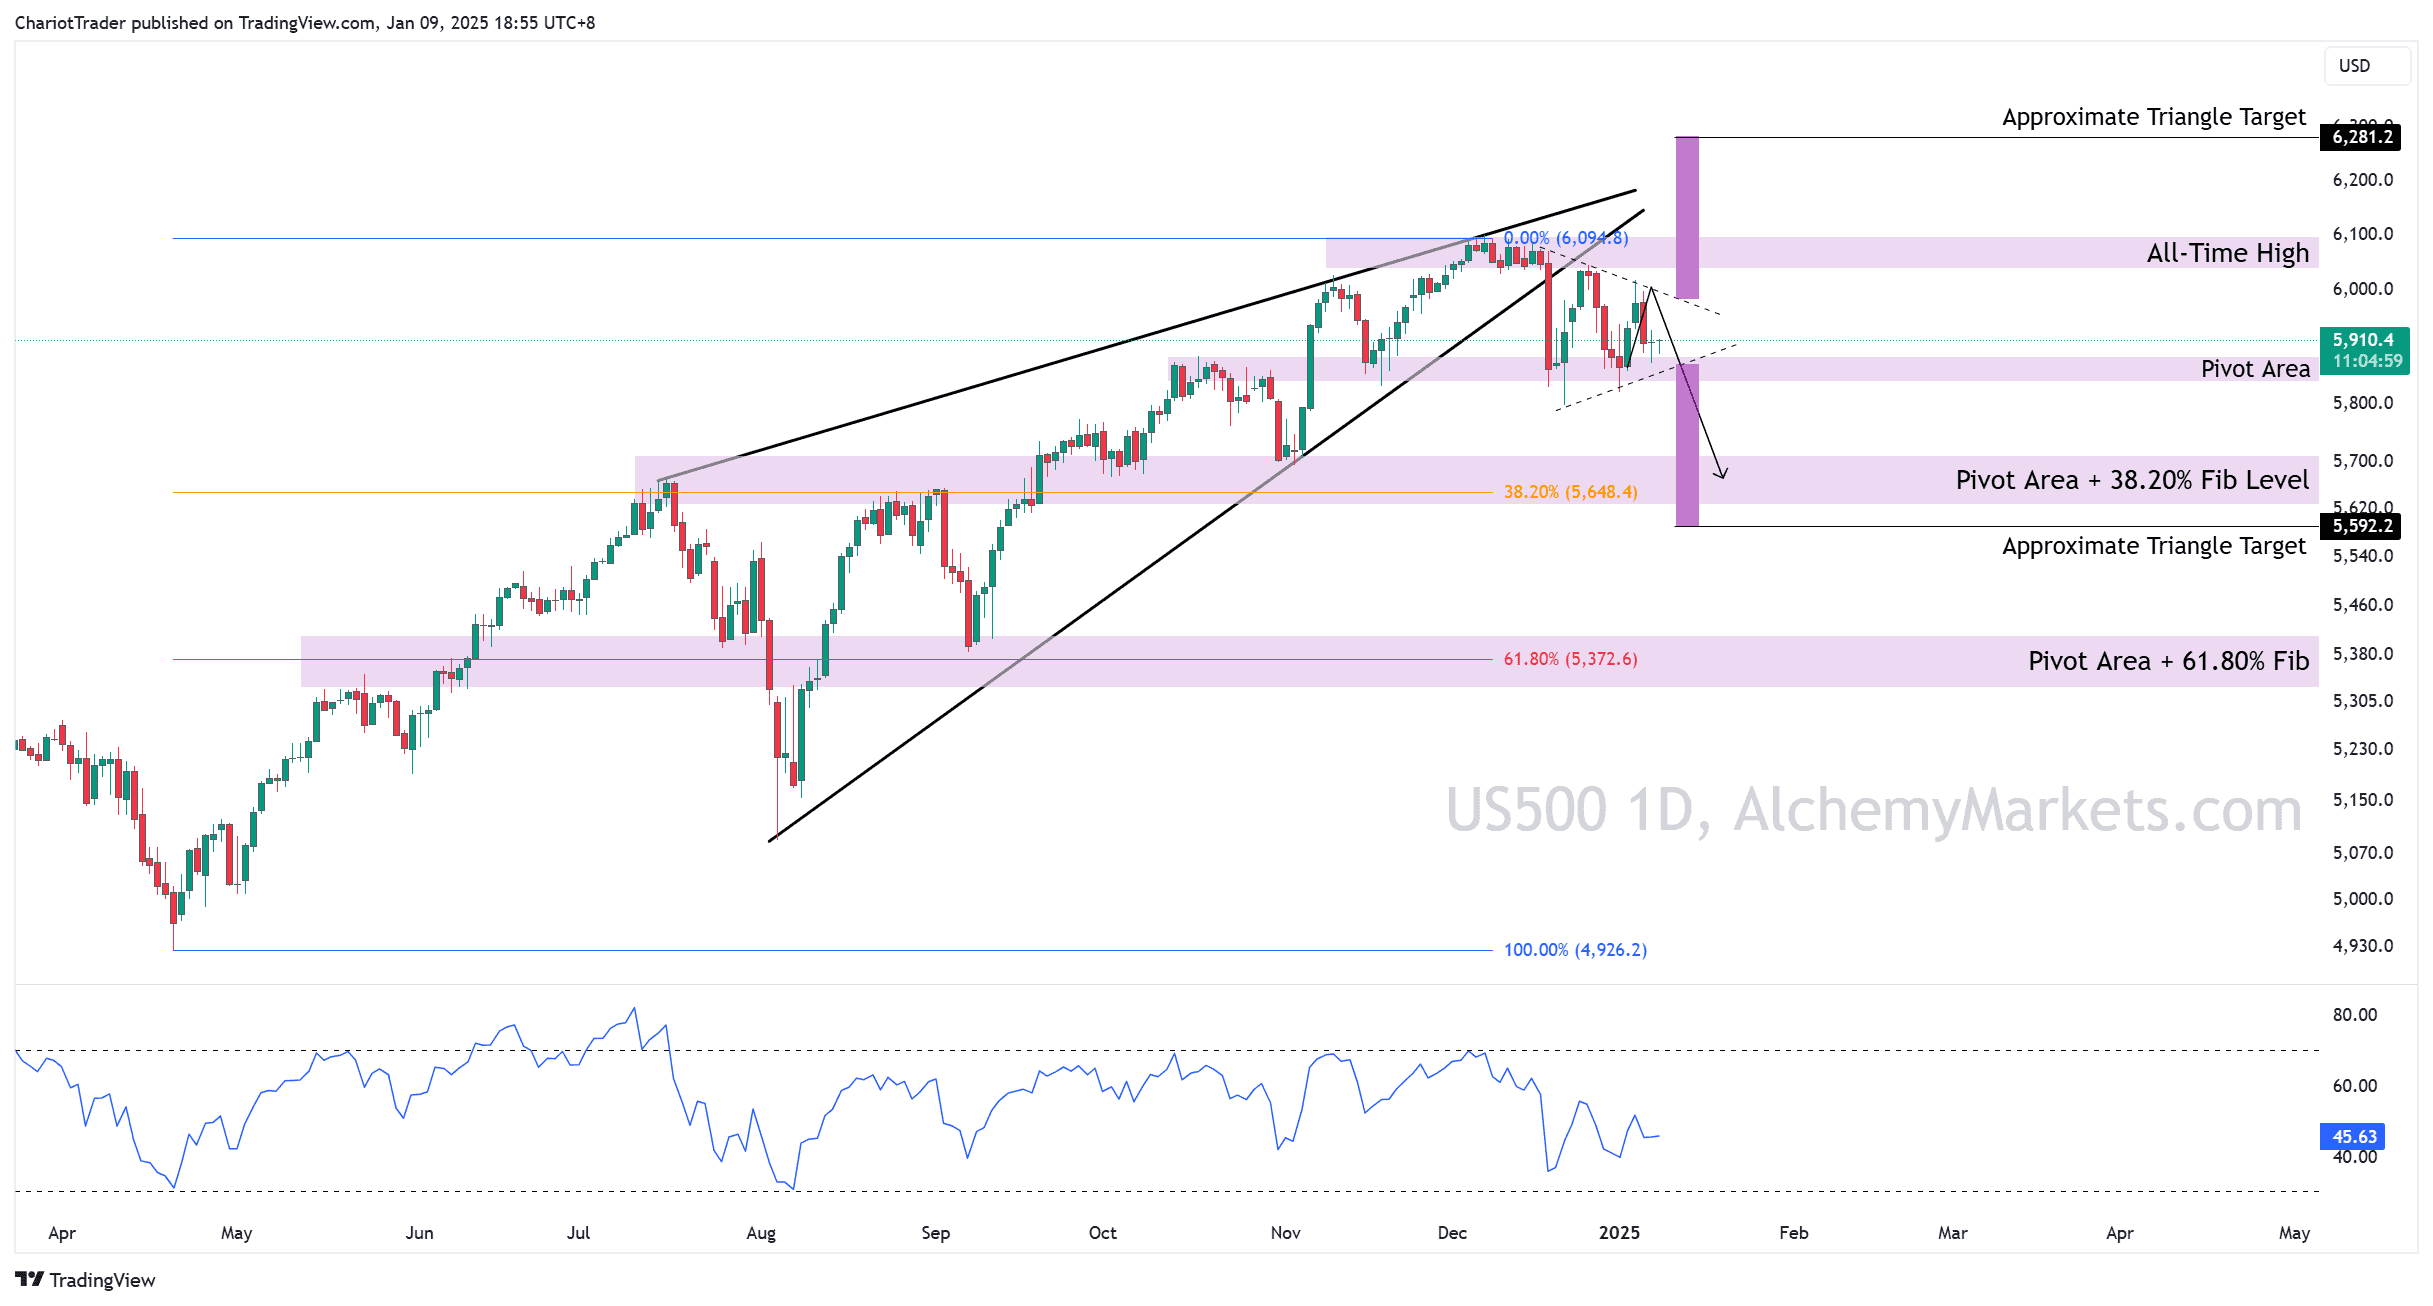
The S&P 500 has seen a break of a Rising Wedge pattern on the daily timeframe, which spells disaster for investors on the asset as the target of the falling wedge goes all the way down to $5,090.
Paired with hawkish expectations from the Fed, the asset is currently trailing below the lower trendline of the rising wedge, and forming a Symmetrical Triangle pattern which has a slight bias to the downside (in this context).
There are several confluences that line the S&P 500’s next major move to be towards the $5,648.4 price zone – so let’s get into it.
Daily Timeframe Analysis of the S&P 500
The S&P 500, or US500 index, saw a break of its rising wedge pattern in December last year. Though the breakdown candle was quickly filled, the asset was simply performing a retest of the rising wedge pattern, successfully confirming the pattern.
Currently, however, a new Symmetrical Triangle has emerged with upside targets to $6,281.2 and downside targets to $5,592.2 – approximately. Keep in mind these measured move targets will change depending on when the price breaks the pattern.
As of now, the sentiment is bearish due to a combination of factors:
- Presence and successful retest of a Rising Wedge pattern (Bearish reversal pattern).
- Daily RSI still has room to go before reaching 30 (Oversold region).
- Alignment of support zones at $5,648.4, where the 38.2% Fibonacci Retracement lay.
Though we cannot be 100% certain the price will reach lower prices due to this symmetrical triangle pattern, this recent price development marks out several key zones for us to watch.
| Price Zone | Explanation |
| Pivot Area | ($5,839.2 – $5,882.3) Acts as support.If broken, could send us to lower targets at ~38.20% Fib. |
| Pivot Area + 38.2% Fib | ($5,627.6 – $5,712.0) Acts as key support at least for a minor bounce.Aligns with 38.2% Fib at $5,648.40 and the Symmetrical Triangle’s breakout target. |
| Pivot Area + 61.80% Fib | ($5,328.3 – $5,412.7) Acts as key support for a major bounce.Aligns with 61.8% Fib at $5,327.60. |
| Wedge Low | ($5,090) The measured move target of the rising wedge pattern. Aligns closely to the $5,000 psychological price zone. |
Closing Thoughts
As we await the FOMC meeting and Fed Fund decision on January 29th, 2025, the S&P 500 could simply just range within the triangle or even between the All-Time High area ($6,040 – $6,097) and the Pivot Area ($5,839.2 – $5,882.3) before we see a decisive move.
However, it’s important to consider how the S&P 500 could break down first, trail towards the 38.20% Fib Area and then see a reversal due to surprising announcements/ dovish tones from the Fed.
A hawkish tone on the other hand, would supplement the bearish narrative, potentially sending S&P 500 towards the 61.80% area.
You may also be interested in:


