Written by:


- Chart of the Day
- July 21, 2026
- 3 min read
Silver Is Breaking Out While Gold Plays Defence
Silver surged almost 5% towards $59 on Tuesday, while gold gained just over 1%. Both metals are recovering, but the difference in speed points to a possible rotation towards the higher-beta metal.
The move is not yet a long-term bullish signal for silver. It is an early sign that traders may be willing to take more risk within the precious-metals complex, even while higher yields continue to weigh on gold.
Silver is finally showing signs of life
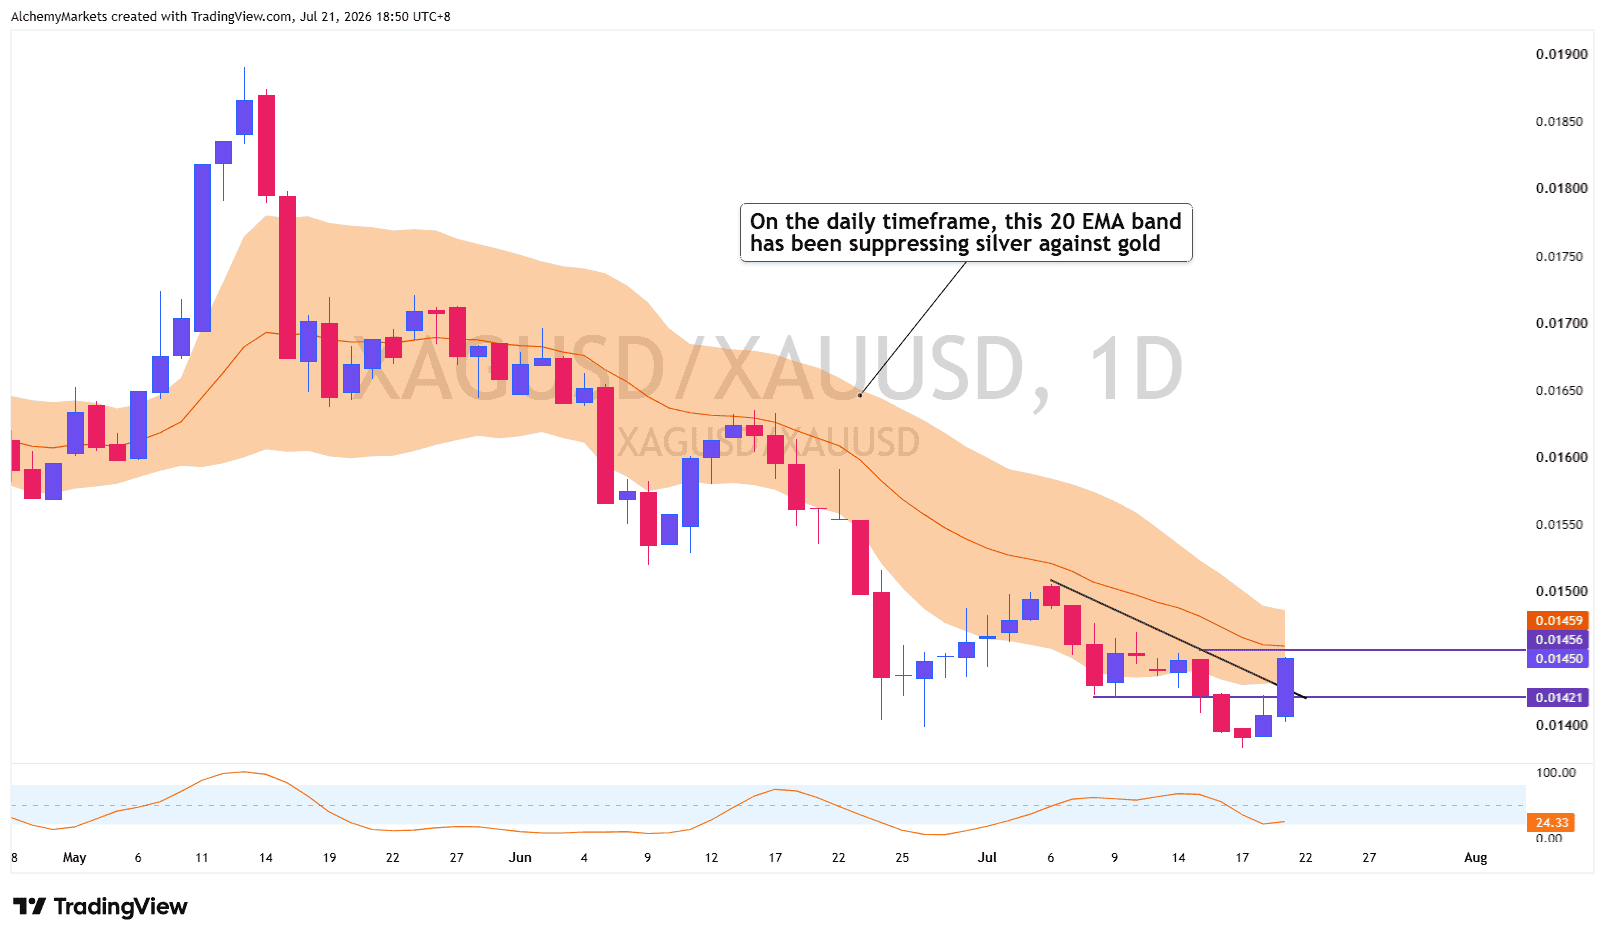
The silver-to-gold ratio has broken above its descending trendline on the hourly chart. Price has also reclaimed the lower purple level near 0.01421, which had previously acted as resistance.
A rising ratio means silver is outperforming gold. If the ratio can stay above the broken trendline and 0.01421, the rotation has room to continue. A drop back below both would make Tuesday’s surge look more like a short-lived burst than a durable shift.
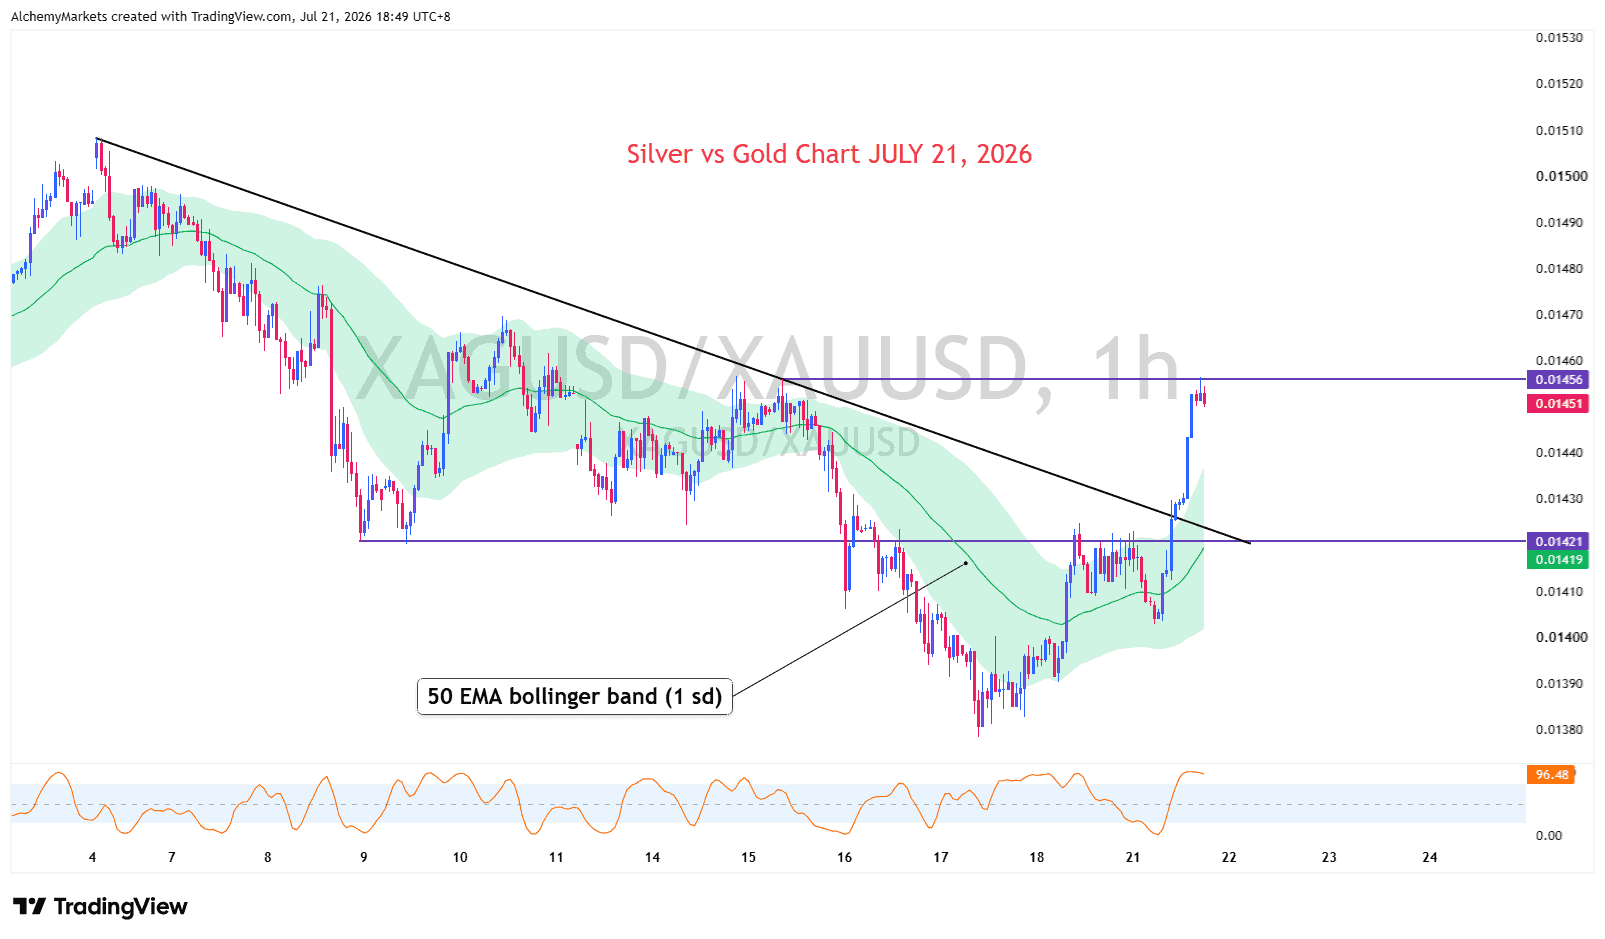
The daily chart adds a second layer of confirmation. Silver has begun to break the relative downtrend that has been in place since May, but it still sits beneath a falling 20-day EMA bollinger band set one standard deviation from the average.
That keeps the larger trend cautious. The breakout is important because it shows a change in momentum, not because it proves that silver has already entered a lasting uptrend.
The first breakout test is already here
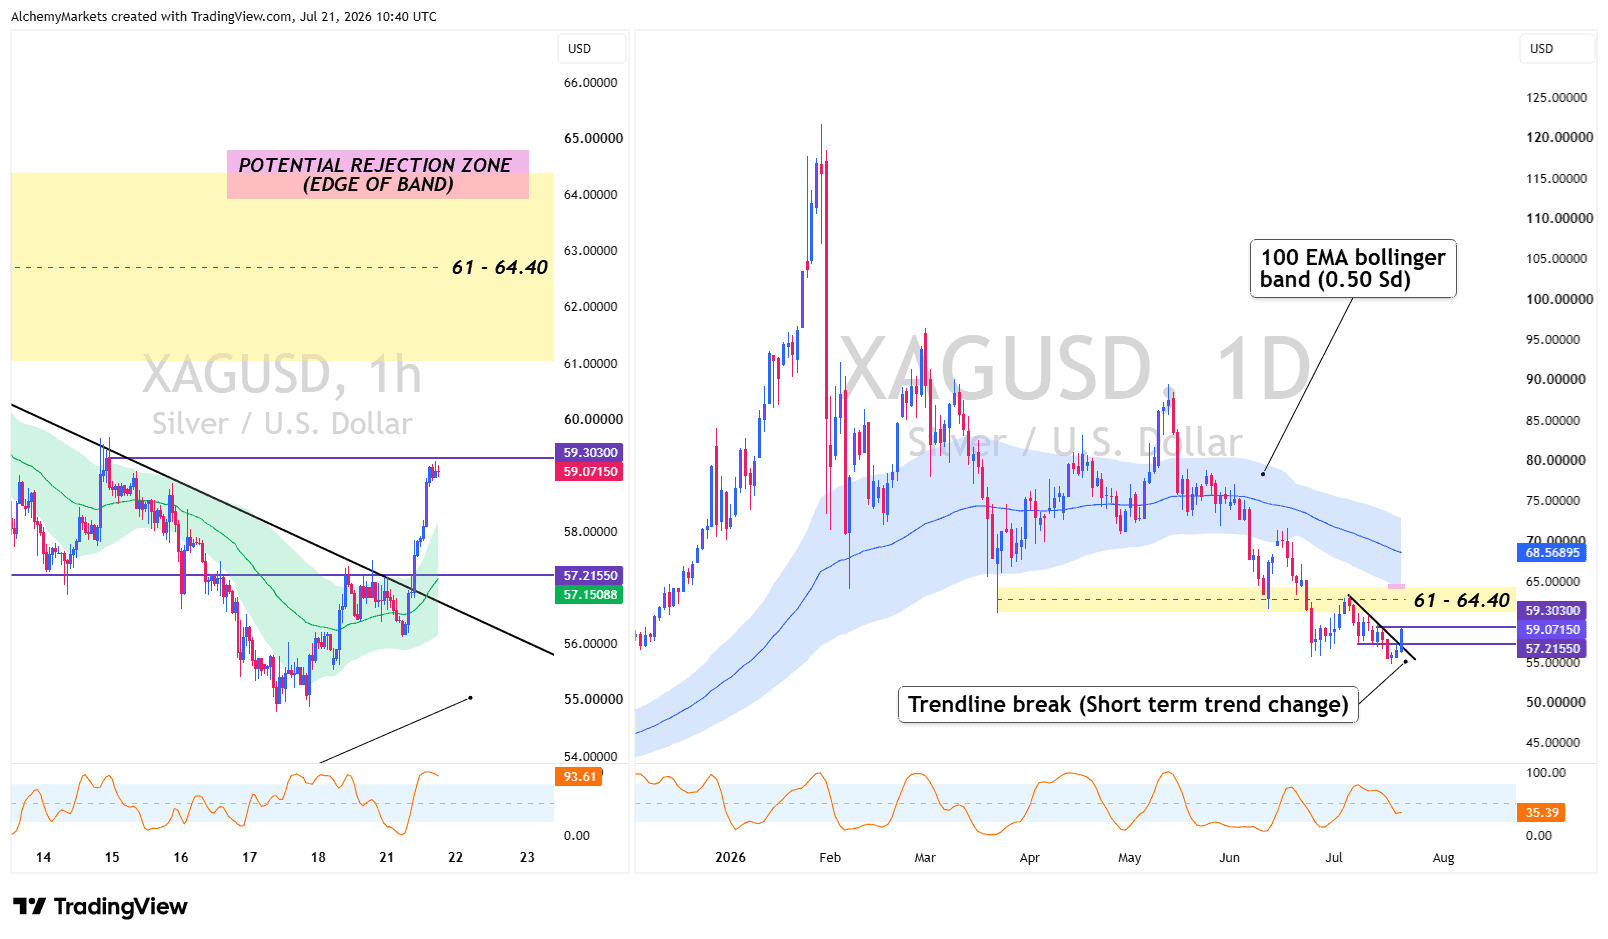
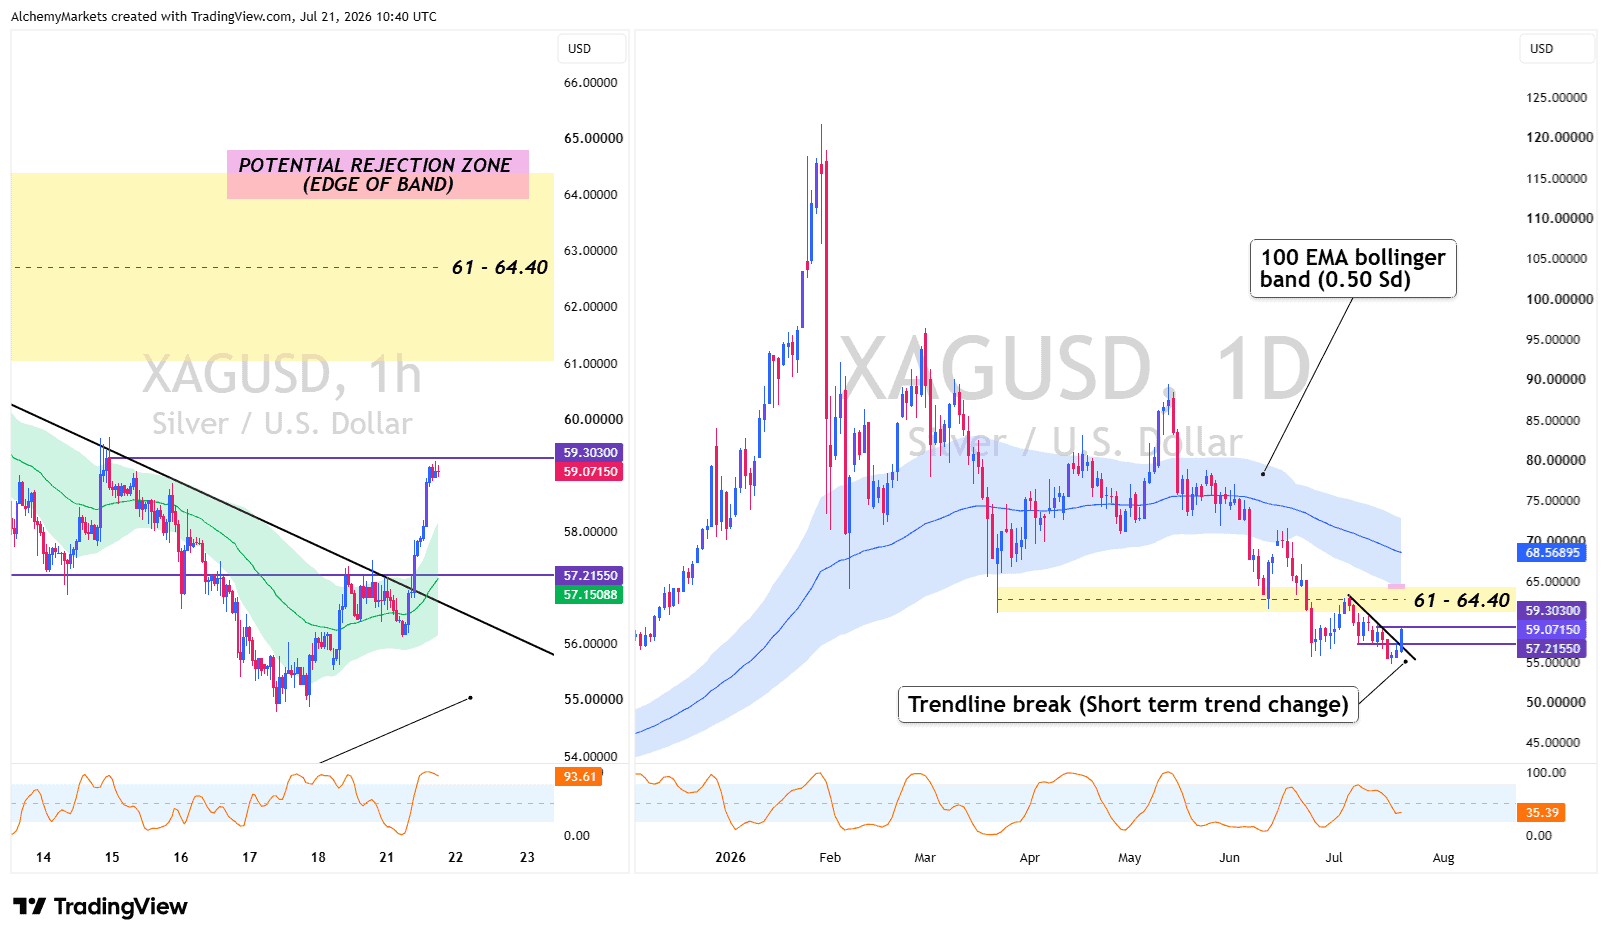
Silver has broken its short-term descending trendline and returned to the previous high around $59.30. However, the hourly Stochastic RSI is above 90, showing that the move is heavily overbought.
A cool-off would therefore be normal. The first support area sits around $57.22. Above that level, the breakout structure remains intact. A decisive push through $59.30 would expose the broader $61.00 to $64.40 rejection zone.
On silver’s daily chart, the 100-day EMA band is set at half a standard deviation. This wider average is used because silver repeatedly cuts through the shorter 20-day band, making its edges less useful. The upper edge of the 100-day band now reinforces the $61.00 to $64.40 area as the larger technical test.
Gold may hold up better during a pullback
Gold has also broken above its hourly descending trendline, but it is testing previous highs between roughly $4,081 and $4,134. Its hourly Stochastic RSI is overbought as well, although not as stretched as silver’s.
This matters if both metals cool off. Gold’s defensive demand may help it hold up better during the first pullback, while silver’s higher volatility could produce a larger reversal.
Over the next few days, however, silver offers the bigger potential move if relative strength continues to improve.
USDJPY is the macro filter
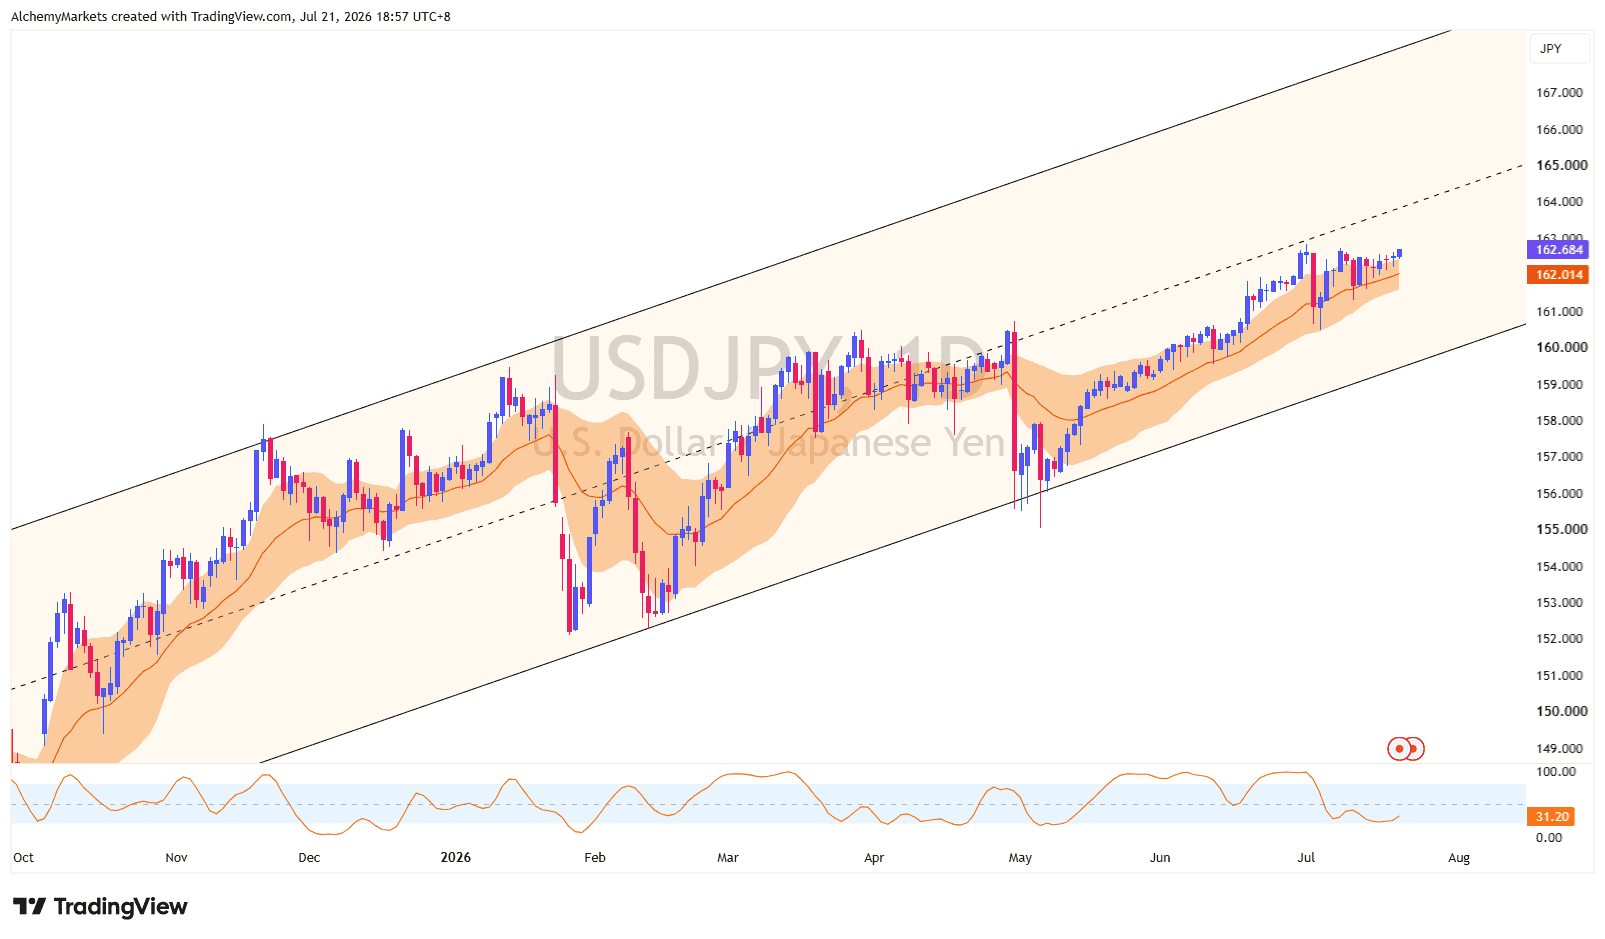
USDJPY can help determine whether the broader environment supports either metal.
Currently, it is still supported by the 20 EMA band, which is not supportive for the price of Gold and Silver.
A renewed rise in USDJPY would suggest that dollar and yield pressure remains firm. That would make it harder for both gold and silver to sustain their rebounds. A break below the EMA band, followed by the lower channel, would make the metals recovery more convincing.
Bottom line
USDJPY gauges the overall direction of the metals complex, while the silver-to-gold ratio shows which metal is leading.
The strongest bullish combination would be a weaker USDJPY alongside a ratio that holds above its broken trendline and 0.01421.
For now, silver’s breakout is real but stretched.
Traders should watch whether the next pullback holds rather than chase the first vertical move.
If support survives, silver may become the more attractive metal for traders seeking larger price swings. If it fails, gold is likely to remain the steadier defensive choice.