- Chart of the Day
- January 1, 2025
- 3 min read
Ethereum: Drop to $3,000 Possible Before Continuation
Ethereum has broken down from $3,500 on December 19th, 2024, but has since been ranging approximately from $3,560 to $3,250. This behaviour occurs near two critical zones: the neckline of a double top pattern, and the yearly point of control (2024).
Notice a successful breakdown of a Double Top Pattern on the daily timeframe. This is a bearish reversal chart pattern which comes with a measured move target, an estimation of where the price is most likely to reach based on the pattern’s shape and size.
According to this current formation, the measured move aligns with the lows of a consolidation which occurred mid-November in 2024, at $3,028.56, a 61.80% Fibonacci Retracement Level at $3,024.62, and the $3,000 psychological level.
This marks three critical supports aligning in the same area, making the $3,000 level a must-watch zone for a bounce.

For now, until the price of Ethereum closes and holds above the July ‘24 Highs ($3,562.82) – where the double top’s neckline is, the asset will continue to be in bearish bias.
The following two bearish scenarios could happen as we move into January 2025:
- Price retests the neckline of the Double Top, at around $3,500 to $3,570, before continuing to the Measured Move Target.
- Price falls towards $3,000, where there is a Measured Move Target, Psychological Level, and Fibonacci Support.
| As the price moves into the $3,000 support zone, a bounce at this level could very well take place due to multiple aligning supports. If it drops lower, $2,860 is the next critical support to watch. |
Where could a bounce from $3,000 take Ethereum?
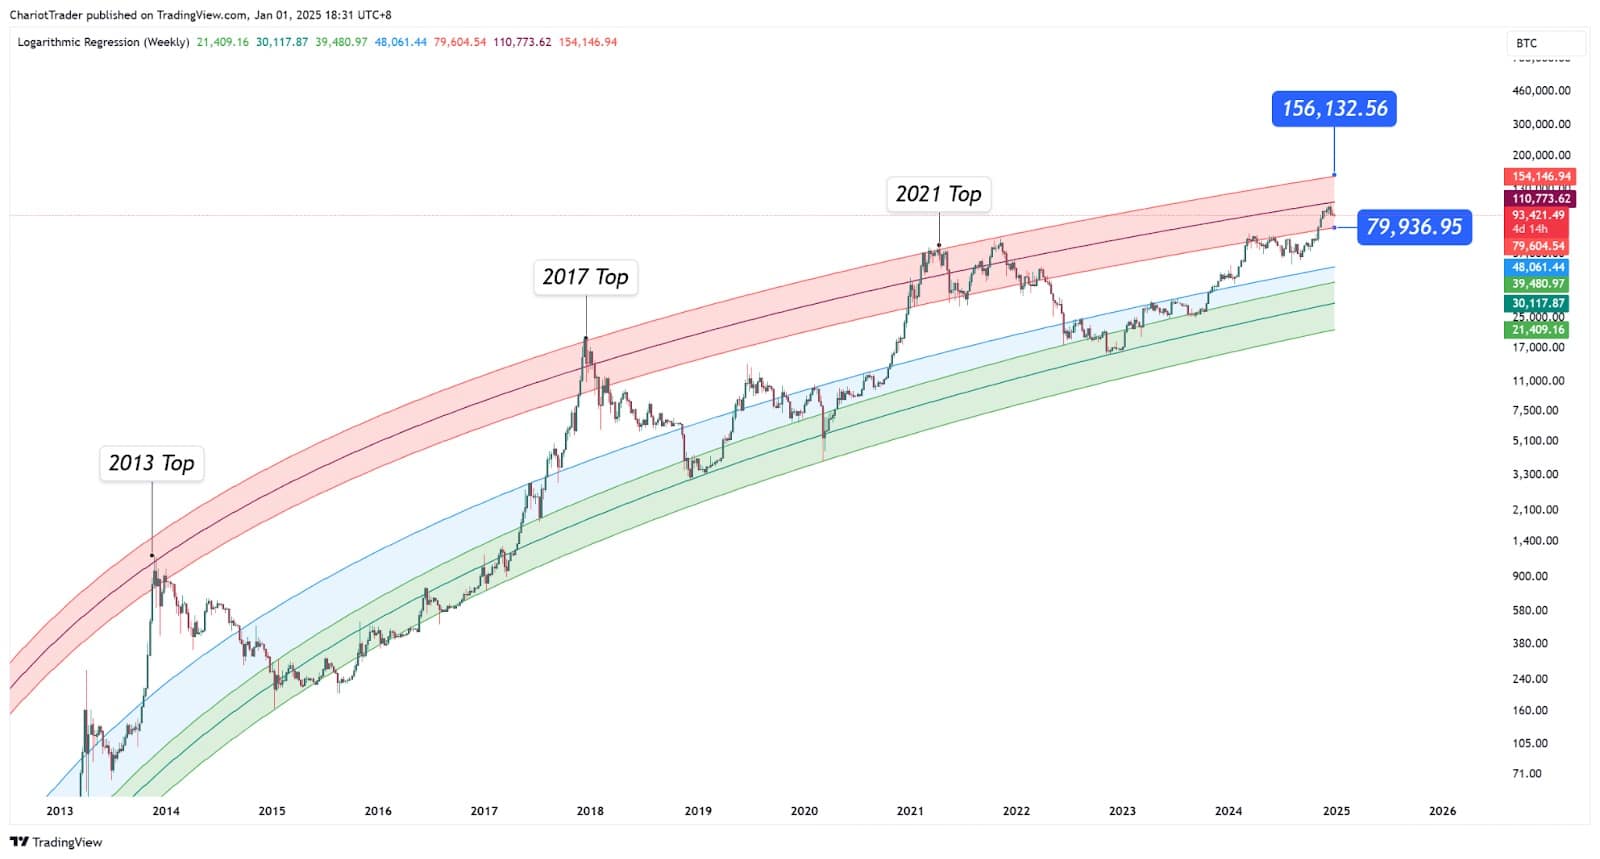
As Bitcoin and Ethereum are highly correlated and because Bitcoin has not currently reached its estimated top at around $150,000, it is this editor’s belief that Ethereum will break beyond its March ‘24 Highs at $4,095.22, should a bounce at ~$3000 happen.
Illustrated below: BLX Chart has not reached its top with the Logarithmic Regression Curve (Weekly).

Until Bitcoin falls below approximately $79,936 or basically $80,000, we cannot consider the Bitcoin top to already be in, at least according to this Bitcoin cycle top prediction method which has served well for 3 out of 4 past cycles.
Either way, it’s important to watch the Bitcoin price alongside Ethereum’s to get a better gauge of whether $3,000 would act as adequate support, which perhaps could take the asset to new highs.
Additionally, Bitcoin is known to move in 4 year cycles, making 2025 the topping year of this cycle.
| If not, conventional resistances above would be $3,400 (2024 Point of Control), $3,500 (Neckline), and $4,000 (March Highs). |
You may also be interested in:


