- Chart of the Day
- October 28, 2024
- 2 min read
Nap time for the Dollar? Potential 4H Double Top in Sight
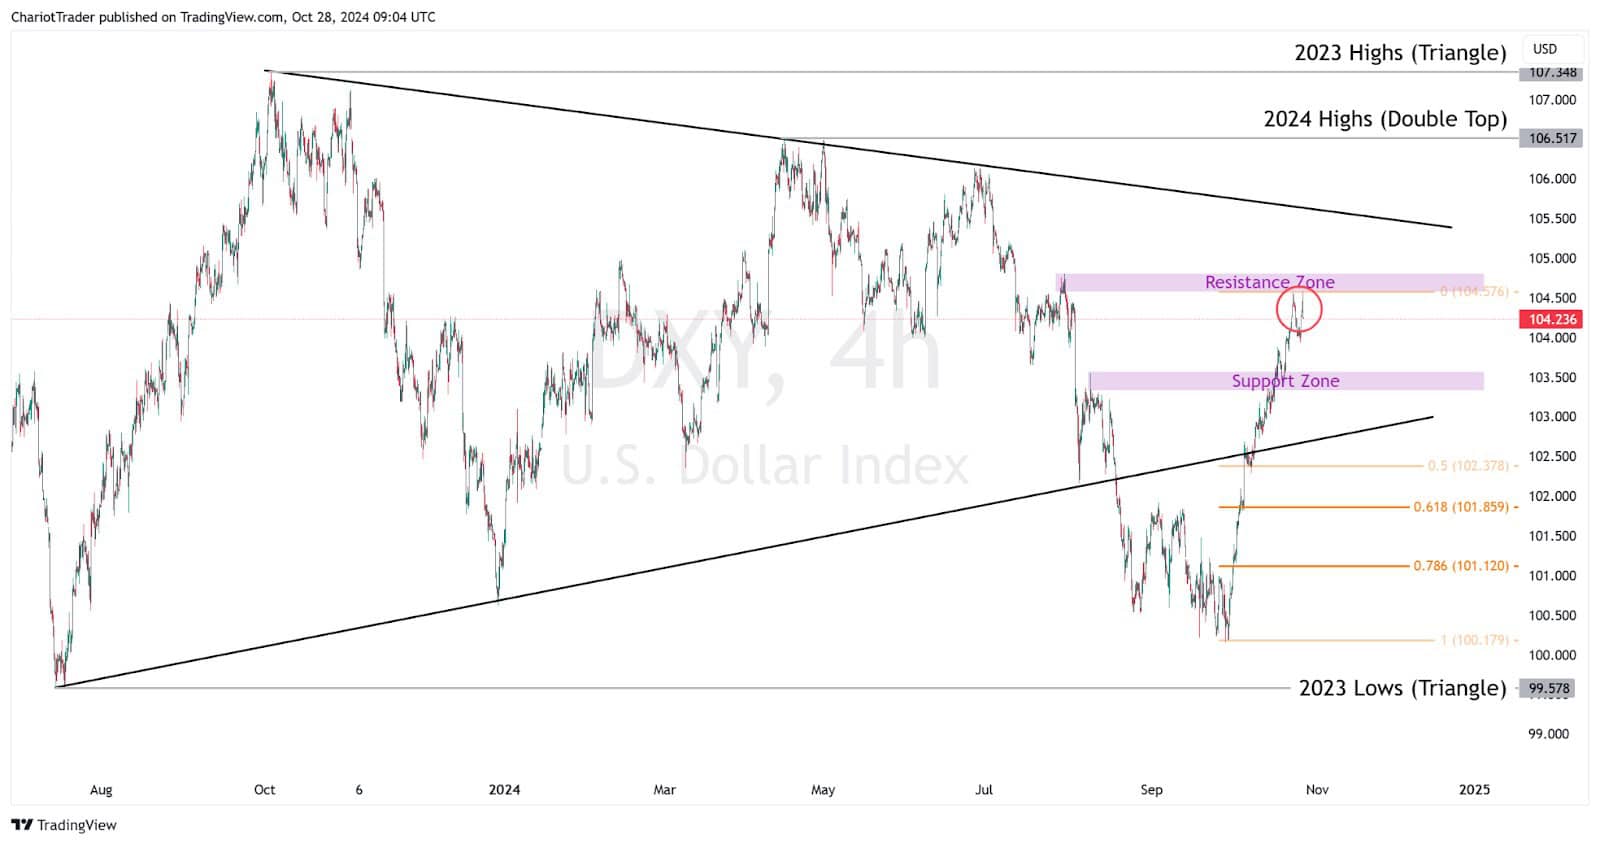
After tapping into the sub 100.00 levels, the Dollar Index rebounded strong, breaking previous highs and back into a massive triangle pattern. Across 27 days, the DXY has made a gain from 100.157 to 104.573, marking a 4.4% increase in value.
This wild price action came with the various economic data about the US economy, with:
- Lowering Inflation in September: 2.4% CPI inflation was reached, which is 0.1% closer to the Federal Reserve’s 2% target.
- PCE Inflation Projection: Professional forecasters think 2.2% PCE Inflation will be reached in Q4, which is 0.2% lower than Q3.
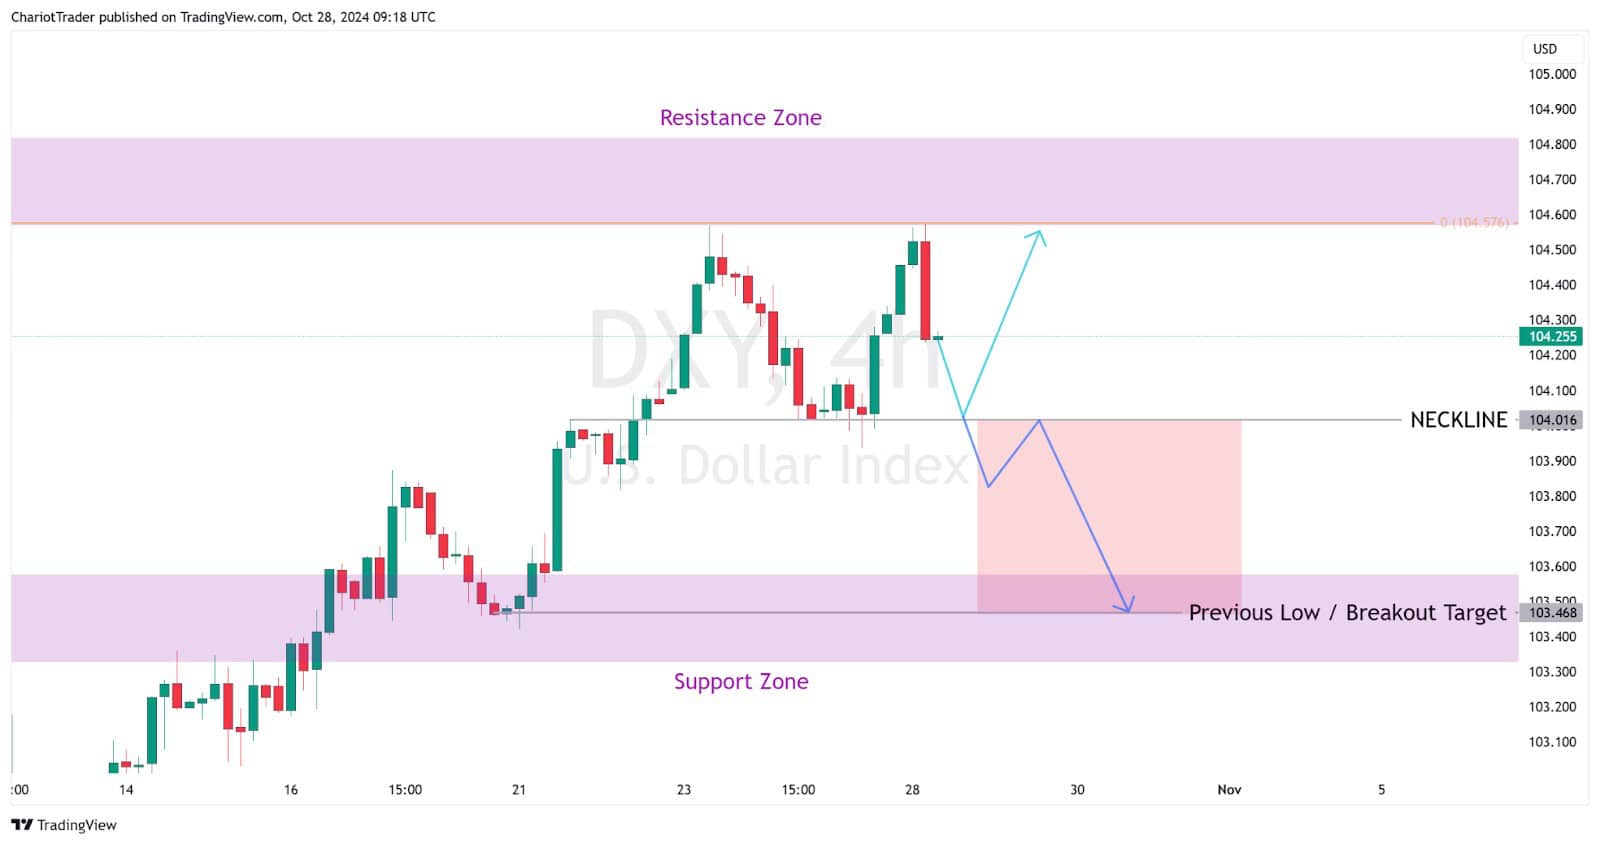
Following a successful 4H bearish engulfing candle close, the index is now signaling some potential retracement in the short term, and also the possibility of a Double Top Bearish Reversal Pattern.
So, are the scary times over? Or will DXY once again rise and jumpscare the entire market?

4H Technical Analysis of the DXY (October 28th, 2024)
Going in on the 4H timeframe, we have a freshly closed bearish engulfing candlestick. Since it has occurred at a key resistance zone, this candlestick could act as a valuable signal for a price decline on the US Dollar.
This also marks the possibility of a Double Top Pattern, which would have a bearish target at 103.468, aligning with the Previous Low / Breakout Target at approximately 103.468.

However, it’s important to note this chart only marks the potential for a double top pattern to form – and does not indicate that one is currently in play. We need to wait for the price to creep lower towards the neckline, which is around the 104.016 level.
| Support Levels to Watch on DXY • Neckline: Approx 104.016 • Previous Low / Breakout Target: Approx 103.468 • Support Zone: Approx 103.325 to 103.580 |
| Resistance Levels to Watch on DXY • Local Pivot High: Approx 104.573 • Resistance Zone: Approx 104.568 to 104.823 |
If the DXY is able to form a Double Top and potentially break down, we may see markets across the board find some relief, or enjoy bullish price movement in the coming days.
Alternatively, DXY could simply just range between the neckline (104.016) and local pivot high (104.573) for a bit before picking a definitive direction.
You may also be interested in:


