Written by:


- Chart of the Day
- December 2, 2025
- 2 min read
BTC/USD – Are We Finally Breaking Out of the Downtrend?
It’s been a pretty interesting few weeks for Bitcoin, and today’s chart gives us a bit of hope that we may finally be seeing the beginning of a shift in momentum.
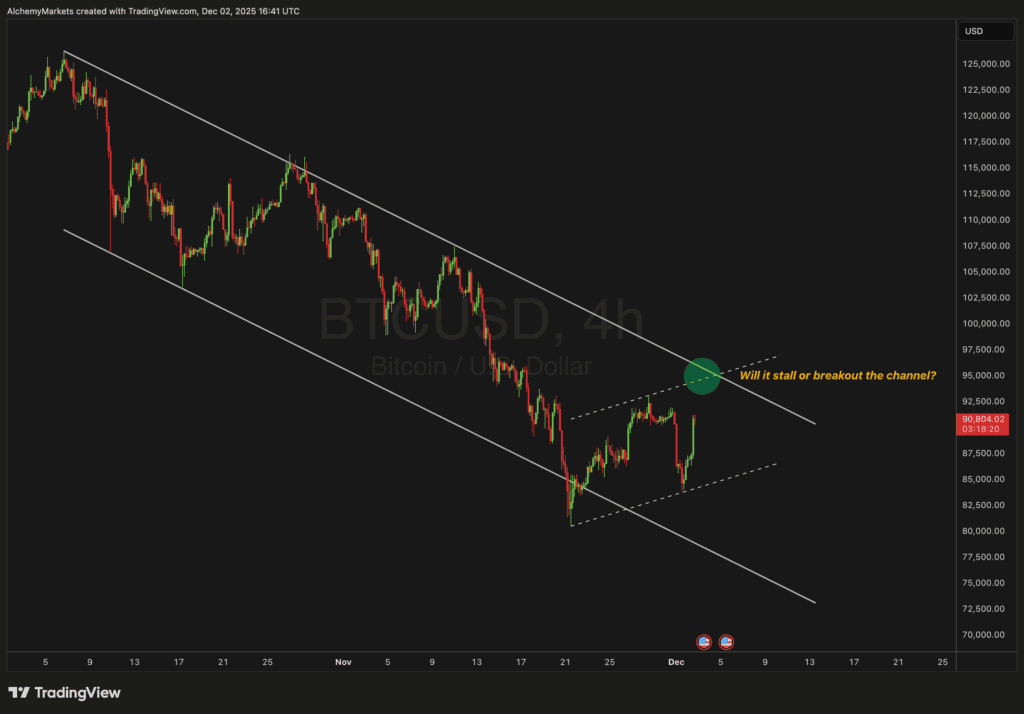
Looking at the 4-hour BTC/USD chart, price action has been trapped inside a descending channel since early October, making consistent lower highs and lower lows. But recently, things have started to change — it looks like we may have bottomed out near the lower boundary of that channel. Since then, we’ve seen a strong impulse to the upside, showing some early signs of life from the bulls.
That said, while this bounce is promising, we’re not out of the woods just yet. Bitcoin hasn’t formed a new higher high, so it’s too early to call it a confirmed reversal. The key level I’m watching right now is around the $95,000 region — that’s where the upper trendline of the channel currently sits, and it’s going to be a major test for price.
If BTC can break and hold above that $95K mark, that’s where things get exciting. A breakout from the descending channel could open the door for a push toward $106,000 next, which lines up nicely with the next area of resistance and potential profit-taking zone.
For now, though, patience is key. Until we see a clean break and retest above $95K, we’re still technically inside the downtrend — but the momentum is definitely shifting. The next few candles should tell us whether this is just another fake-out rally or the start of a new leg higher.
Key Levels to Watch:
- Support: $85,000 – $87,500
- Resistance: $95,000 (breakout zone)
- Next Target if Broken: $106,000
In Summary:
Bitcoin looks like it’s trying to reverse out of its descending channel, showing some strong upside impulse. The bulls have shown up, but they still need to prove it by pushing through that $95K resistance. If they manage to do that — the next leg toward $106K could be in play.