


Written by:

- Chart of the Day
- March 24, 2025
- 2 min read
Bitcoin in Rising Channel with Potential Rejection at $88,000
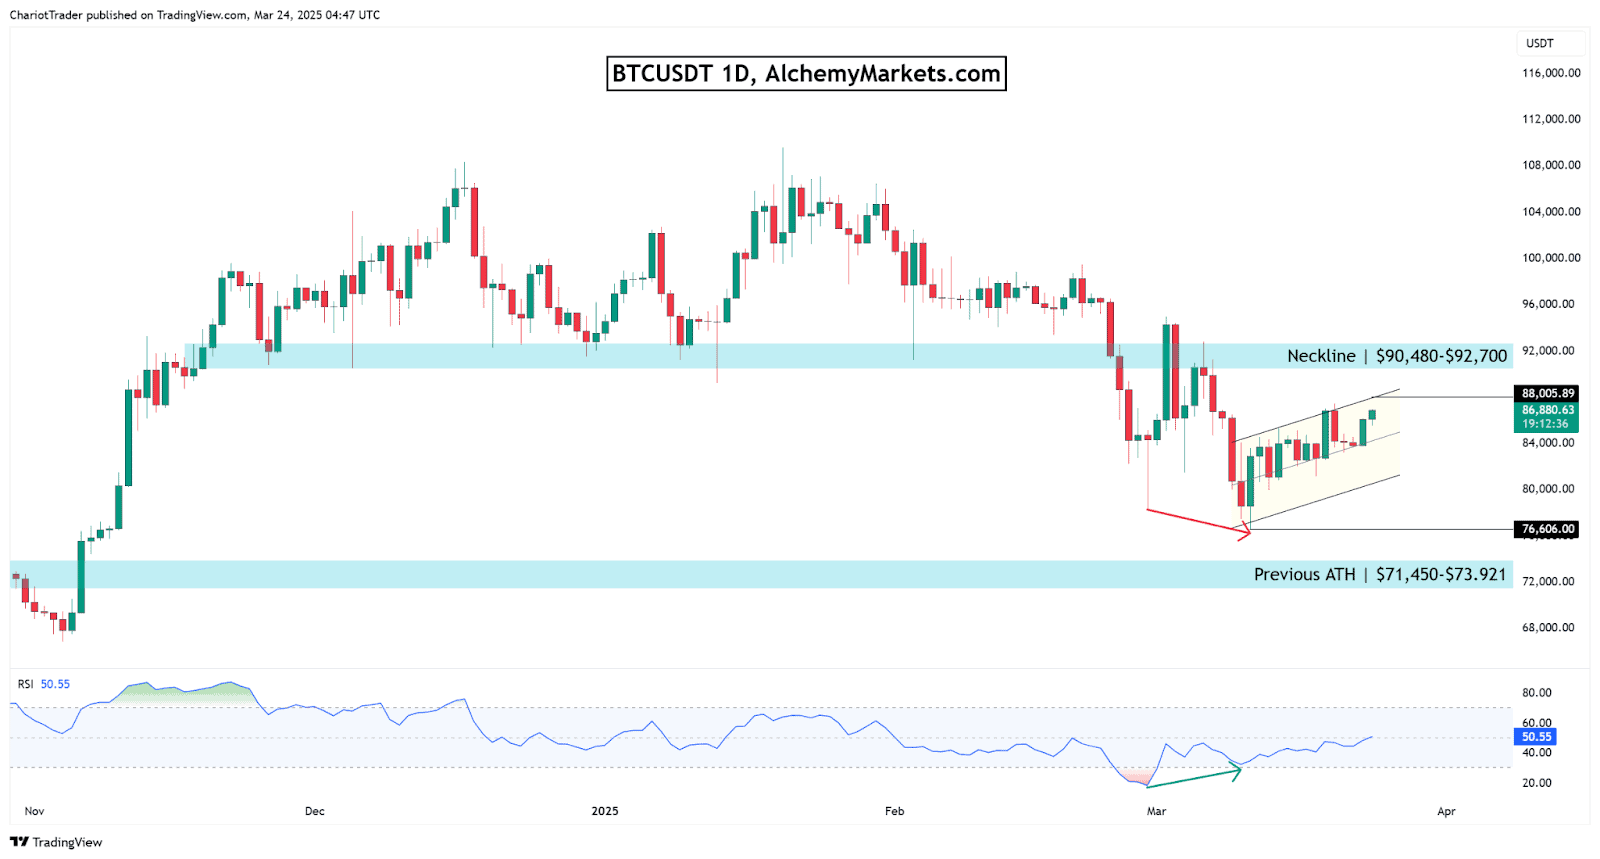
Bitcoin is currently in a rising channel after tapping the lows near $76,600, looking corrective and potentially building up for another price decline. Traders are eyeing the $76,000 level, which would take out the previous low and is currently acting as a psychological level.
Regarding the bullish RSI divergence—we do currently have one in play, however, a bullish divergence does not always have to result in a reversal; it can simply be a pause in the downtrend (which the rising channel seems to suggest).
Technical Breakdown of BTCUSDT 1D Chart
For Bitcoin to break bullish, we would need a clear break of the following:
- Rising channel upper band, which is lining up with $88,000
- Neckline of the Double Top, between $90,480 – $92,700
Aggressive bears can look for shorts at these aforementioned areas:
- A rejection at $88,000 is most bearish, seeing Bitcoin revisit $76,600 or even lower
- If price rejects at the neckline, a new support would be formed between $86,870–$87,600 (new support to watch)
- If double top is to complete its measured move target, BTC could reach approx. $73,400
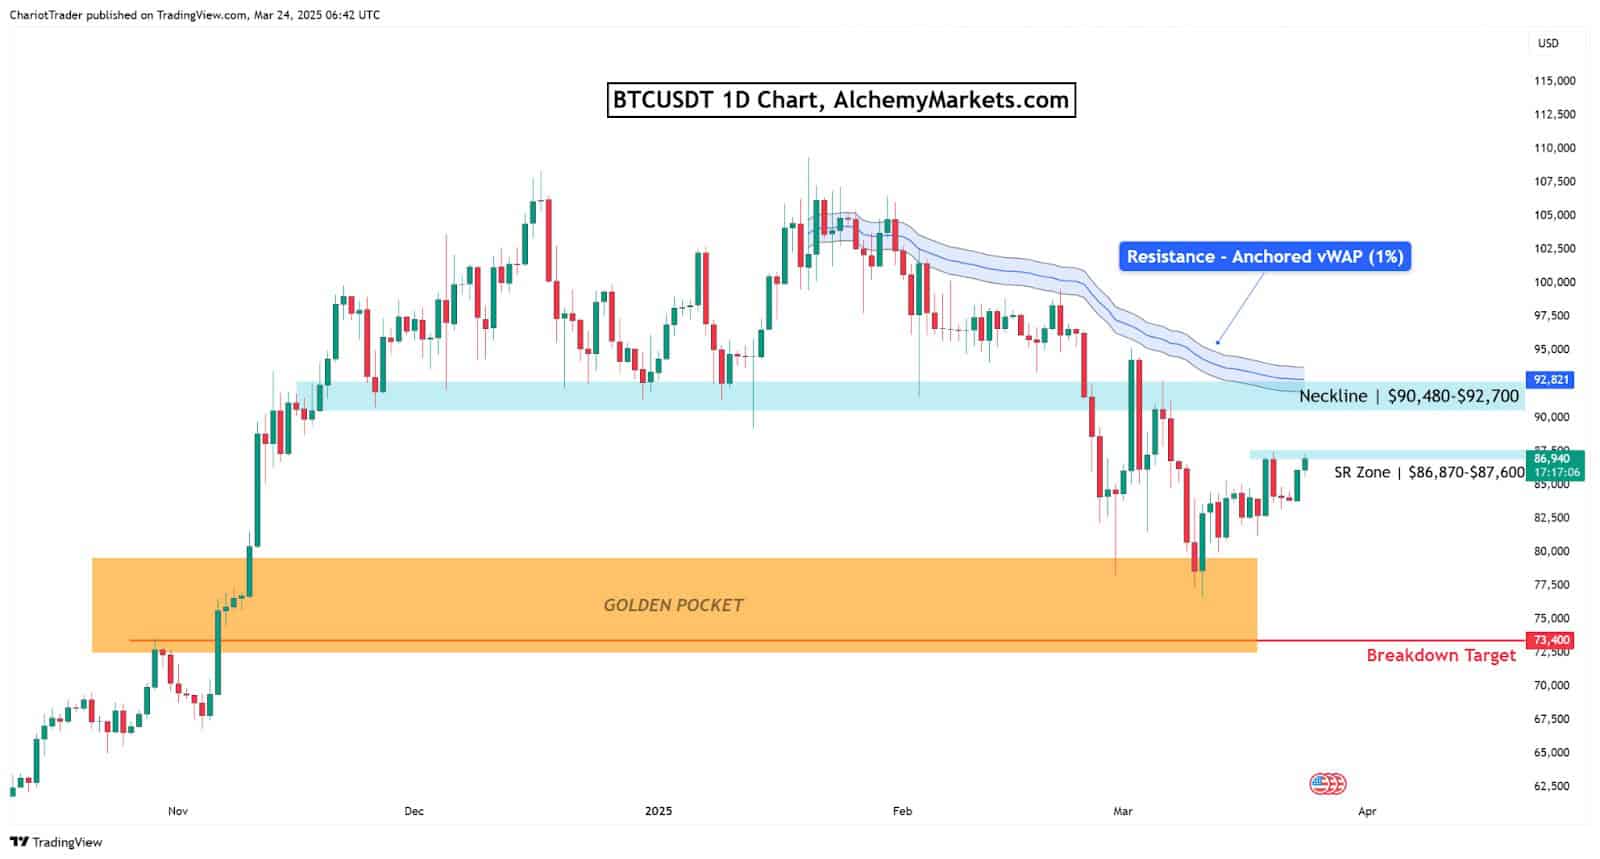
Additionally, the anchored vWAP drawn from the all-time-highs (ATH) to the current price shows $92,821 as a secret resistance, aligning closely with the neckline and providing confluence.
Overall, the current Bitcoin price appears to be in a corrective stage, implying that further downside is likely. However, if the $92,800 resistance zone is broken to the upside, we may see the bull market resume.
You may also be interested in:


