Written by:

- Chart of the Day
- October 22, 2026
- 3 min read
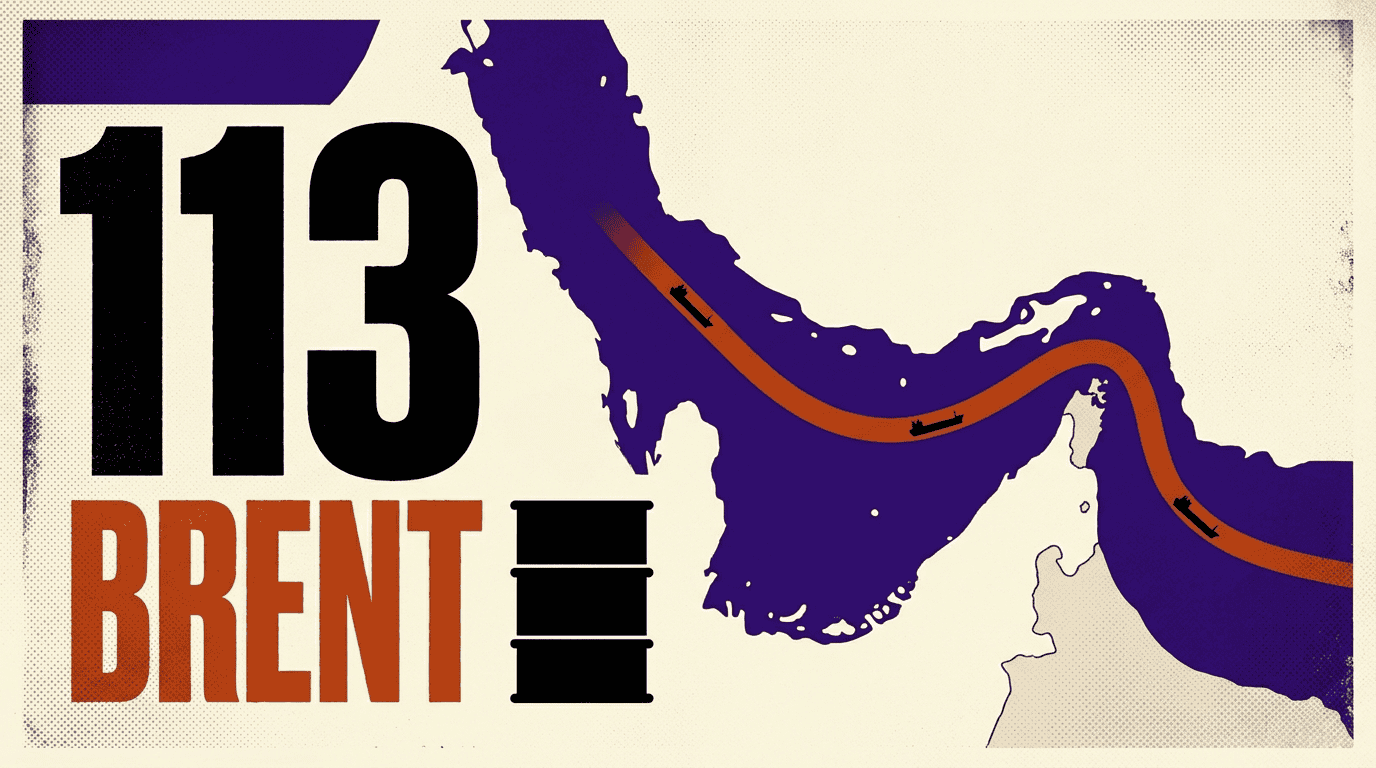
Brent at $113: Gulf Strikes Put US Stocks on Edge
Brent is back near $113, and its 4-hour chart is doing something important: it is holding above the 50 EMA (1sd) while pressing into the 110.195–113.635 resistance zone.
That is bullish behaviour, but the top of this zone is still a hurdle.
The question now is whether this is another spike in oil prices, or the start of a move that creates even more problems for stocks.
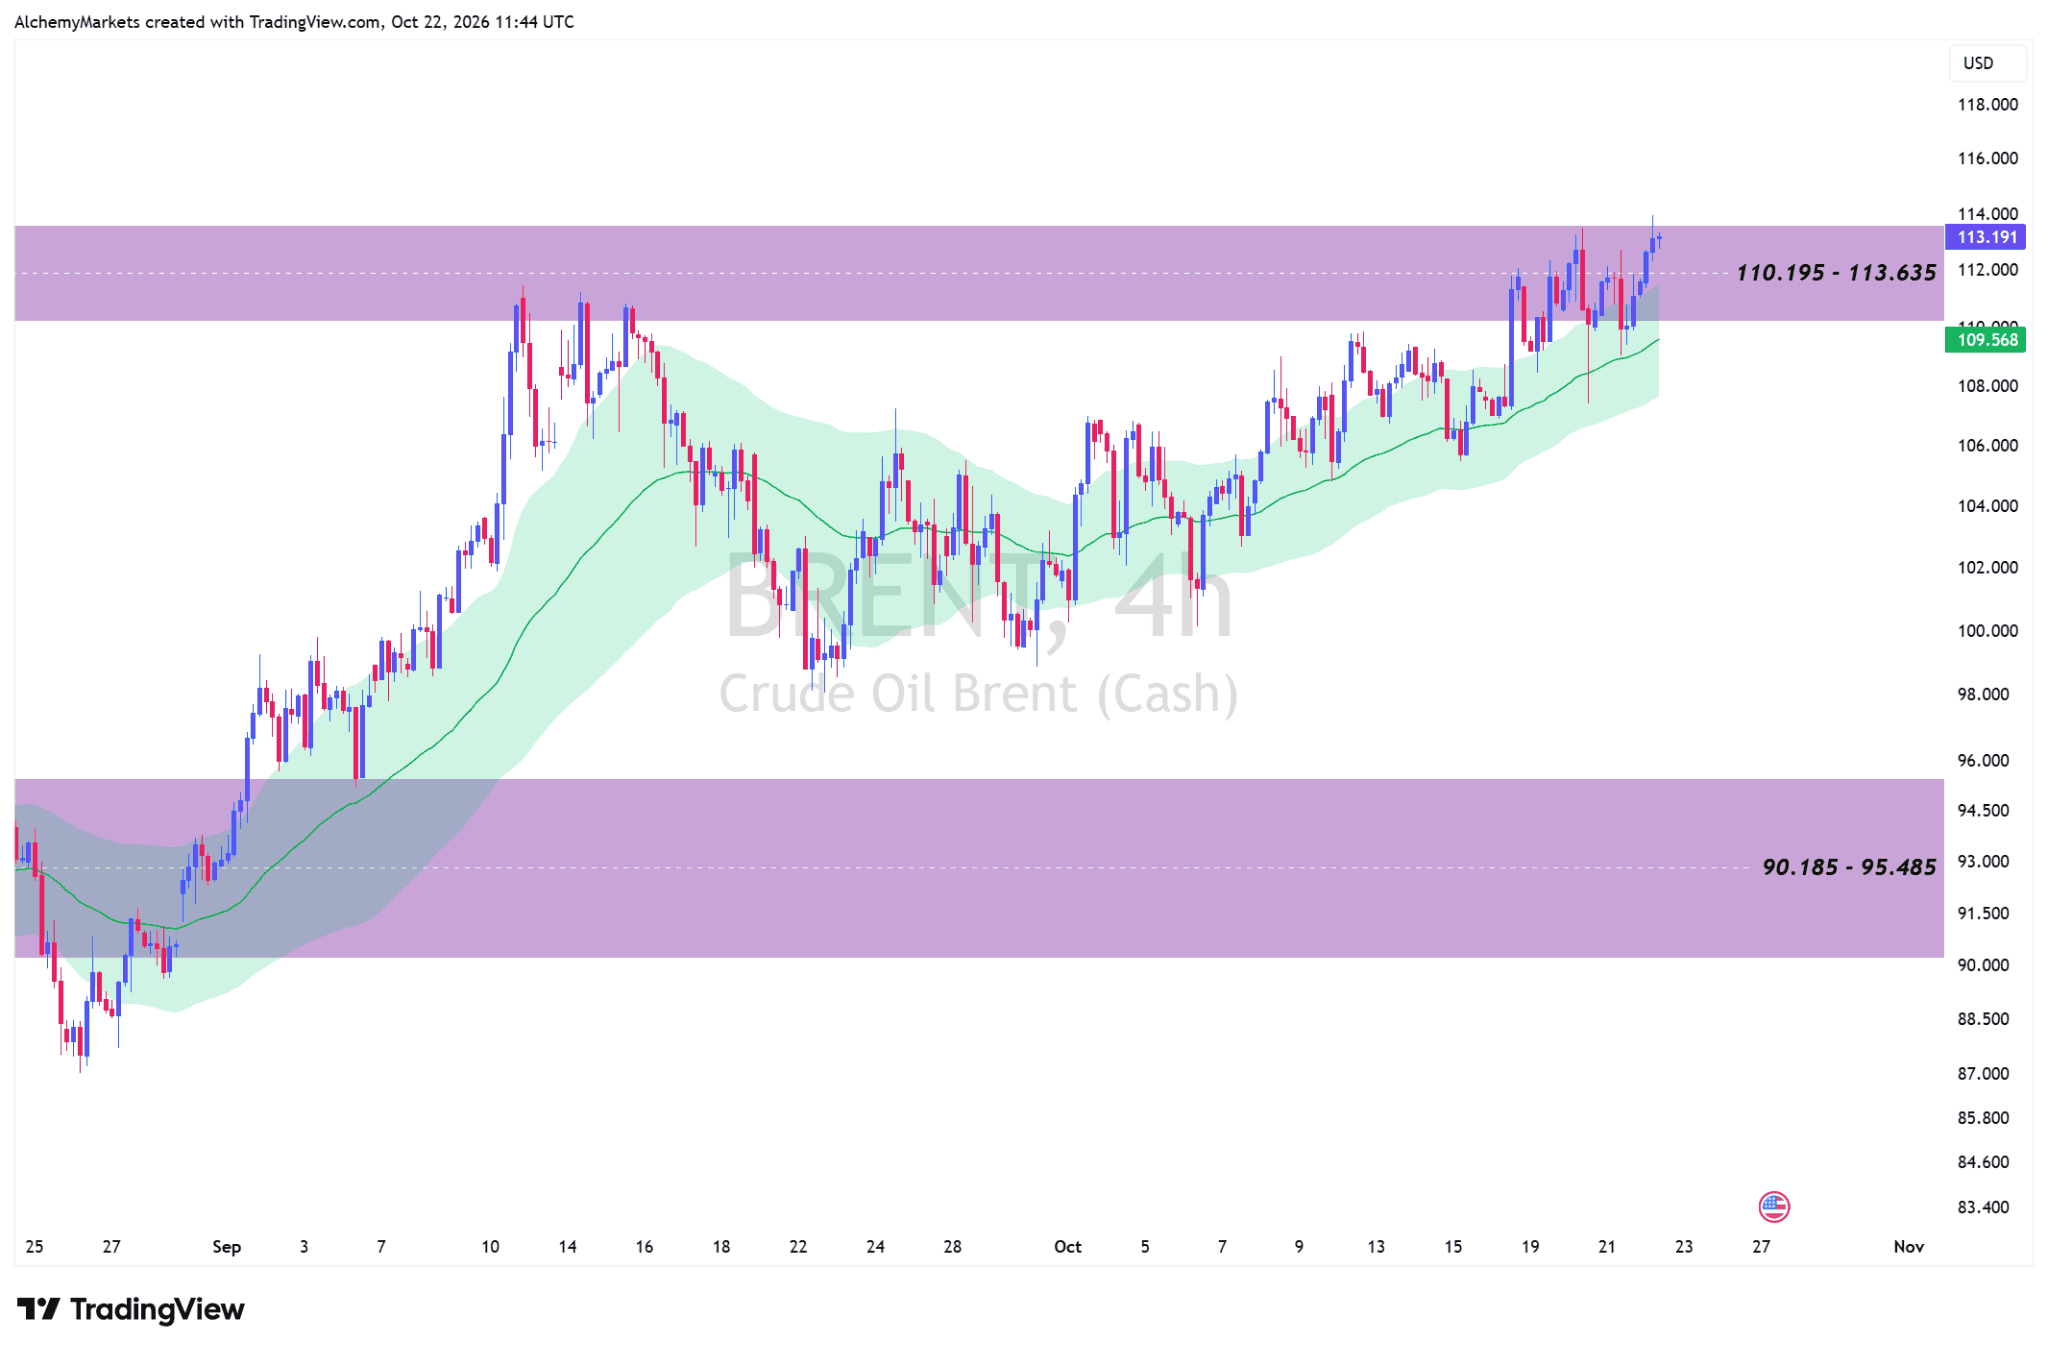
$113.635 is the level to watch. A sustained break above it would strengthen the upside case.
A move back through $110.195, followed by a loss of the rising 4H band near $108, would make that case much less convincing.
The Gulf risk is no longer just talk
The Gulf headlines explain why Wall Street thinks the middle east conflict is escalating:
- On 21 October (Wednesday), attacks in Saudi Arabia killed two people at Dammam airport and another two near the Shaybah oilfield after a drone was intercepted.
- Saudi Aramco then told staff to leave its Dhahran headquarters and work remotely.
Iran’s Revolutionary Guard navy has also claimed that four vessels were struck and three others hit mines in Gulf waters. Iranian media reported explosions around Sirik on the Hormuz coast, although the cause remains unconfirmed.
These are not abstract threats: shipping and energy infrastructure are already being affected.
Trump says Washington is not negotiating with Iran and that something will happen “fairly soon”, potentially hinting at a much unexpected pre-election strike. But he did not announce a strike date.
Another X report says Iran has newly activated its decentralised Mosaic Defence. The 31 regional-command structure is real and long-established; its alleged fresh activation, if true, is a sign of escalation in the region.
WTI is rising, but not free of resistance
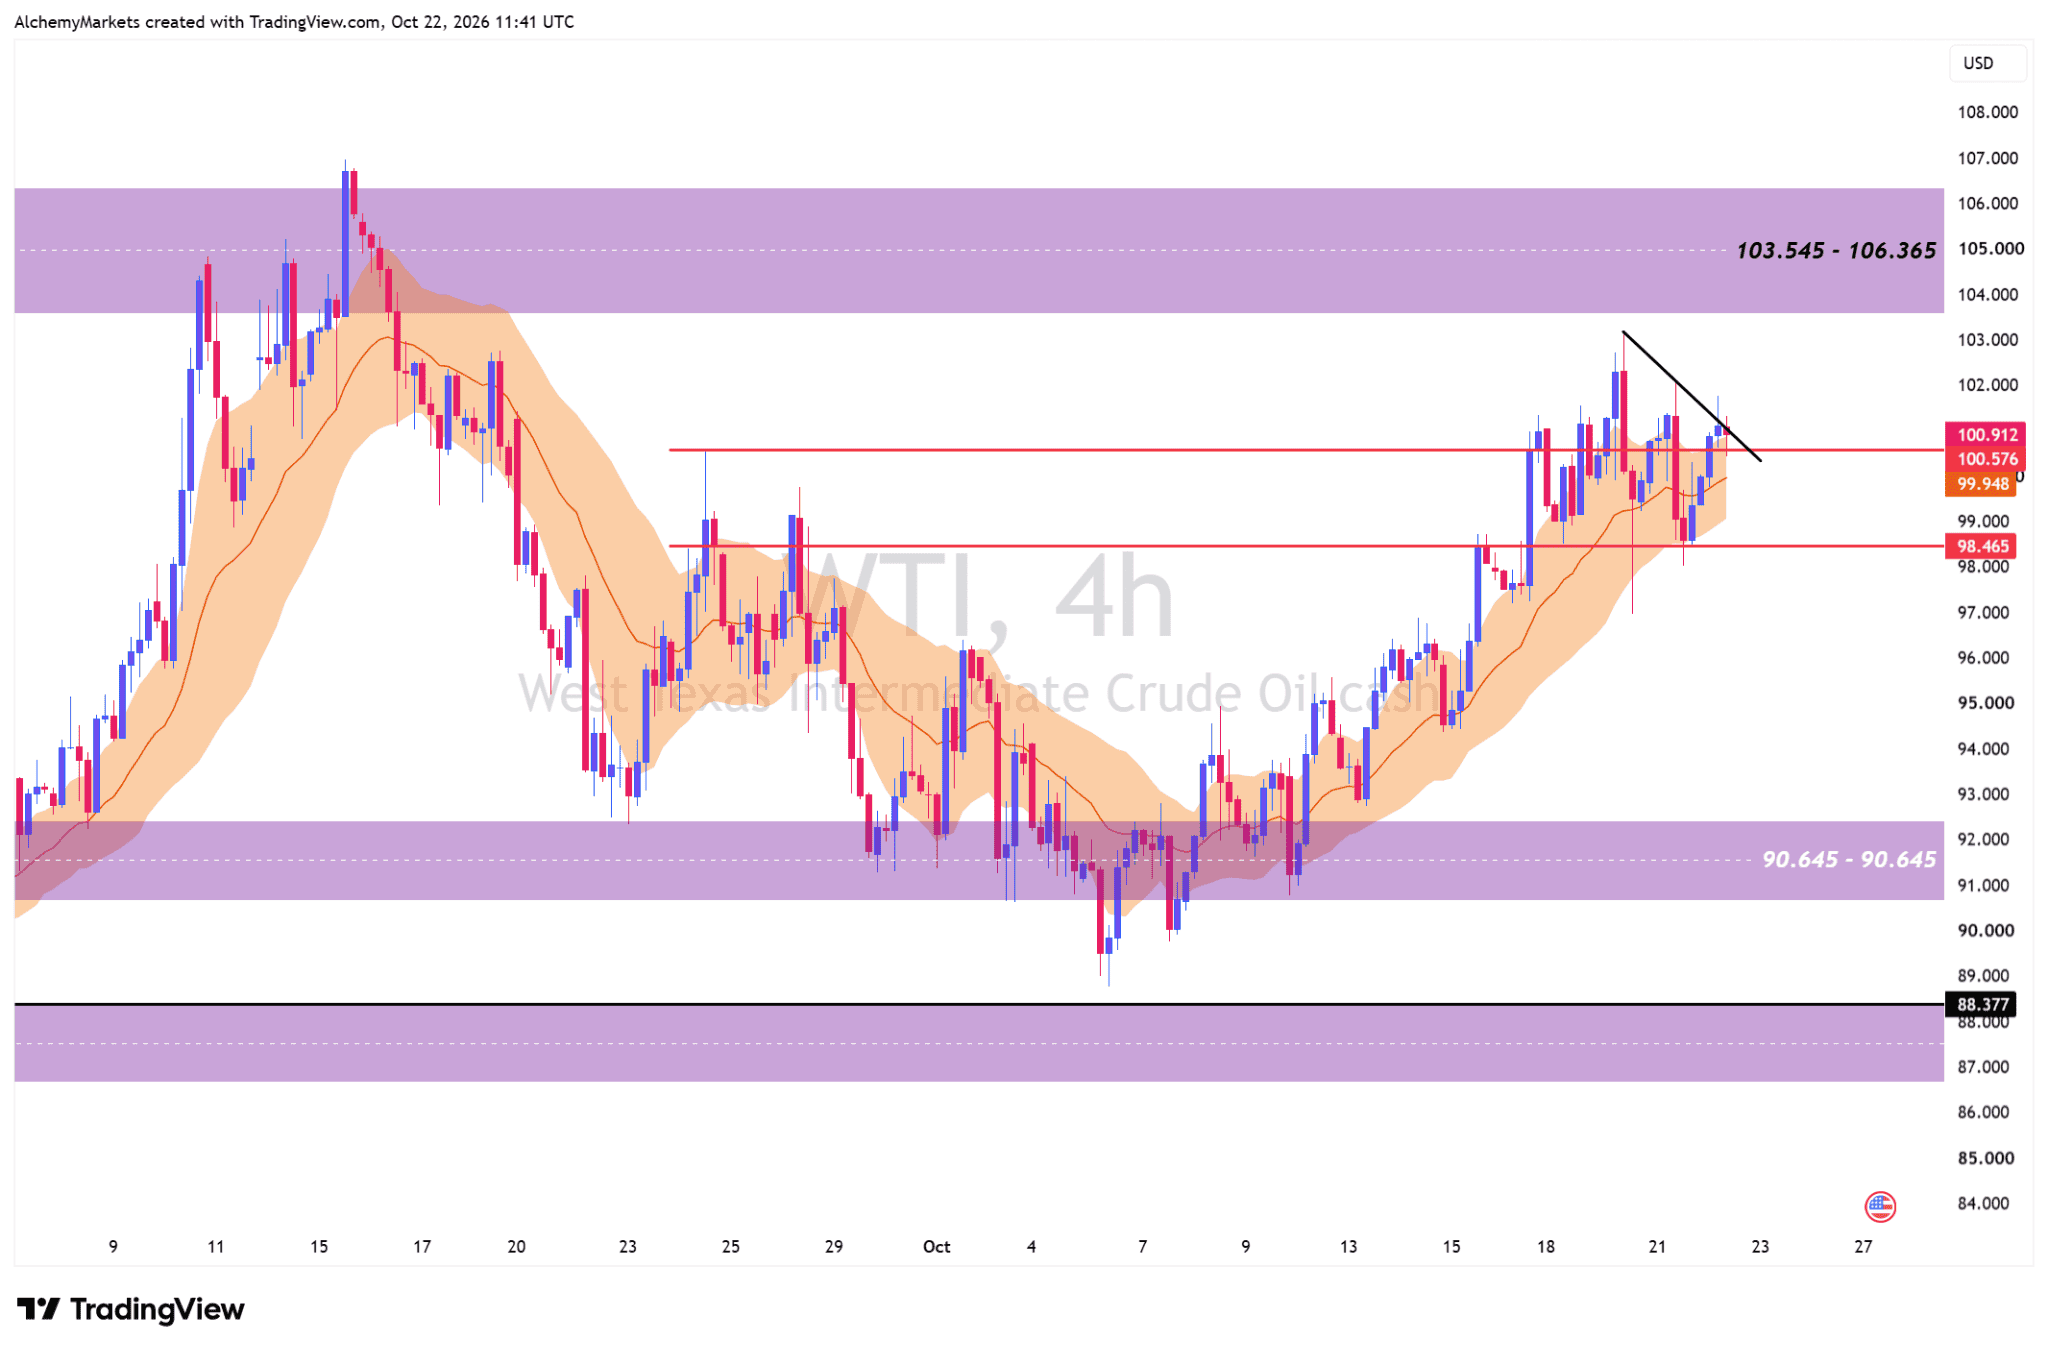
WTI tells a similar story, but with a small catch. Its 4H 20 EMA band, centred near $99.95, is still supporting price at about $100.91. Yet a descending trendline is sitting almost directly above the latest candles.
A confirmed break through that trendline would put 103.545–106.365 back in view. Losing $98.465 would instead be the first stronger sign that the oil rally is tiring.
Why the S&P 500 could open lower
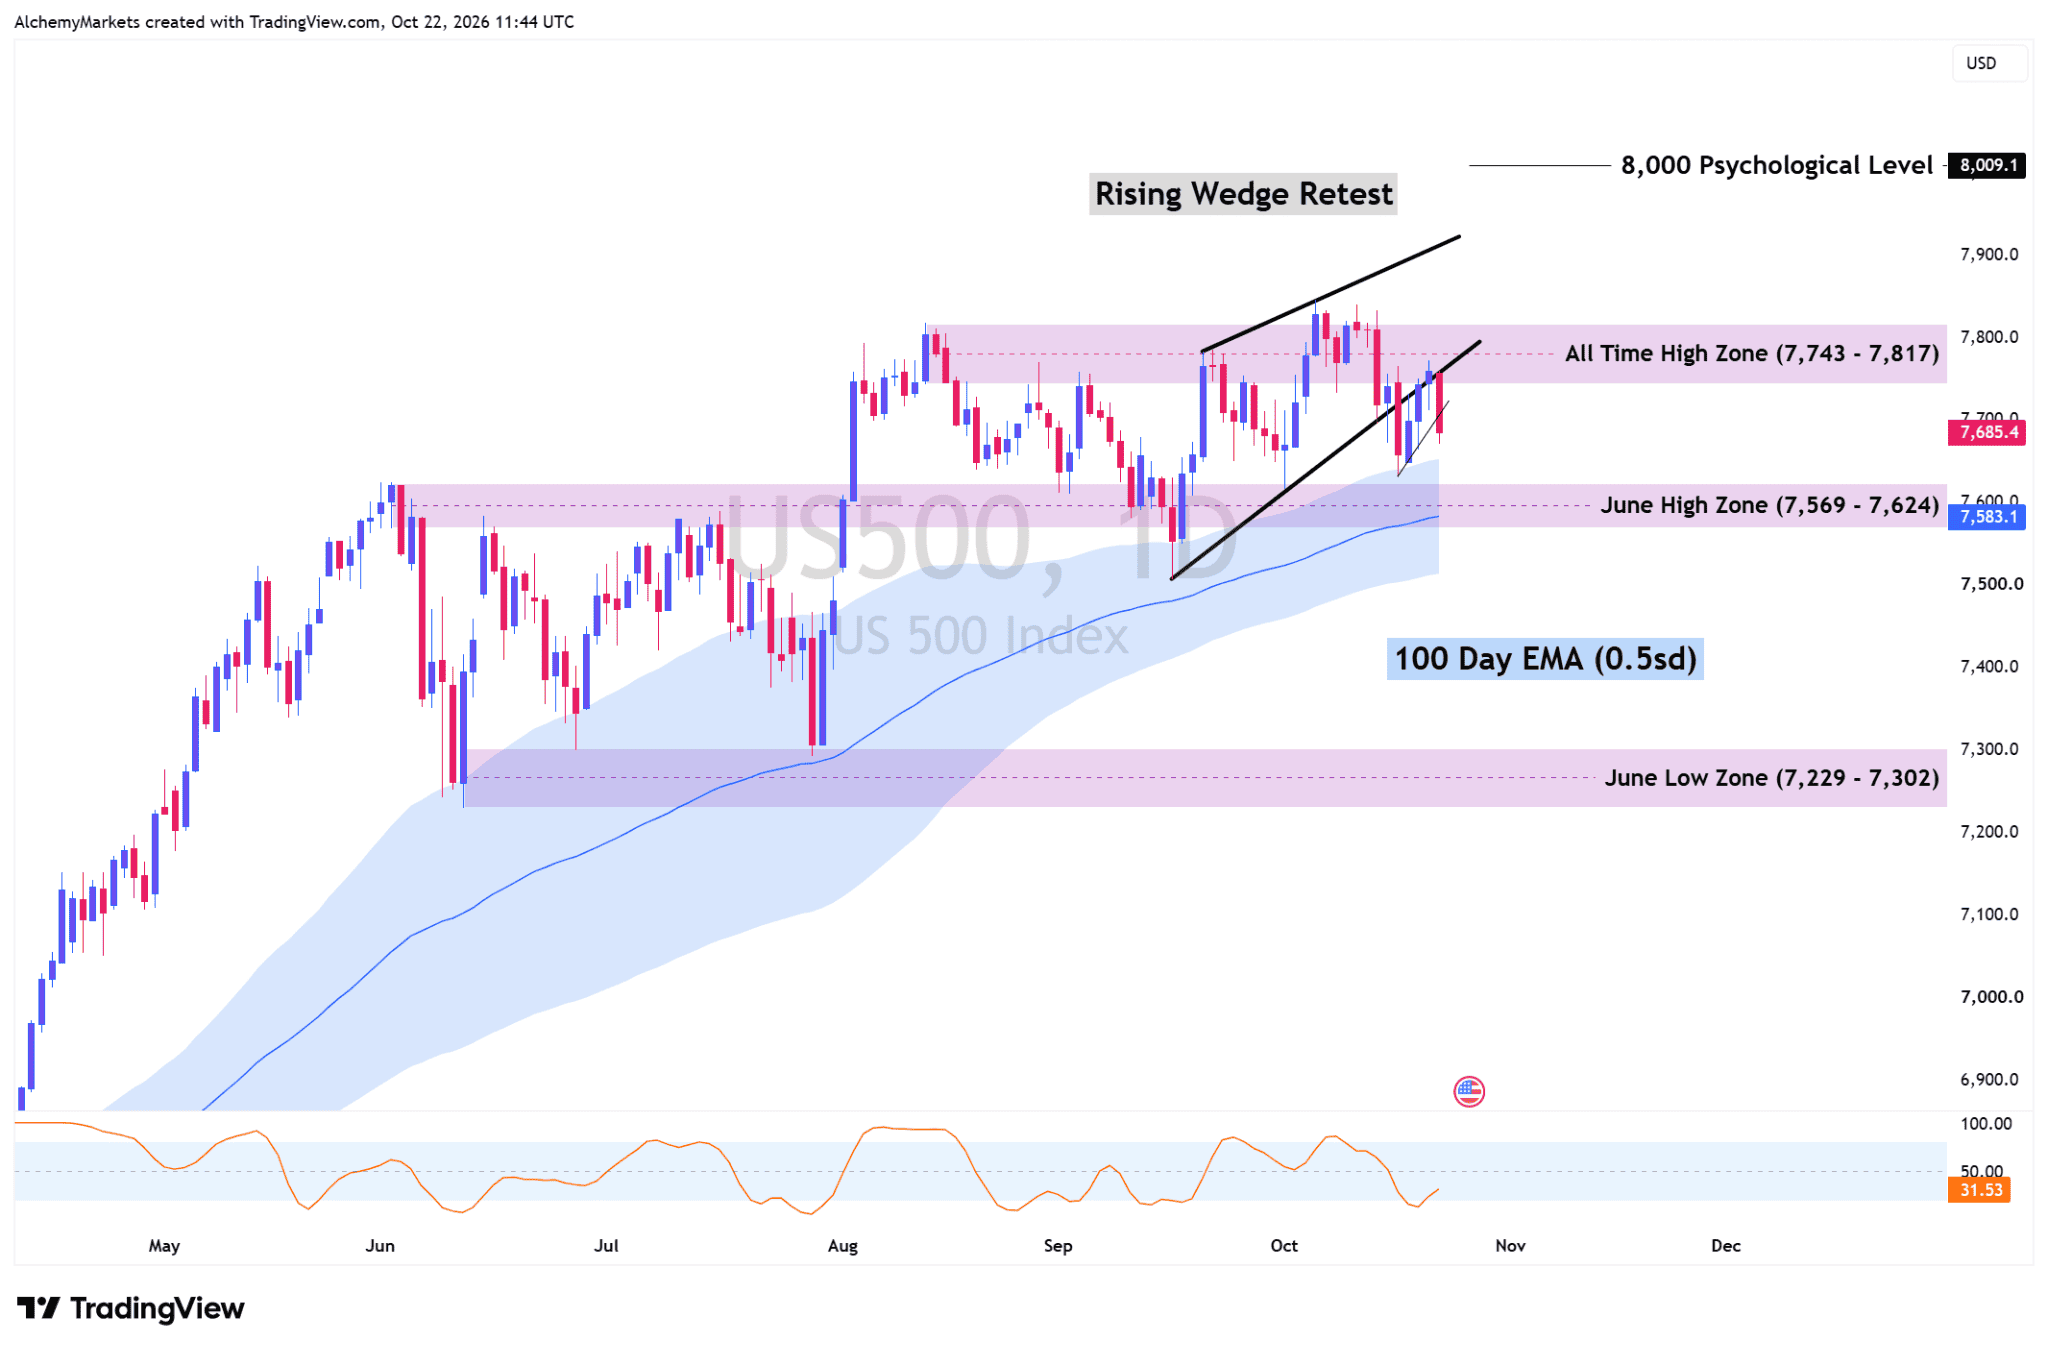
Now look at the US500, the CFD of S&P 500. After breaking below its rising wedge, price has rallied back towards the underside of the pattern. For bears, that is exactly the sort of retest they want to see fail.
At the time of writing, this rejection is holding. The 7,569–7,624 area and the 100-day EMA near 7,583 are the key support levels to watch.
A firm reclaim of the wedge and high zone would weaken the bearish case.
Higher crude can squeeze transport and manufacturing costs and keep inflation worries alive. That can leave the Federal Reserve with less room to ease, while weighing on equity valuations. Oil strength does not guarantee a stock sell-off, but it adds to the downside case ahead of the US cash-market open.
My bias for the open is lower while the US500 remains beneath its wedge retest and Brent holds near resistance. The warning would be a sharp oil reversal or a convincing recovery in the index.
Both would tell us that the market is no longer buying the same fear.