


Written by:


- Chart of the Day
- September 22, 2025
- 2 min read
Over $1B Liquidated Today in Bitcoin: Leverage Flushout
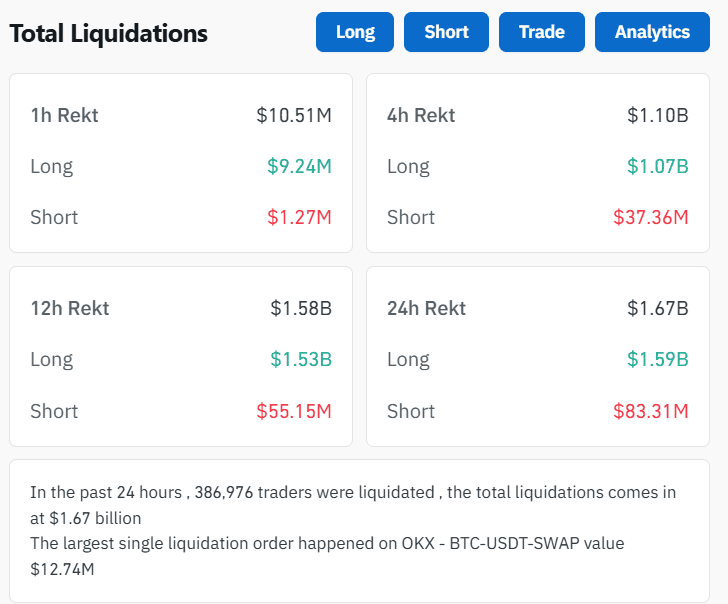
According to Coinglass’s liquidation tracker, roughly $1.59B in long positions were wiped out today — proof that retail apes who chased weekend highs got caught on the wrong side.
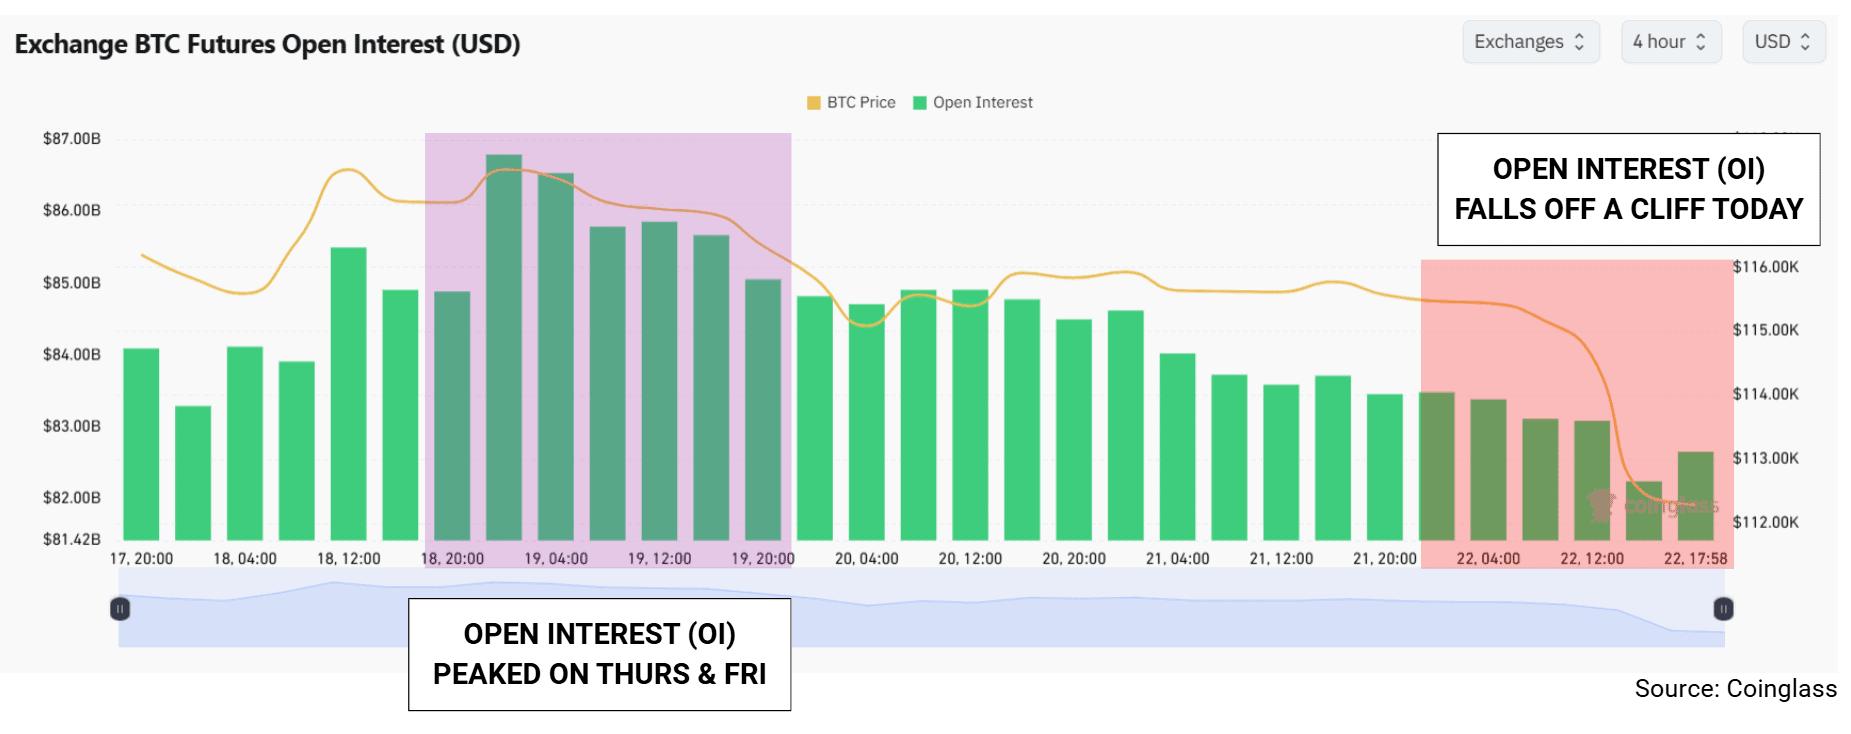
At the same time, open interest has rolled over rapidly today, underscoring a classic leverage washout. It’s the kind of reset that clears out weak hands and forces the market back to neutral.
So will Bitcoin’s bullish rally continue?
While long term structures are not threatened, short term signals are mixed. Let’s dive in.
Bitcoin Daily Chart Technical Analysis
SHORT TERM MARKET STRUCTURE IS MIXED
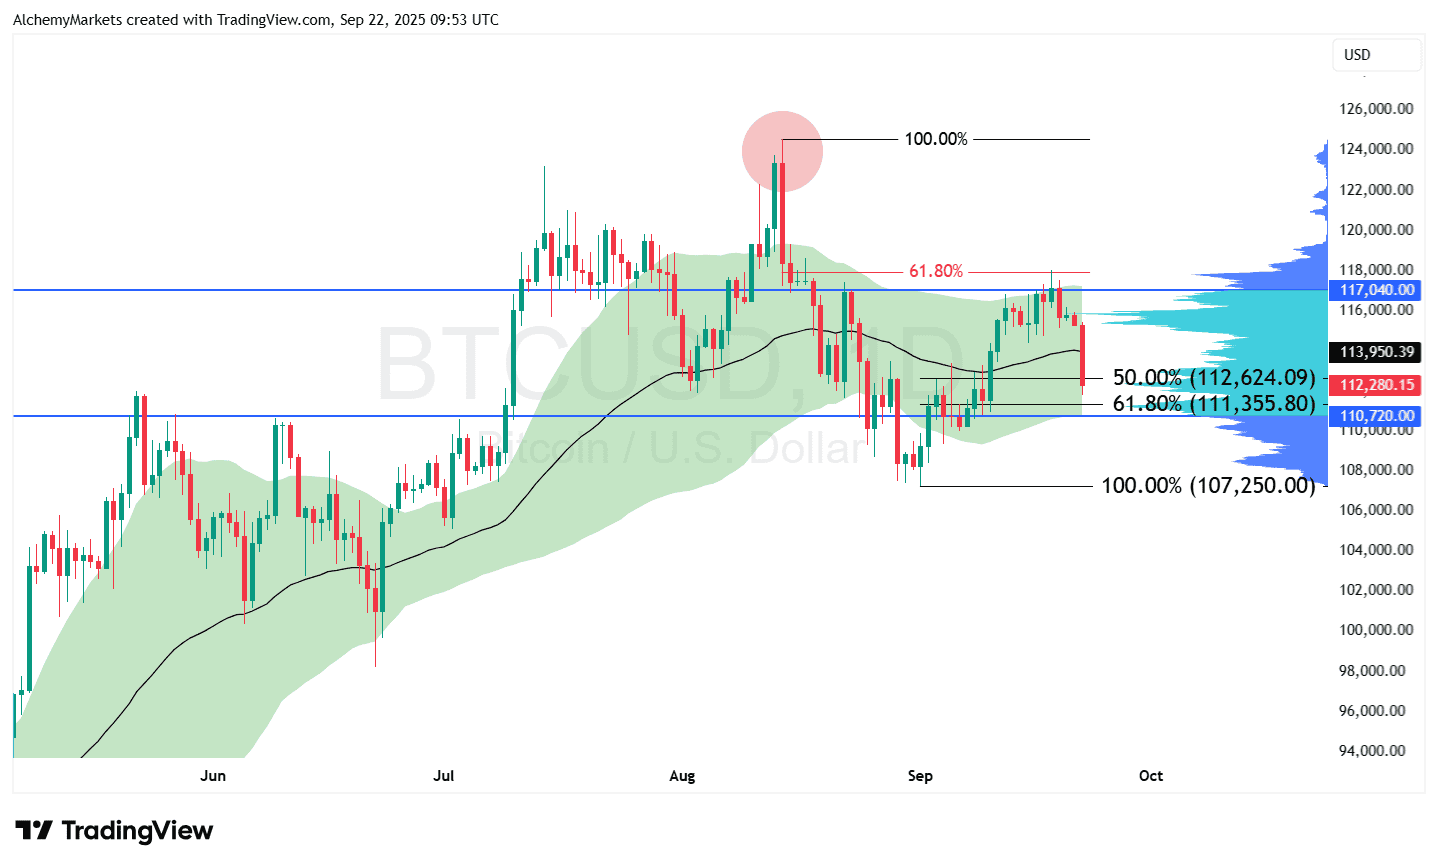
Bitcoin rejected at the 61.8% bearish Fibonacci retracement, forming a lower high. That’s a bearish warning. But so far, the price hasn’t printed a clean lower low — so the structure hasn’t fully rolled over.
EMA BAND TREND ANALYSIS
The daily 50-EMA band (±1 stdev) is holding up as dynamic support. Historically this band has performed as a decent safety net.
If Bitcoin holds above $110,720 (lower stdev of 50-EMA), bulls have room to push towards the 50 EMA near $113,955, and maybe even to the value area high at $117,040.
If the band gives way, BTC likely slides to retest $107,250, the August low. That would confirm the late-August breakdown as a trend shift.
| Note: The volume profile here is anchored to August highs, marked by the red dot. |
IMMEDIATE SUPPORT LEVELS
BTC is sitting right at two critical Fib retracements, both overlapping with high-volume nodes on the anchored volume profile (set from the August 14th peak):
- 50% retracement: $112,624
- 61.8% retracement: $111,356
These zones could generate a bullish reaction due to their historical volume and fibonacci significance, but beyond that, we have $110,720 — which is the bottom of the 50-EMA band and the value area low.
Lose that area, and Bitcoin could see deeper corrections towards even the $97K.
The Bottom Line
Was there a leverage flushout? Yes — $1.59B in long liquidations confirms it.
Is it over? Not yet. BTC needs to defend the Fib + EMA confluence around $111–$112k.
Scenarios:
- Bullish = defend support, target 113.9k → 117k.
- Bearish = crack 110.7k, target 107.2k.
This flushout may have flushed out weak hands, but whether it marks a bottom depends entirely on how Bitcoin reacts at these nearby supports. The critical deciding factor is that Bitcoin holds the bottom of the green bands on the daily timeframe, and that aligns with the value area low of $110,720.


