


Written by:

- Chart of the Day
- April 8, 2025
- 2 min read
Bitcoin Back to $80K: Liquidity Grab Candle Implies Reversal
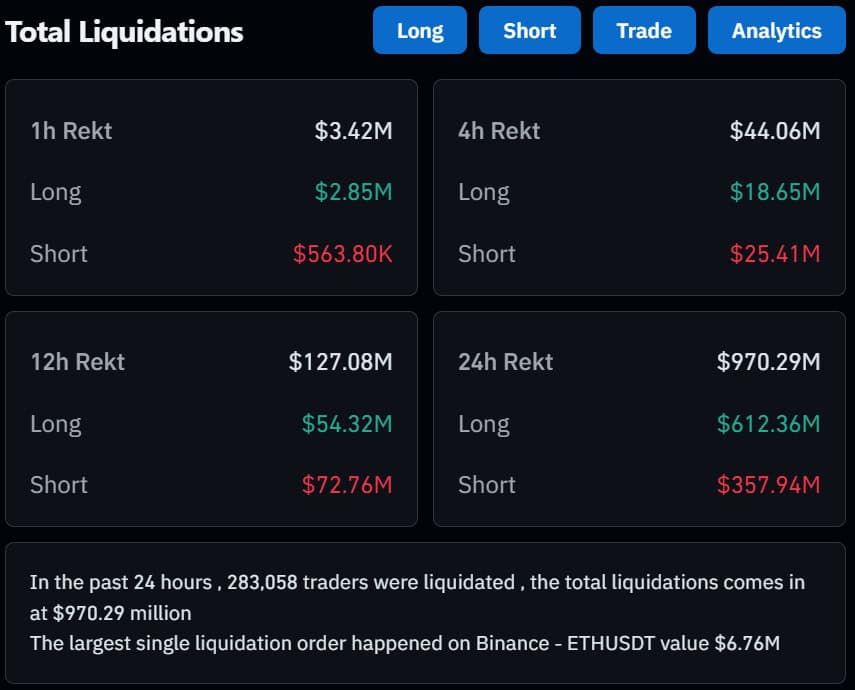
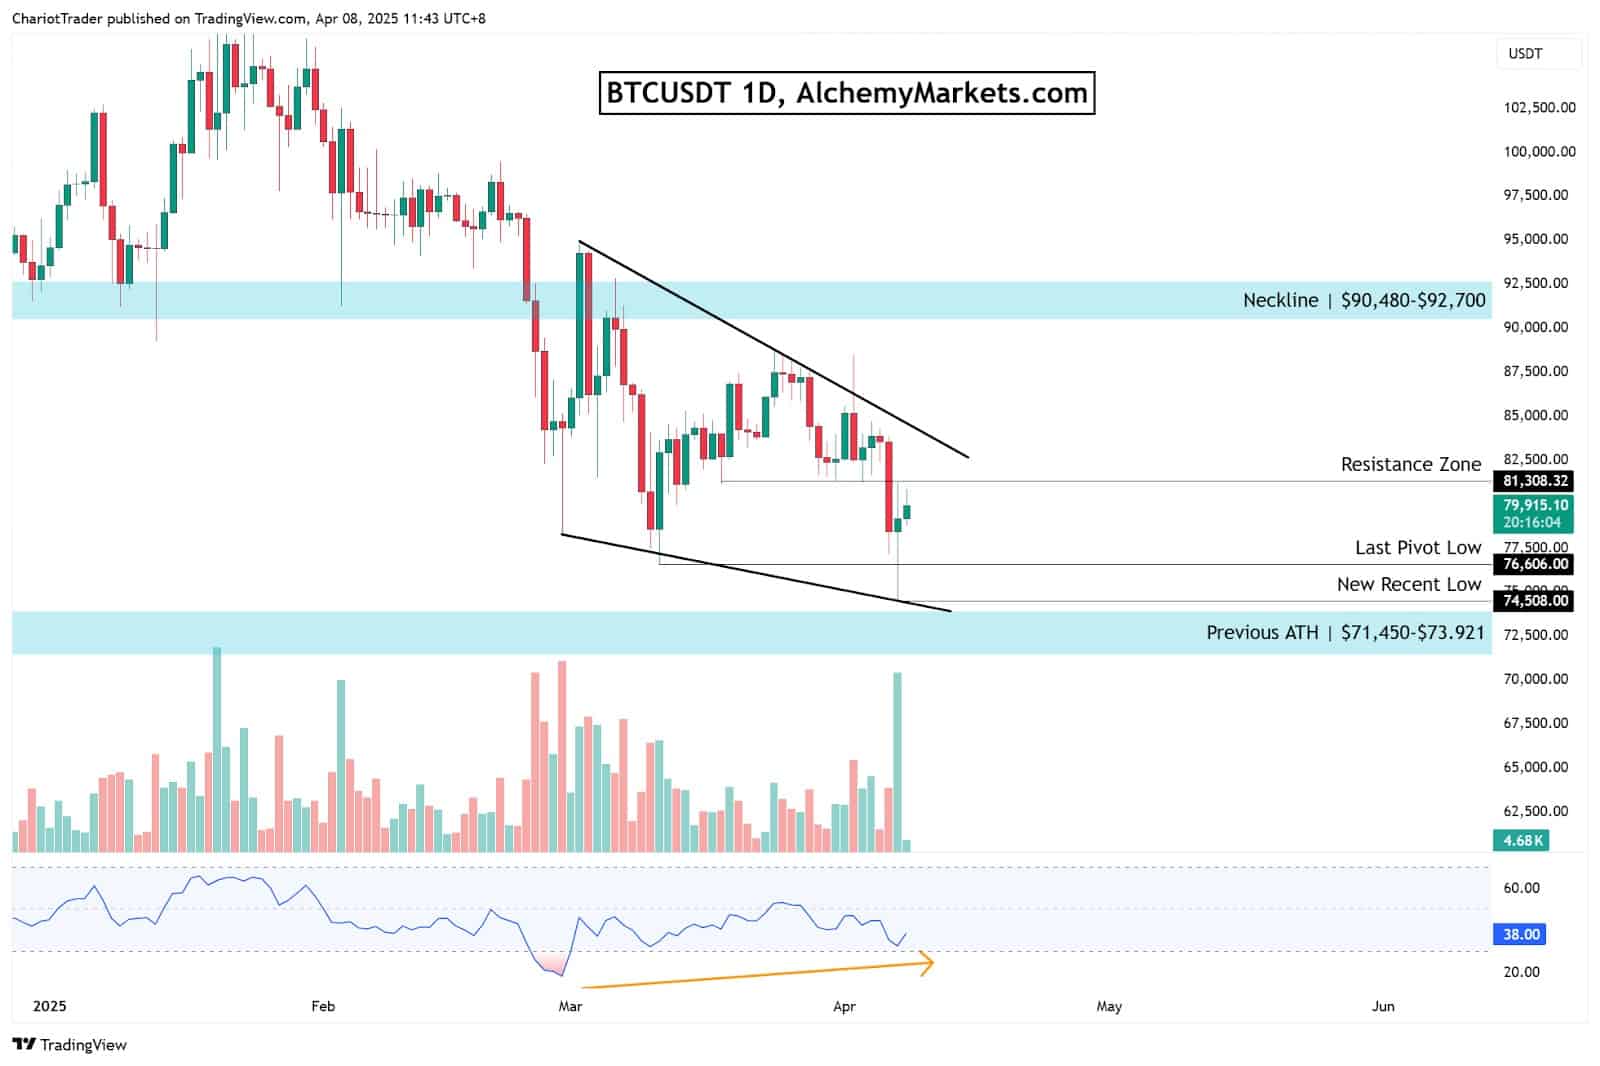
Bitcoin has fallen as low as $74.5K yesterday, liquidating approximately $970 million across crypto exchanges in the last 24 hours. Then, the asset closed above its last pivot low at $76.6K—and formed a wick of over 5%.
This beautiful, yet nasty price action comes with a few bullish implications for Bitcoin:
- We witnessed a liquidity grab, where long traders were effectively ‘long squeezed’ and forced out of their positions.
- When the long traders are forced to sell at speed, buy orders are filled at speed, strengthening the possibility of a revesal.
- Bitcoin has technically closed at $79.1K, higher than its previous pivot low.
However, we are not out of the woods yet, Bitcoin must close today’s candle positively to show buyer strength and follow through.
Bitcoin Resilience: Huge Volume Spike with Bullish Divergence
Go over to the BTCUSDT daily chart, and you noticed a few things:
- The liquidity grab candle formed with a large volume spike, validating its role.
- Bitcoin has managed to retap into $80K twice in the past two days, showing some resilience.
- A falling wedge pattern appears to be forming, a bullish reversal chart pattern.
- A regular bullish divergence appears to be in play with the RSI indicator.
If Bitcoin is to move up higher from here, the entire crypto markets should experience some recovery as well. However, this would also be dependent on the SPX’s performance.
Bitcoin currently is traded like it’s a tech stock/risk-on investment, rather than its intended purpose of being a safe haven (like Gold), and therefore correlates to the SPX.
Keynote: If the SPX continues to decline, then so will Bitcoin’s price.
For more on SPX’s forecast, check out our recent analyses:


