


Written by:

Reviewed by:

- February 6, 2025
- 25 min read
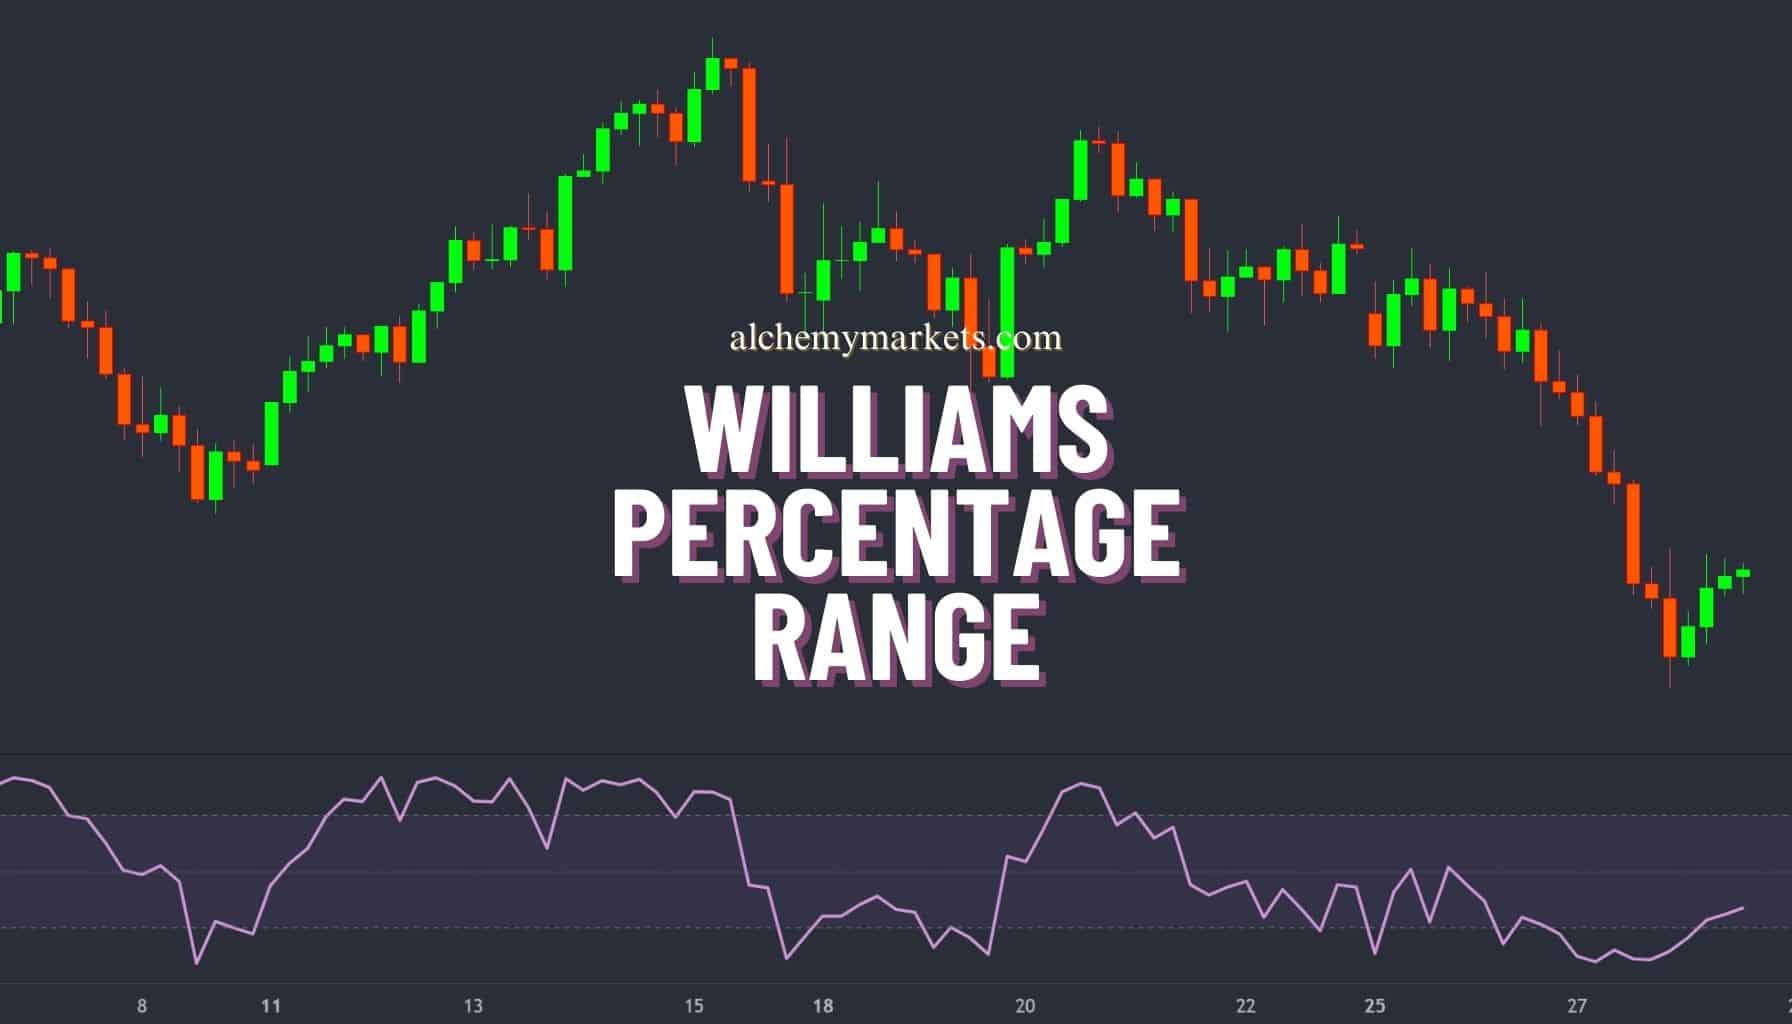
Williams %R (Williams Percentage Range)
What is the Williams %R Oscillator?
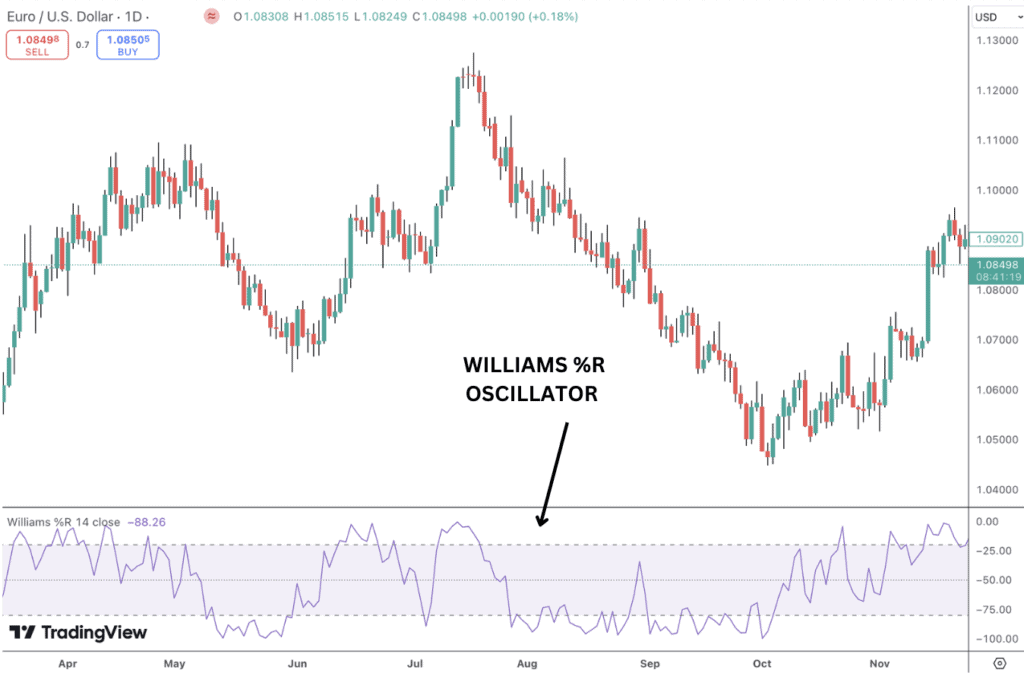
The Williams %R is a momentum indicator used in technical analysis to measure trend strength, gauge overbought and oversold market conditions and help time entries and exits. The indicator, also known as Williams R, was developed by famed commodities trader Larry Williams in the 1970s.
To measure the strength of the current trend, the Williams R compares the current price to its recent range of prices. As a result you can determine the trend’s direction and spot when the current trend’s momentum may be slowing. In range-bound markets lacking a trend, the Williams Percent Range indicator can be a valuable tool for spotting reversals due to extreme indicator readings.
Definition and Purpose of the Williams %R Oscillator
- The Williams R oscillator is a momentum oscillator that measures the level of the current closing price relative to the highest high and lowest low for a given look back period.
- It is used to identify overbought and oversold conditions, as well as trend reversals and momentum shifts.
- Similar to other technical indicators, the Williams R momentum indicator can be used for trade signals as well as trade management.
What Does the Williams %R Indicator Indicate?
The Williams R compares the current closing price to the high-low range over a specific period, typically 14 days, generating values between 0 and -100. As a result, the %R is one of the more effective momentum indicators for trending markets, it can tell you trend direction and if there has been a loss of momentum that signals traders when to take a position.
In range bound markets, traders will typically use the indicator for reversal trading from extreme indicator readings. In trending markets, however, the indicator is less reliable as a reversal tool. If price is trending heavily in one direction the indicator is likely to stay in extreme territory. Indeed, failure of price to reverse from extreme indicator levels can be a good early warning sign that a trend is developing. For example, if the indicator remains in oversold territory and price is pushing lower, we likely have a strengthening bear trend.
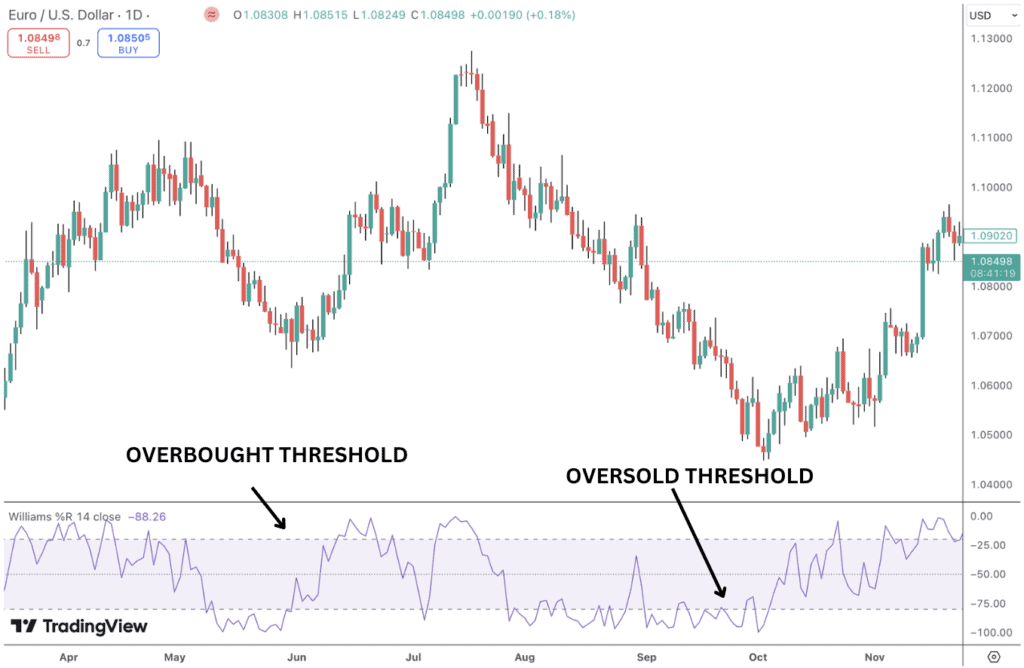
Overbought Conditions:
The %R region between -20 and 0 is considered the overbought region. When the percent range value is above -20, the market is in a strong uptrend. When the %R falls below -20, the asset’s bullish momentum has slowed due to a pullback and may be reversing.The cross below -20 can be used as a short entry to capture a reversal lower.
Oversold Conditions:
The %R values between -80 to -100 is considered the oversold zone. When the %R falls below -80, the market is considered in a downtrend as it approaches the lowest levels within its recent range. When the percent range rallies back above -80, then the bounce may suggest a bullish reversal is underway as downward momentum has slowed. Typically, traders will consider long positions when the Williams R moves back above -80.
Importance of Williams %R Indicator
The Williams percent range indicator is an important type of momentum oscillator for several key reasons:
- Identifying Overbought and Oversold Conditions: The Williams R helps traders flag overbought and oversold levels in the market, warning of potential reversal opportunities. When the %R moves above -20, it signals that an asset is strengthening but may be overbought and vulnerable to a reversal lower. Readings below -80 indicate that price is weakening but might be oversold and vulnerable to a reversal higher. This helps traders anticipate potential reversals or corrections in price via oversold readings and overbought readings as an early warning sign.
- Reversal Trading: Traders looking to time market reversals often use the Williams R to identify turning points. In overbought conditions, a drop in the Williams R from the upper range to below -20 may signal a sell opportunity, while a rise from the oversold zone above -80 suggests a potential buying opportunity.
- Momentum Measurement: Williams R tracks the position of price relative to the recent high-low range. A rising indicator line means bullish momentum is increasing with price rising while a falling line means bearish momentum is increasing as price moves lower. If the price moves into overbought territory, that can signal a bull trend is emerging or that momentum is overstretched and a reversal is likely. Traders should remain with the trend until reversal signs develop.
- Versatility Across Markets: The Williams R can be applied across different asset classes and timeframes, making it a versatile tool for all types of traders.
How to Calculate Williams %R
If you’re interested in understanding how to calculate the Williams R yourself, its a very simple process. You can follow these steps:
1- Choose the Lookback Period: Decide on the number of periods, N, you want to look back. The most common period used is 14 days, but this can be adjusted based on your trading strategy.
2- Find the Highest High: Over the past N periods, find the highest price. For example, if using 14 days, find the highest price in the last 14 days.
3- Find the Lowest Low: Over the past N periods, find the lowest price.
4- Get the Current Close: Take the closing price for the most recent period.
5- Apply the Williams %R Formula: Substitute the values into the formula below:
Williams %R Formula
Williams %R = (Highest High−Close) / ( Highest High−Lowest Low) x (-100)
Where:
- Highest High = The highest price during the look-back period (e.g., the highest price in the past 14 days).
- Lowest Low = The lowest price during the look-back period.
- Current Close = The most recent closing price.
For example, if the highest high in the last 14 days is $105 and the lowest low in the last 14 days is $95 and the current close: $100 then
Williams R = (105-100) / (105 – 95) x -100 = -50
This simplifies to:
=5/10 × −100= −50
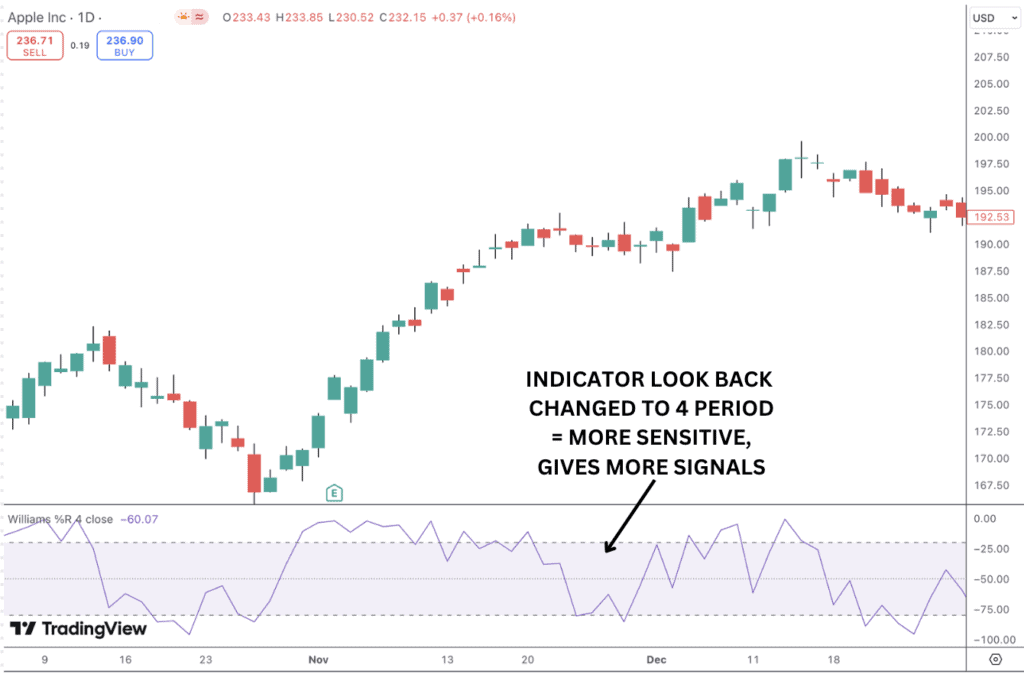
Adjusting the Lookback Period
Adjusting the look back period will alter the portion of recent price action the indicator is measuring. If the look back period is made shorter the Williams momentum indicator will be more sensitive with more signals, while a longer look back period will make it less sensitive, with less signals.
Let’s look at the same APPLE chart, but this time, we’ll change the indicator lookback period to 4, making it more sensitive. You can see how different the indicator readings are and how many more signals we get now that the indicator settings are shorter.
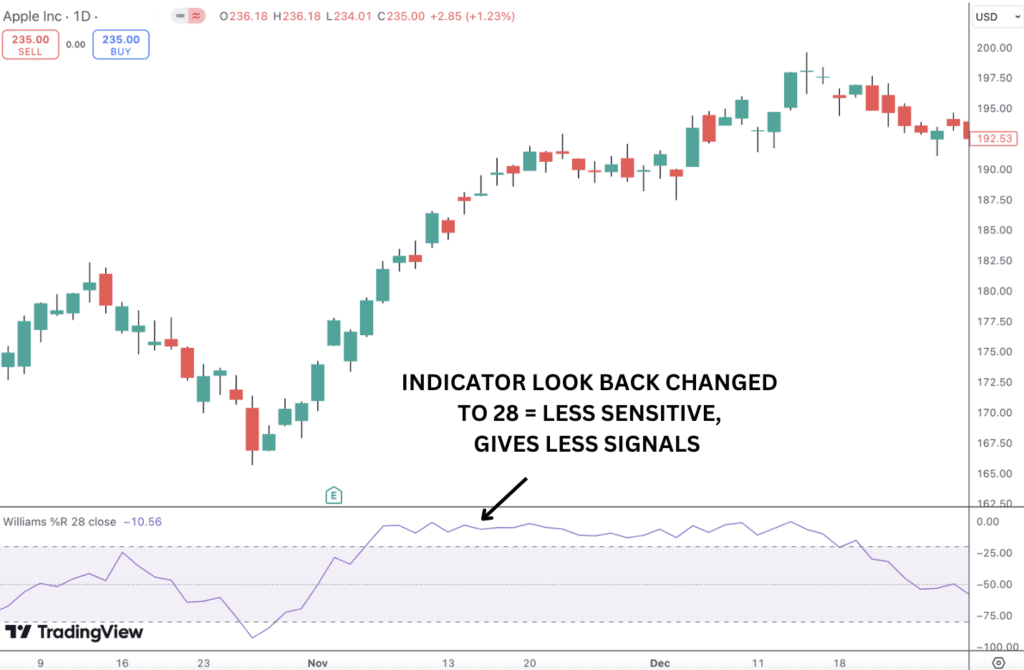
This time, we’ll change the look back period to 28 (double the default 14 setting), and notice how different the indicators readings are again with much fewer signals given.
Williams %R Examples
The way traders can use the Williams R indicator is split into two camps.
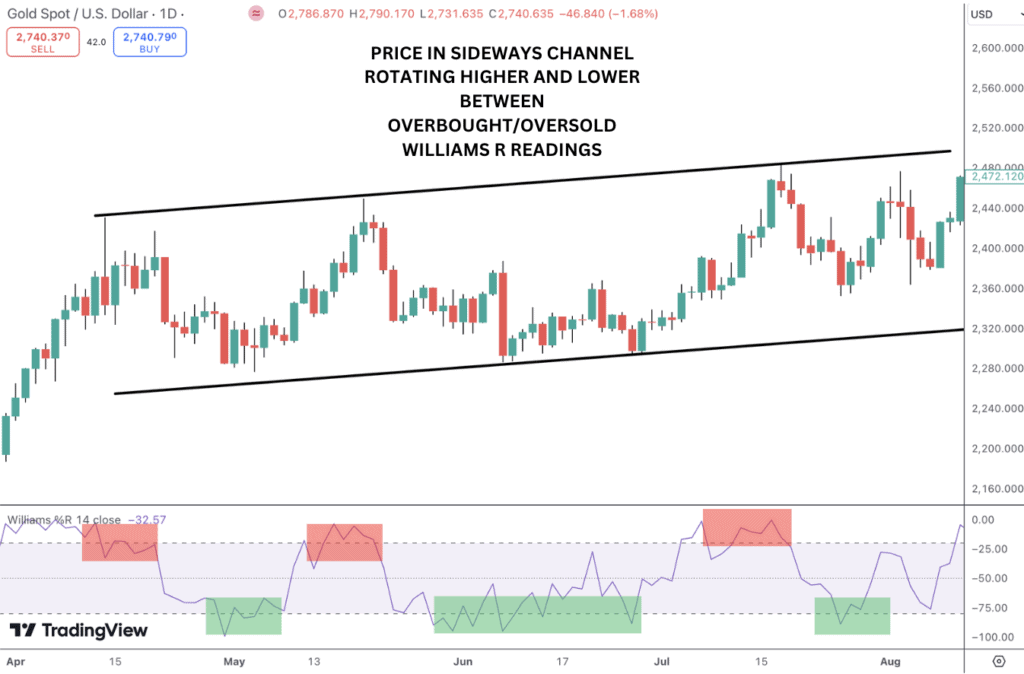
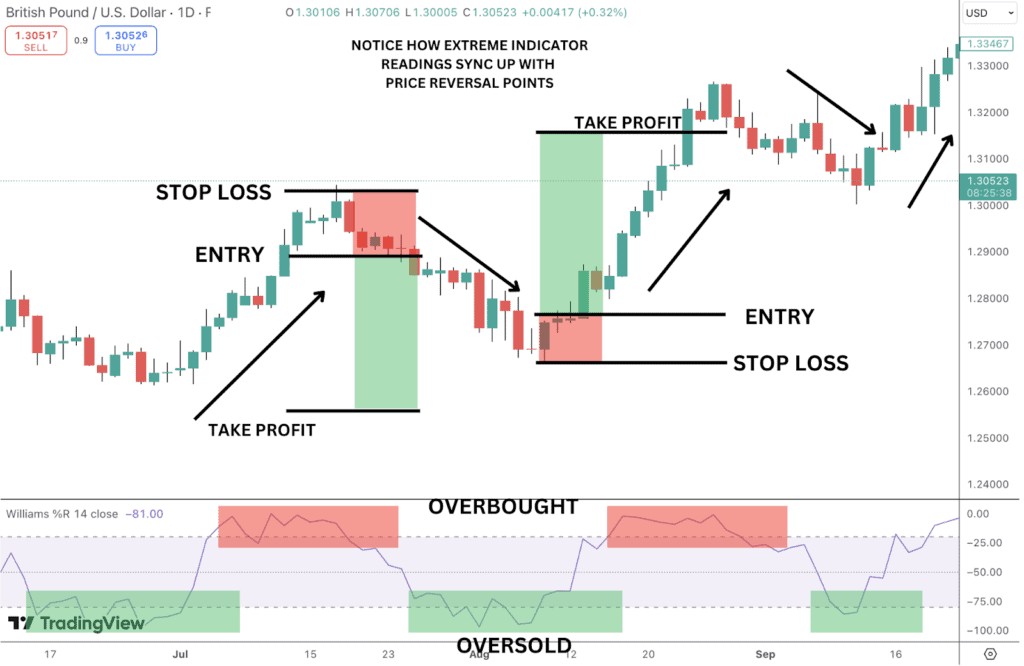
The first is to use the tool for reversal trading during range bound conditions. When the market is rotating between support and resistance, we can use confluent overbought or oversold signals on the indicator to time our entries. The image below shows how the indicator performs during a ranging market in a sideways channel.
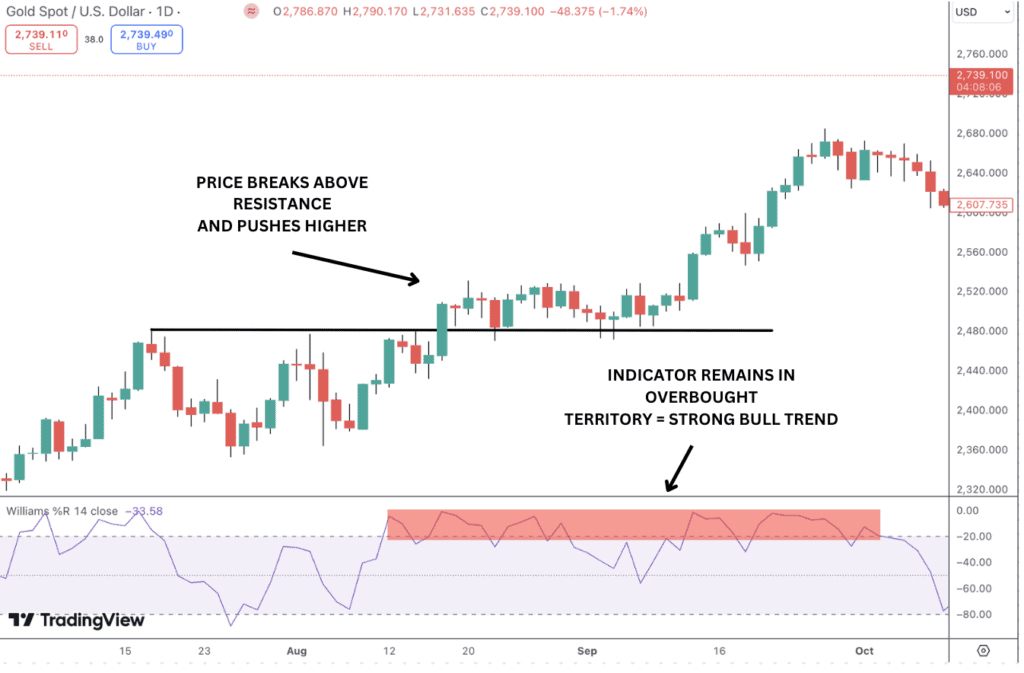
The second way to use the indicator is to identify trending markets. Think about it for a moment. The indicator is telling us where the current price is in relation to the recent price range. Therefore, persistent overstretched readings illustrate that the price is pushing hard in one direction (trending).
Once we can identify these conditions we can look to align our trading bias with its directional signal to capitalise on the momentum. Below, we can see the price trending higher while the indicator remains in overbought territory. With the indicator holding above the 50% line we know that price remains in the top half of the recent range signaling a strong trend.
Williams %R Trading Strategies
The Williams R is a highly versatile technical indicator which can be deployed effectively on all time frames and across all asset classes. Over the following sections we will explore a range of different trading strategies utilsing the indicator, following a detailed look at how to use the indicator in combination with other indicators.
Identify Trend Strength
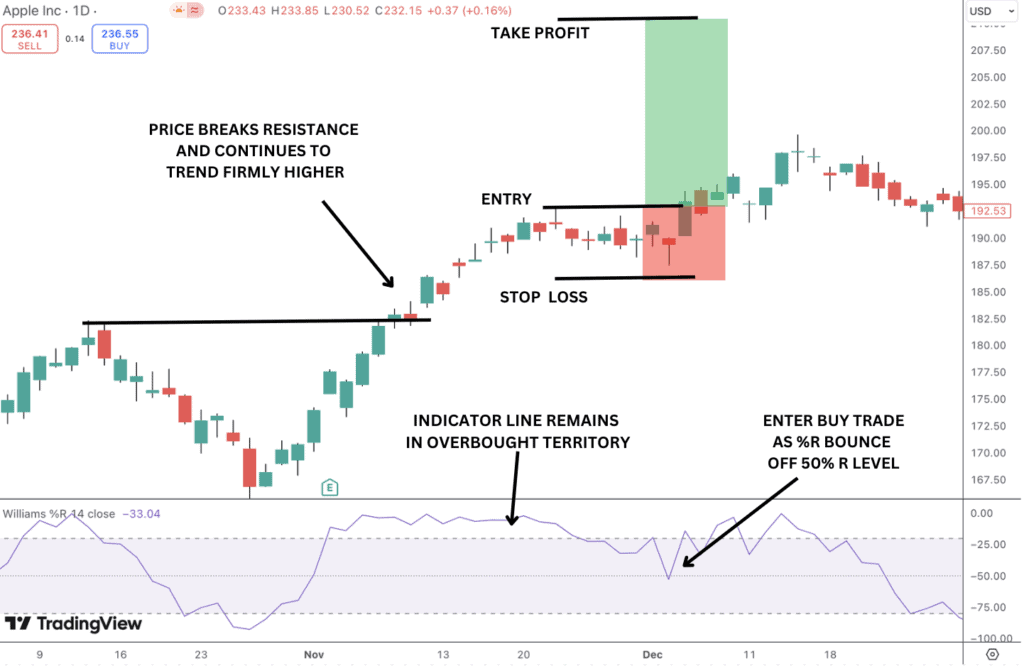
One of the primary uses for the Williams R indicator is measuring the strength of price moves in the current trend. If the Williams percent range indicator line is moving higher while its in the top half means that momentum is increasing to the upside. On the other hand, a decline in the indicator while its in the top half signals a weakening trend on the verge of reversing.
In strongly trending markets, the indicator line might remain in extreme overbought territory for an extended period of time. Looking at the chart below we can see that Apple breaks out above resistance above the previous high. As the price is trending higher, the Williams R stays in overbought territory. This tells us to only look for long trades while the indicator holds above the 50% R line. In this scenario we could even enter a long trade as the indicator turns higher off the 50%R level for a continuation of the bull trend.
Identify Trend Reversals
One of the most effective uses of the Williams R indicator is spotting trend reversals. Given the information the oscillator gives us about trend strength, we can use the indicator to anticipate potential trend reversals when there is a shift in the momentum readings.
The image below shows an example of how we can trade a trend reversal as price moves higher from a double bottom formation (a test of previous support) and the Williams R moves higher from oversold territory.
Identify Momentum Shifts
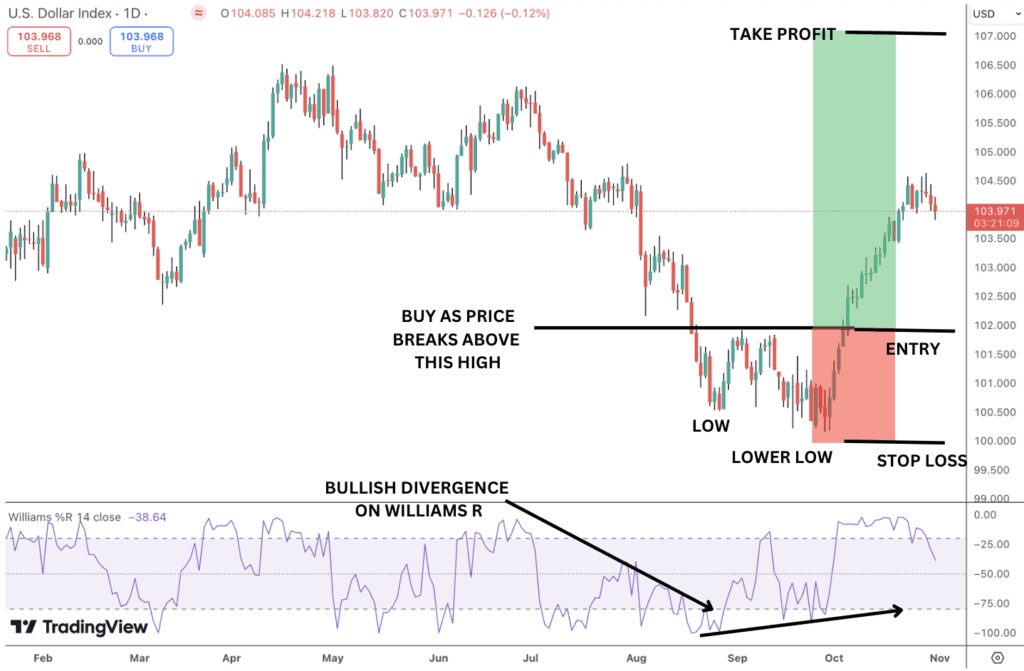
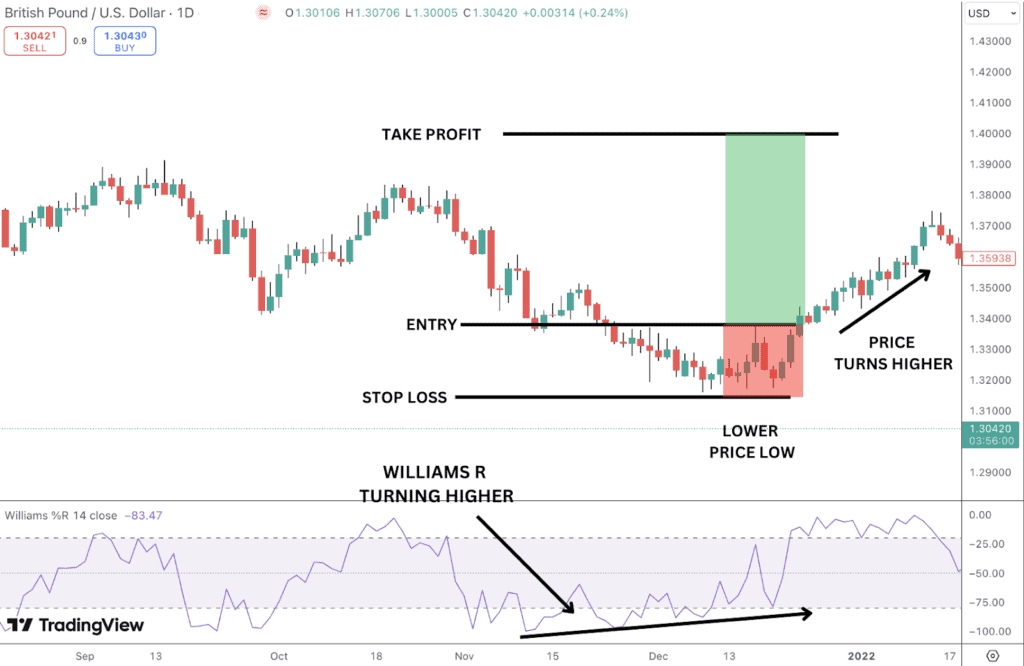
The Williams Percent Range oscillator can be used to identify potential trend reversals by looking for divergences between the indicator and price action. In the image below, see how the Williams R is turning higher as price makes a lower low, alerting us that momentum is waning. We can then enter a long position as price breaks above the last swing high and the Williams R moves up for oversold.
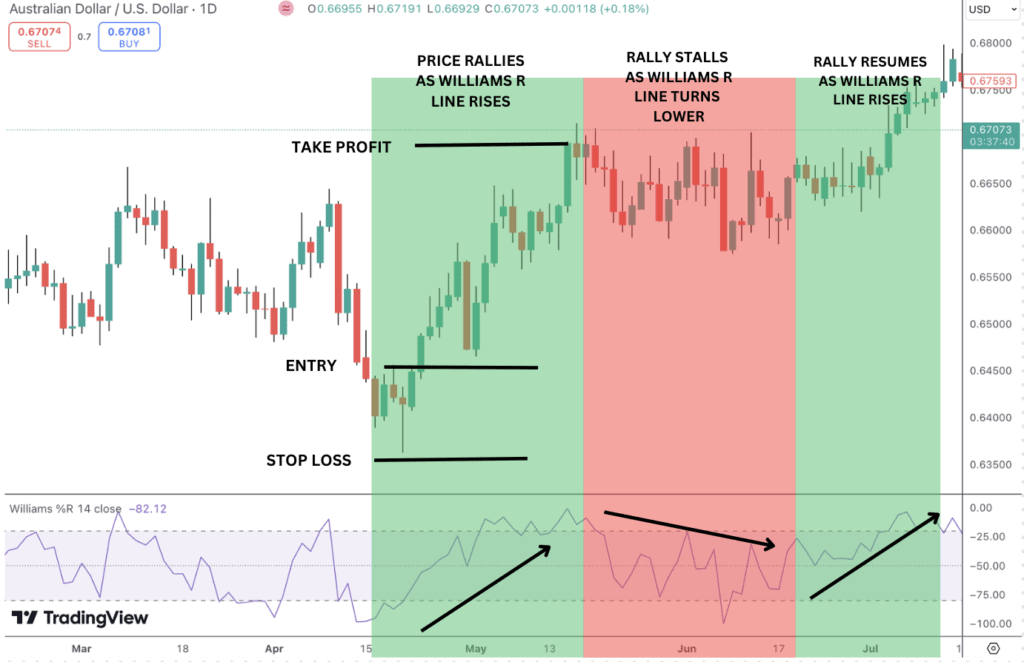
It can also be used to identify momentum shifts by looking for changes in the indicator’s slope and direction.
In the image below, look how the changes in price momentum are reflected in the Williams R line, offering opportunities for buying/selling.
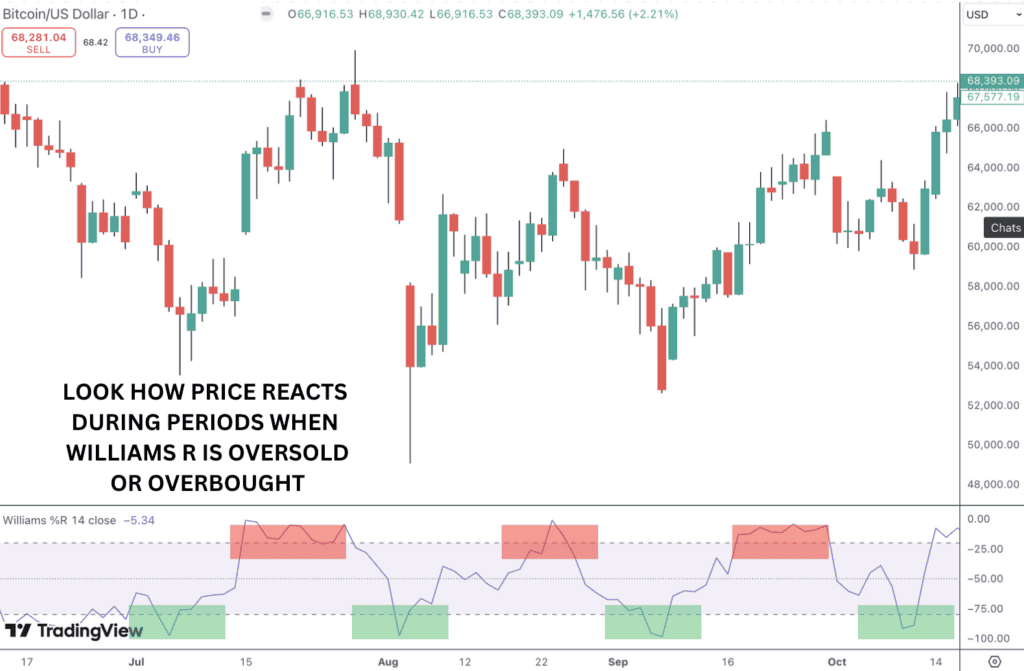
Overbought/Oversold Levels
One simple yet very powerful way to use the Williams R momentum indicator in your trading is to monitor price as the indicator reaches the oversold threshold or overbought threshold.
- Overbought: When the Williams R rises above then falls back below -20, it indicates that the asset is overbought with weakening momentum. Traders can look for potential sell signals when the percent range crosses down below -20 from these overbought levels. Overbought readings on their own are not necessarily a trade signal but it can alert traders to the potential for a trade.
- Oversold: When the indicator falls below and crosses back above -80, the market is considered oversold with weakening momentum. Traders can look for buy signals when the per cent range indicator crosses up above -80 from oversold territory, indicating a reversal. Oversold readings on their own are not necessarily a trade signal but can alert traders to the potential for a trade.
Momentum Failure
One of the easiest ways to spot momentum failure in the Williams R oscillator is through identifying divergence. Divergence simply refers to a situation where the indicator readings aren’t supporting the price moves we’re seeing, alerting us to a potential forthcoming price reversal.
Bullish Divergence:
This occurs when the price of an asset is pushing lower or making new lows, but the Williams R is no longer reaching the same oversold levels (below -80). This divergence can suggest that bearish momentum is weakening, potentially signaling a forthcoming trend reversal to the upside.
In the image below we can see an example of bullish divergence where price is moving lower but the Williams R is turning higher. As price makes a lower low, the indicator forms a higher low. This tells us the bear move is running out of steam and is vulnerable to a reversal higher.
Bearish Divergence:
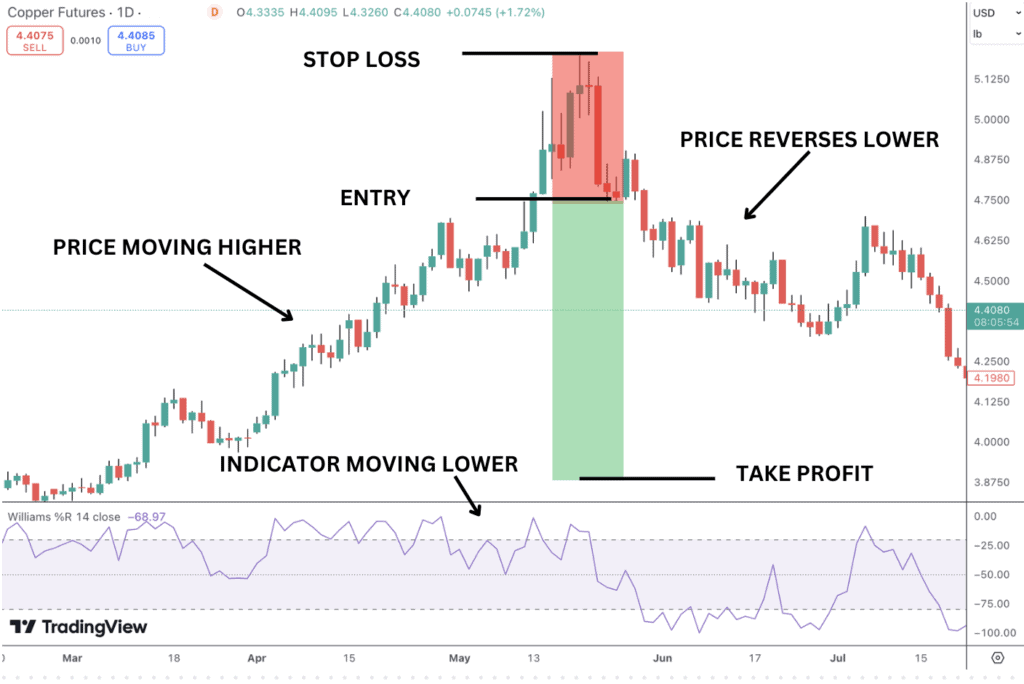
This happens when price makes new highs, but the Williams R fails to reach overbought levels (above -20). It indicates weakening bullish momentum and may signal a forthcoming trend reversal to the downside.
In the image below we can see an example of bearish divergence in Copper. Notice how the price is moving higher but the Williams R indicator line starts to trend lower. This tells us that the bull move is losing momentum and alerts us to the subsequent reversal lower.
Adding a Moving Average to Increase Effectiveness
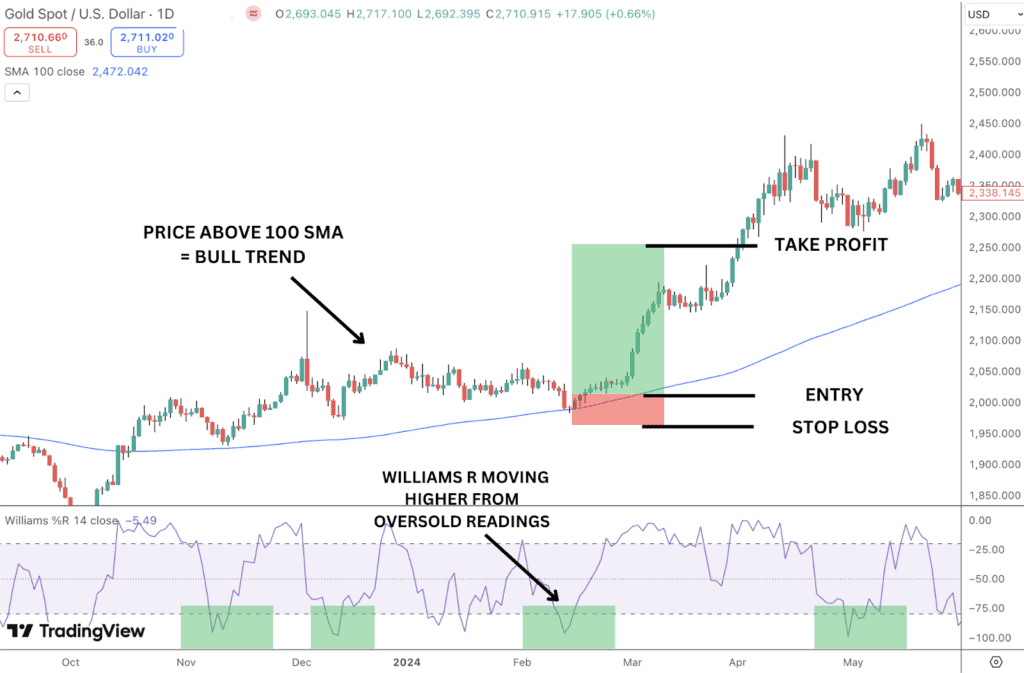
Combining the Williams R indicator with a moving average can boost its effectiveness by providing better confirmation of potential trend reversals, helping to filter out false signals, and improving traders’ chances of identifying the overall market trend. Using moving averages can be particularly helpful in gaining entry during trending market phases.
- In an uptrend: confirmed by price being above a moving average (e.g., 100-period MA), traders can focus on buying signals generated by the Williams R when it exits oversold territory.
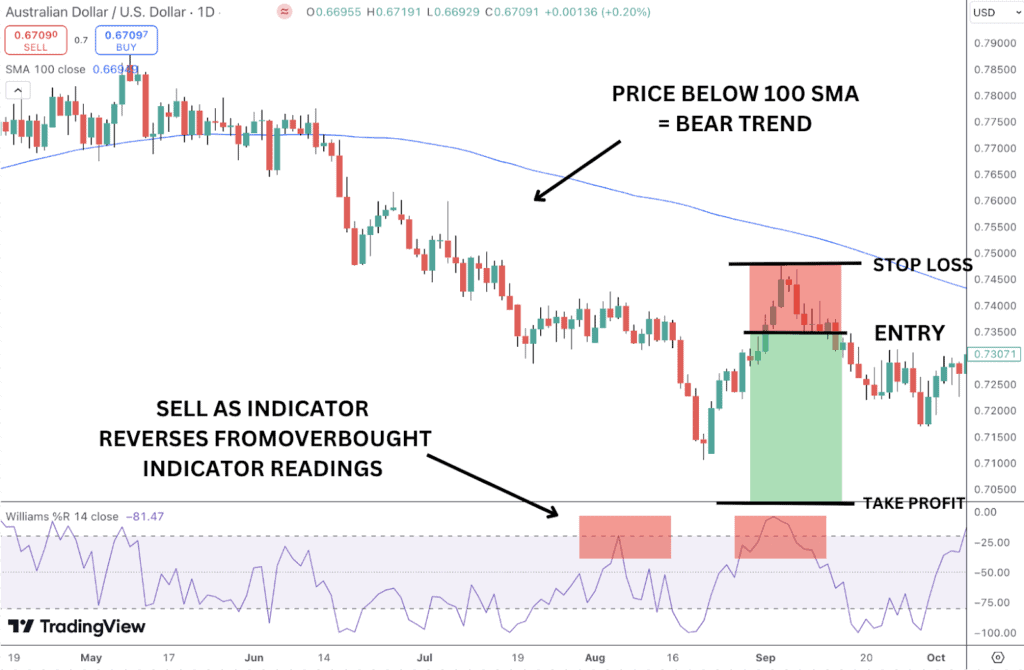
- In a downtrend: confirmed by price being below the moving average, traders can focus on sell signals when the Williams R exits overbought territory.
In the image below we can see an example of how to combine with Williams R and the 100-period simple moving average (SMA) in an uptrend in gold. Price is above the 100 SMA so we look to the indicator to identify oversold readings to give us signals for bullish entries.
In the image below, we can see a bearish example. Notice how AUDUSD is below the 100 SMA, indicating a bear trend. We then look to find overbought readings on the Williams R to give us sell signals.
Williams %R with MACD
The MACD indicator is a highly effective tool for helping identify trend changes and momentum shifts. When used together with the Williams R, traders can quickly identify powerful trading signals to help capitalise on trend reversals and trend expansions alike. Let’s look at some setups using the two indicators.
For a buy setup, look for the Williams R to dip below -80 (indicating an oversold market). This suggests a potential buying opportunity for a forthcoming reversal.
- Confirm with MACD: Check if the MACD is signaling bullish momentum or a reversal. Two key signals to look for:
- MACD Line Crossing Above the Signal Line: This indicates a bullish shift in momentum.
- MACD Histogram Turning Positive: When the histogram moves from negative to positive, it suggests increasing bullish momentum.
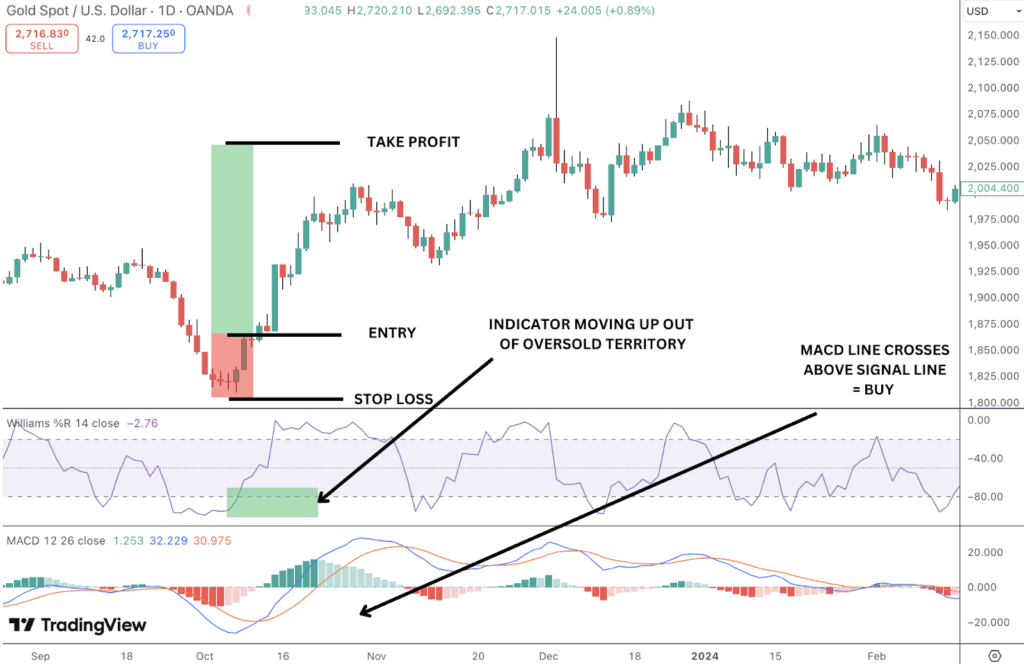
- Execute Buy: Once both conditions are met—Williams %R moving up from the oversold level and MACD showing a bullish crossover or momentum shift—you can consider entering a long position.
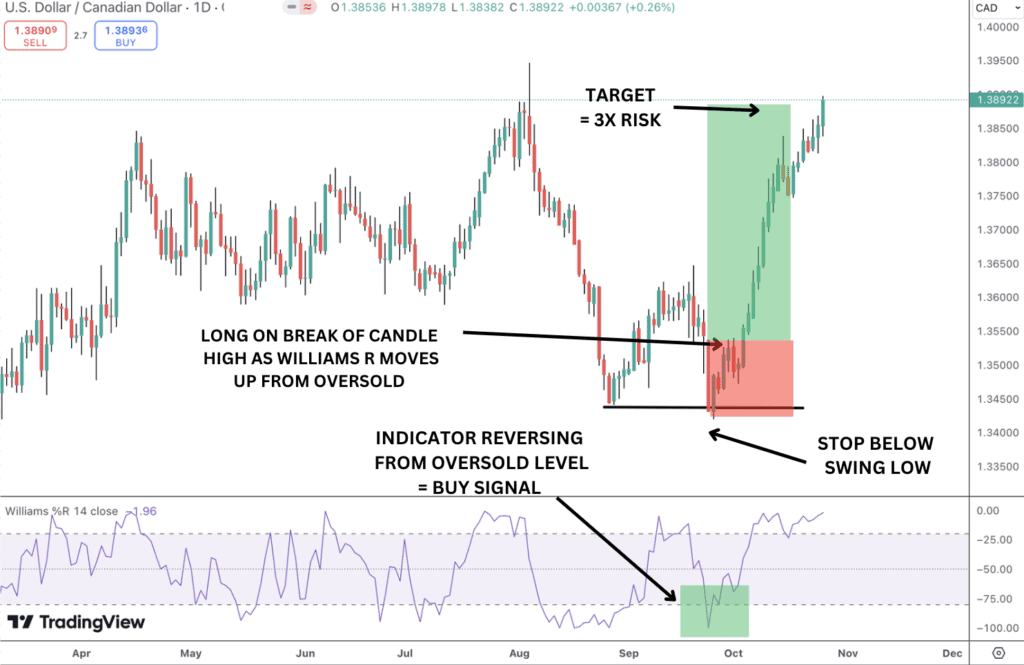
In the image below we can see an example of a bull setup in Gold. The Williams R indicator moves into oversold territory alerting us to a bullish reversal. As price turns higher and the Williams R line moves higher we look to the MACD to see the MACD line cross above the signal line, confirming our buy signal. We enter long on the break of that candle high, with a stop below the swing low and take profit set at 3x risk.
Let’s now consider a sell setup using both the Williams R and MACD indicators.
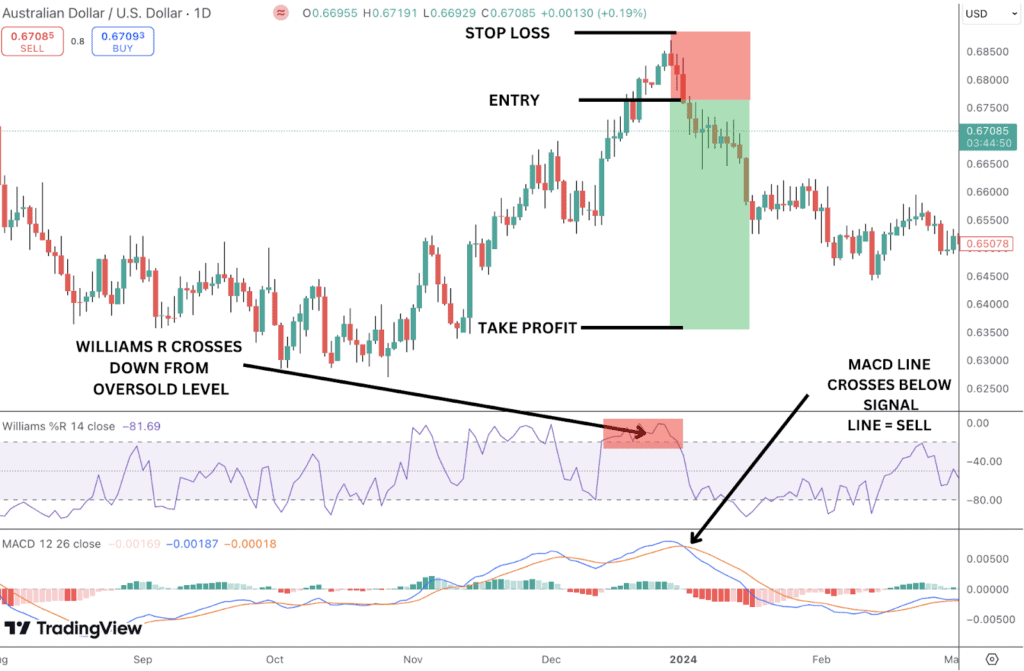
- Identify Overbought Conditions: Wait for the Williams R to rise above -20, signalling the asset is overbought, and a potential reversal could occur.
- Confirm with MACD: Check if MACD signals bearish momentum or a reversal:
- MACD Line Crossing Below the Signal Line: This indicates a bearish shift in momentum.
- MACD Histogram Turning Negative: When the histogram moves from positive to negative, it suggests increasing bearish momentum.
- Execute Sell
Enter a short position as price break below the candle which formed when the Williams R exits overbought territory and MACD confirms the bearish trend with a crossover or histogram weakening. Stop is placed above the high with take profit set at 3x risk.
Williams %R with Bollinger Bands
Bollinger Bands® can be another very powerful indicator to combine with the Williams R. Given the Williams R effectiveness in measuring trend strength and the Bollinger Bands assessment of asset volatility, the two indicators together can yield great results. Let’s look at a buy signal as an example.
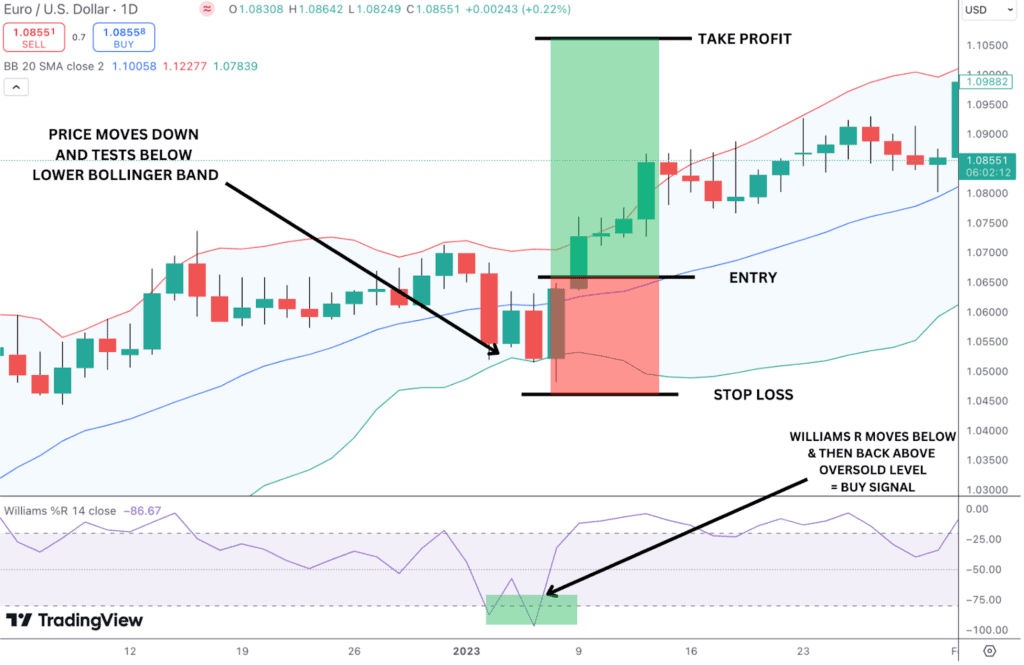
Firstly, traders should watch for price to touch or break below the lower Bollinger Band. This indicates that downside volatility is overstretched and price is therefore vulnerable to a reversal higher.
Next, check the Williams R indicator. If it’s below -80, this confirms the market is in oversold territory, indicating that the selling pressure is overextended and a reversal is likely . After this, wait for price to bounce back above the lower Bollinger Band, signalling that buyers are stepping in and selling pressure is easing.
Finally, when price begins to move back up and the Williams R rises from oversold levels (below -80), it’s a good time to consider entering a long trade. Ideally, the price should cross back above the lower Bollinger Band, with the Williams R rising above -80, signaling a shift in momentum towards the upside.
In the image below we can see an example of a bullish setup in EURUSD. Price tests below the lower Bollinger Band, signalling volatility is overstretched to the downside and price is vulnerable to a move higher. We then look to the Williams R indicator which crosses back above oversold territory giving us our buy signal.
Williams %R with Fibonacci Retracements
Using the Williams R in combination with Fibonacci retracement levels can provide a powerful way to trade potential reversals or trend continuations. Fibonacci levels identify key price areas where reversals or bounces often occur, while the Williams R helps confirm overbought and oversold conditions within those areas. Combining overbought/oversold levels on the Williams R indicator with key Fibonacci levels can be a great way to find effective trade signals. Let’s look at an example.
- First, apply the Fibonacci retracement tool to your chart, measuring from a recent high to a low (or vice versa, depending on the direction of the trend). Common Fibonacci retracement levels include 23.6%, 38.2%, 50%, 61.8%, and 78.6%.
- These levels act as potential support or resistance zones where price may reverse or consolidate.
- As price approaches one of the key Fibonacci levels, observe whether it begins to show signs of slowing down or reversing.
- Remember, Fibonacci levels by themselves are not trade signals, so you need confirmation to ensure the price will respect these levels and not break through them.
- Once you see price testing a Fibonacci level and the Williams R confirming overbought or oversold conditions, you can consider entering a trade.
Short Trade:
If price is at a Fibonacci resistance level (e.g. 61.8%) and the Williams R indicates overbought conditions (above -20), you could enter a short position as the indicator line moves down from overbought levels.
Long Trade:
If the price is at a Fibonacci support level (e.g. 38.2%) and the Williams R indicates oversold conditions (below -80), you could enter a long position as the indicator line crosses back above the oversold threshold.
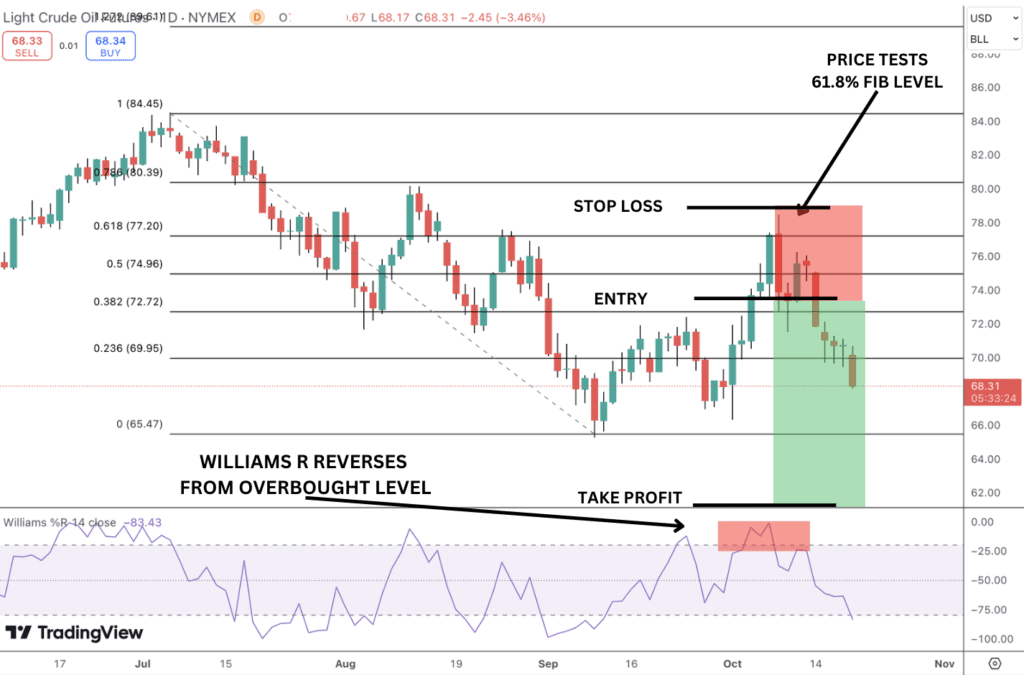
In the image below, we can see an example of a short trade. Price tests the 61.8% fib level and we look to see the Williams R line in overbought territory. As the indicator crosses back below overbought we can sell the break of the price candle which formed to capture the reversal lower, using a stop above the high and a take profit of at least 3x risk.
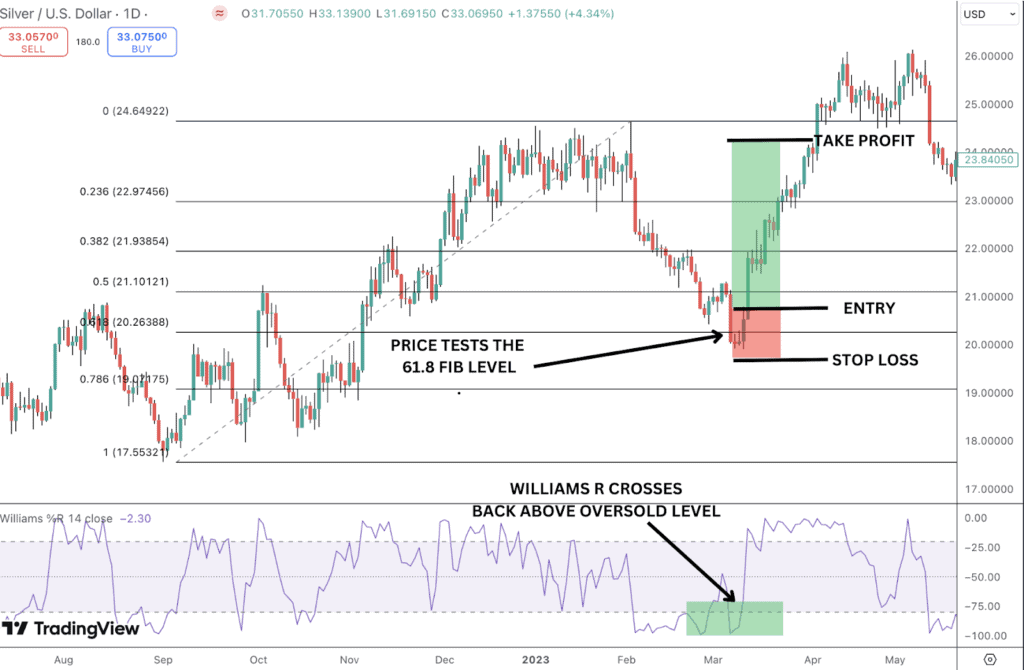
In the image below we can see a bullish trade. Price tests the 61.8% fib support and the Williams R moves back above overbought territory, giving us a buy signal from which price moves higher. We can enter long on the break of the candle high formed as Williams R crosses back above oversold. Our stop is placed below the swing low point with a target at 3x our trade risk where we can exit or begin running a trailing stop.
Tips for Refining Your Trading Strategy Using Williams %R
- One tip is to adjust the look-back period and other parameters of the Williams Percent Range oscillator based on individual market conditions and trading strategies. Shorter look back periods will be more useful for short-term trading strategies and tend to give more signals while a longer look-back period will be less sensitive and give less signals, better suited to position trading.
- Another tip is to use multi timeframe analysis to strengthen the Williams R signals you take. For example, if price is pushing higher and Williams R remains in overbought on the daily timeframe, we can look for the indicator to give buy signals on the 1hr charts (Williams R reversing higher from oversold.
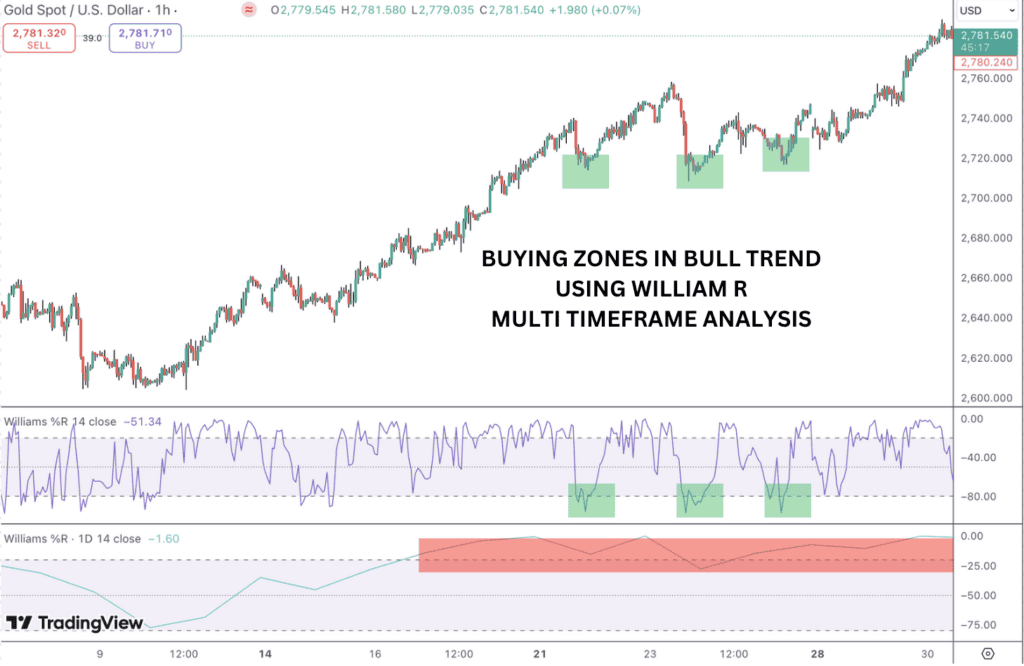
In the H1 chart above, we have the bottom Williams R indicator set to the Daily timeframe, showing us the daily readings while the Williams R on top showing the h1 readings. Notice as price is trending higher, the Daily indicator remains in overbought, signalling a bull trend. We can then look for the H1 indicator to test the oversold threshold and reverse higher, giving us buying zones, highlighted in green.
Advantages of The Williams %R
- Simple Identification of Overbought and Oversold Conditions: The Williams R makes it incredibly easy to spot overbought and oversold conditions in the market. When the indicator is above -20, it signals an overbought market. When the indicator crosses back below this can be a good sell opportunity signalling that price is reversing lower. When it’s below -80, it signals an oversold market. When the indicator then crosses back above the threshold, it can be a good buying opportunity, signalling that price is reversing higher.
- Quick Reaction to Price Movements: The Williams R is a fast-moving oscillator, making it highly sensitive to short-term price changes. This responsiveness allows traders to react more quickly to emerging trends or reversals, which is particularly useful in fast-moving markets or when trading shorter time frames.
- Effective in Range-Bound Markets: In range-bound or sideways markets, the Williams R oscillator excels at identifying reversal points. When price oscillates between support and resistance levels, the Williams R helps traders time their entries by signaling overbought or oversold levels within the range, helping capture range-rotation moves.
Disadvantages of The Williams %R
- Frequent False Signals in Strongly Trending Markets: While the Williams R can help traders find great entries to trend, one drawback is that it tends to produce false signals during strong trending markets. In such cases, the indicator might show overbought or oversold conditions for extended periods, leading traders to enter trades too early or too late. This is because the Williams R is more suited to range-bound markets than trending ones.
- Lagging Indicator: Despite being reactive to price changes, the Williams R can still suffer from lag, especially when confirming reversals. Price may already start to move significantly before the indicator generates a signal, causing traders to miss the initial part of the move, particularly during aggressive reversals.
- Lack of Clear Trend Direction: The Williams R doesn’t provide insight into the overall trend direction. While it shows when a market is overbought or oversold, it doesn’t indicate whether the market is in a larger uptrend or downtrend. Traders need to combine it with other trend-following indicators (like moving averages or MACD) to avoid trading against the prevailing trend.
What Indicators That Work Best With Williams %R?
As a momentum indicator, the Williams R can be employed effectively with a wide range of technical indicators. Other momentum oscillators such as the RSI or the stochastic oscillator are popular choices to combine with the Williams R. While these indicators are similar, you will find they don’t have the exact same lines due to differences in the underlying calculations.
As such, using a second indicator can help add extra conviction to your Williams R trade signals, where confluent indicator signals line up. Similarly, using an extra indicator can help filter out weaker trading signals by avoiding taking trades where there is no confluence between Williams R and the second indicator in use.
Williams %R vs Fast Stochastic Oscillator
The Williams R and the fast stochastic are very similar but are essentially the inverse to each other. Both are bounded oscillators and both have a default look back period of 14. However, there are some differences you’ll notice.
The Williams R is presented has a value scale of -100 to 0. The fast stochastic is presented on a scale of 0 to 100. Also, the fast stochastic add an additional signal line which is the 3 period simple moving average of the fast stochastic line. Given the similarities, the two indicators aren’t usually used on the same chart.
Williams %R vs Stochastic Oscillator
The Williams %R indicator resembles the Stochastic Oscillator, but there is a fundamental difference in how each indicator is calculated and displayed.
While Williams %R appears as a single line ranging from -100 to 0, the Stochastic Oscillator is presented with two lines, %K and %D measuring between 0 and 100 .
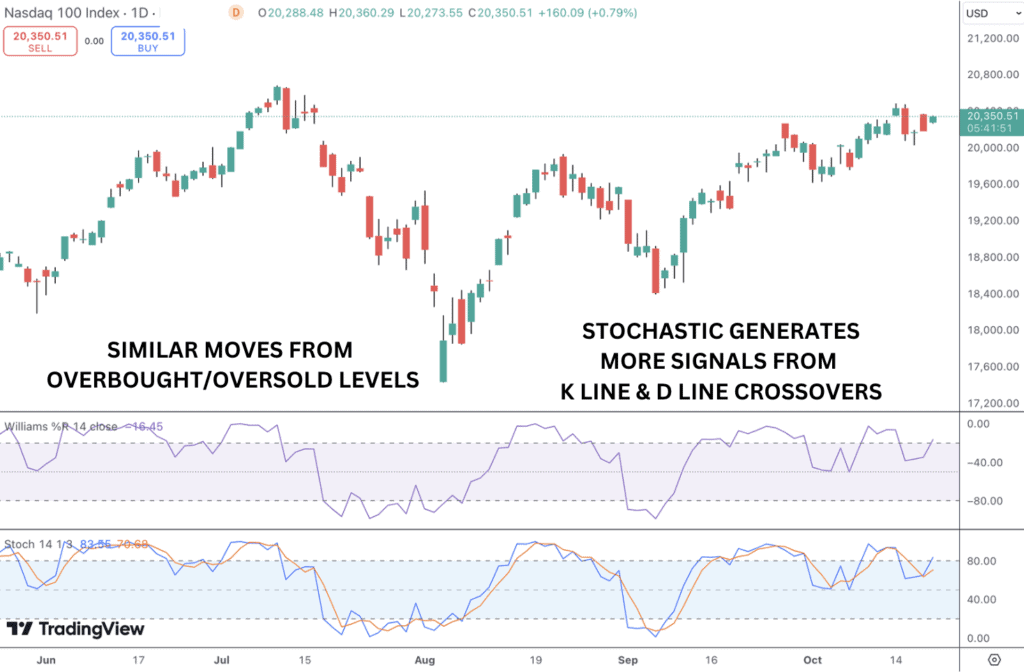
Williams %R measures the closing price’s position relative to the highest high and lowest low over a specified lookback period. In contrast, the Stochastic Oscillator compares the closing price to the range of prices within the same period, giving values between 0 and 100. You’ll notice that the blue line on the stochastic indicator below is nearly the same as the Williams R line whereas the second line differs as it is a moving average of the stochastic.
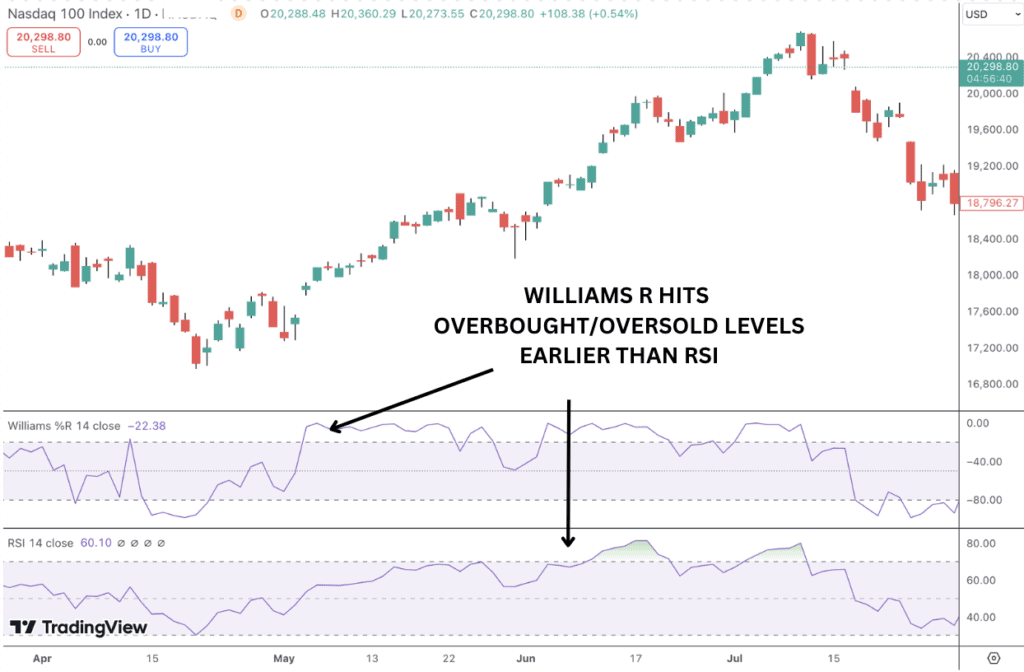
Williams %R vs RSI
Overall, both indicators help traders identify market momentum and potential turning points, but they approach it from different angles. %R and RSI have some similarities, but notable differences between them. Both oscillators are bounded and single line indicators.
The Williams R looks at the current closing price compared to the highest high and lowest low over a certain period, giving values from -100 to 0.
The RSI compares average gains and losses over a set timeframe (usually 14 days) and ranges from 0 to 100, with values above 70 signaling overbought conditions and below 30 showing oversold. Their calculations differ in that Williams %R is more sensitive than the Relative Strength Index (RSI) and can provide earlier warnings of potential trend reversals.
FAQ
What is the best settings for trading Williams Percent Range?
The default setting of 14 periods is widely used by traders across financial markets and provides a good balance for identifying overbought and oversold conditions. It captures significant price movements without being overly sensitive to minor fluctuations. A shorter lookback period will be more aggressive while a longer lookback period will be less responsive, giving less signals.
How reliable is Williams %R?
The Williams R indicator is useful for identifying overbought and oversold conditions in range-bound markets, but it can produce false signals in strong trends. As a lagging indicator, it may lead to missed opportunities, so it’s best used alongside other technical indicators and with consideration of broader market conditions.
Is Williams %R a Leading or Lagging Indicator?
The Williams R indicator is generally considered a lagging indicator. While it reacts to price changes and can signal overbought and oversold conditions, it often confirms trends after they have already started. As a result, it may not predict future price movements but rather reflects past price action.
What is the origin of Williams %R?
The Williams R indicator was developed by Larry Williams, a well-known trader, author, and market analyst, in the late 1970s. Williams introduced this momentum oscillator in his book, “How I Made One Million Dollars Trading Commodities,” where he outlined various trading strategies and techniques he used to achieve significant success in the markets.
Does the Williams %R perform poorly in markets with low volatility?
No, the Williams R indicator can be effective in low volatility markets. It helps identify overbought and oversold conditions even with smaller price movements, allowing traders to spot potential reversals. Additionally, it works well in range-bound environments, helping traders pinpoint entry and exit points as prices approach support and resistance levels.
Can the Williams %R generate false signals in choppy or sideways markets?
Yes, the Williams R indicator can give false signals in choppy markets. In conditions where price movements are erratic and lack a clear trend, the indicator may frequently oscillate between overbought and oversold levels. This can lead to numerous signals without the desired price reversals, causing traders to enter or exit positions prematurely. As such, it is important to gain experience with the indicator in order to use it effectively in your trading.


