- November 25, 2024
- 28 min read
Stochastic RSI (Stoch RSI)
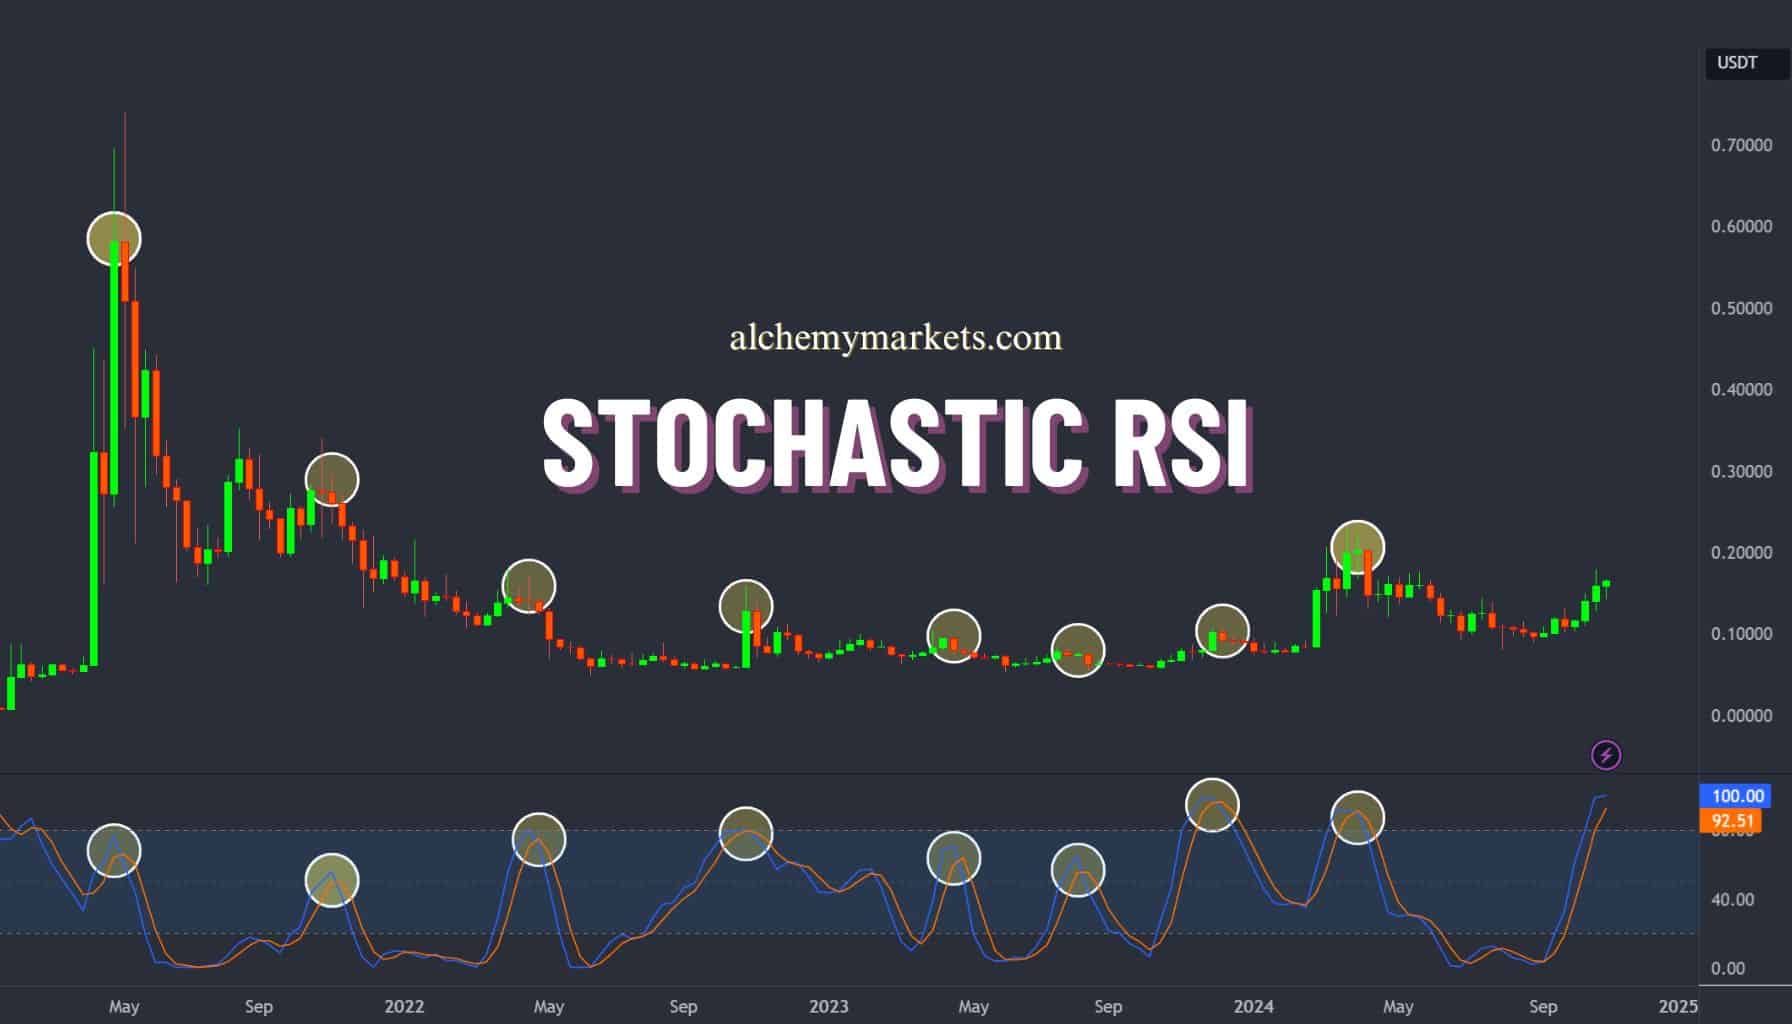
Stochastic RSI is a powerful tool in technical analysis that combines the concepts of the Relative Strength Index (RSI) and the Stochastic Oscillator to create a more responsive indicator for identifying potential price reversals.
As technical analysis evolves with advancements in technology, traders are increasingly exploring innovative methods for predicting market movements. One such method involves combining different types of indicators, where one is derived from price data and another from the first indicator’s calculation. This approach opens up limitless possibilities for creating complex and effective trading strategies, with Stochastic RSI being a prime example of this innovative technique.
What Is the Stochastic RSI?
The Stochastic RSI (Stoch RSI) is a technical indicator that ranges between 0 and 100 designed to help traders identify momentum and trend shifts in financial markets. It achieves this by combining two widely-used indicators: the Stochastic Oscillator and the Relative Strength Index (RSI).
Stochastic RSI Indicator
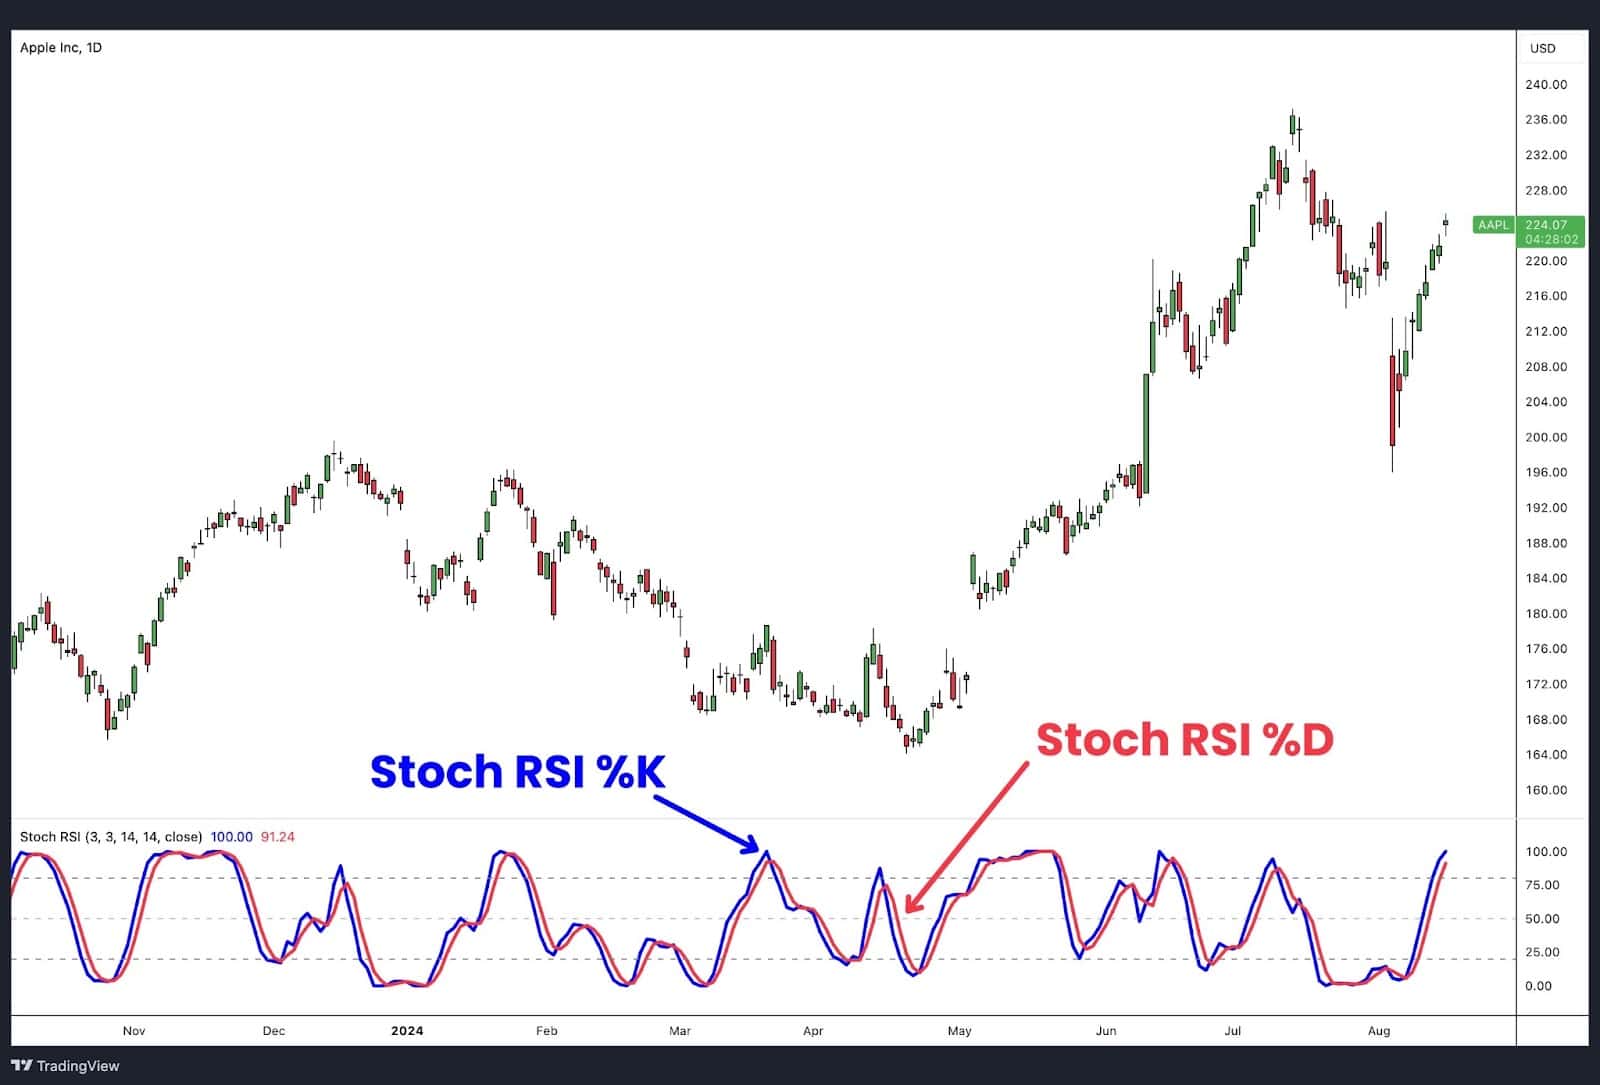
In the Stoch RSI, the RSI is first calculated from price data, serving as a measure of the market’s strength or weakness. This RSI value is then processed through a stochastic calculation, producing a final Stoch RSI value that ranges between zero and one, or zero and 100, depending on the scale of the charting platform used. The resulting metric is plotted on a scale that highlights overbought or oversold conditions, providing traders with signals that can indicate potential market reversals.
The Stochastic RSI was introduced in 1994 by Tushar S. Chande and Stanley Kroll in their book, The New Technical Trader. Their goal was to create an indicator that was both more sensitive and robust, capable of generating a greater number of trade signals compared to the standalone use of the Stochastic Oscillator or RSI.
How Does the Stochastic RSI Indicator Work?
To grasp how the Stochastic RSI (Stoch RSI) indicator functions, it’s essential to first understand the two foundational indicators it combines: the Relative Strength Index (RSI) and the Stochastic Oscillator.
The RSI Within Stoch RSI
Starting with the RSI, or Relative Strength Index, this indicator measures the momentum of price movements by comparing the magnitude of recent gains to recent losses over a specified period, known as the “look-back period.” The RSI provides a value between 0 and 100, which helps traders assess whether a market is overbought, oversold, or neutral.

The attached table above illustrates the different zones of the RSI scale. When the RSI value hovers around 50, the market is considered neutral, meaning there is no significant strength in either direction. As the RSI value climbs above 50, it signals increasing upward momentum, suggesting that the up days are stronger or more frequent than the down days. Conversely, when the RSI value drops below 50, it indicates growing downward momentum, reflecting stronger or more frequent down days.
For example, consider a 14-day look-back period on a daily price chart. If, over those 14 days, the price increases by $10 on 7 days and decreases by $10 on the other 7 days, alternating between gains and losses, the RSI calculation would result in a value of 50. This value signifies a neutral market, where the strength of upward and downward price movements is balanced.
The RSI serves as the first step in calculating the Stoch RSI. Once the RSI value is determined, it is then fed into the Stochastic calculation, which measures the position of the RSI relative to its high-low range over a specified period. This creates a more responsive indicator that can quickly reflect changes in momentum, making the Stoch RSI particularly useful for identifying potential trend reversals and overbought or oversold conditions.
RSI Neutral Indicator
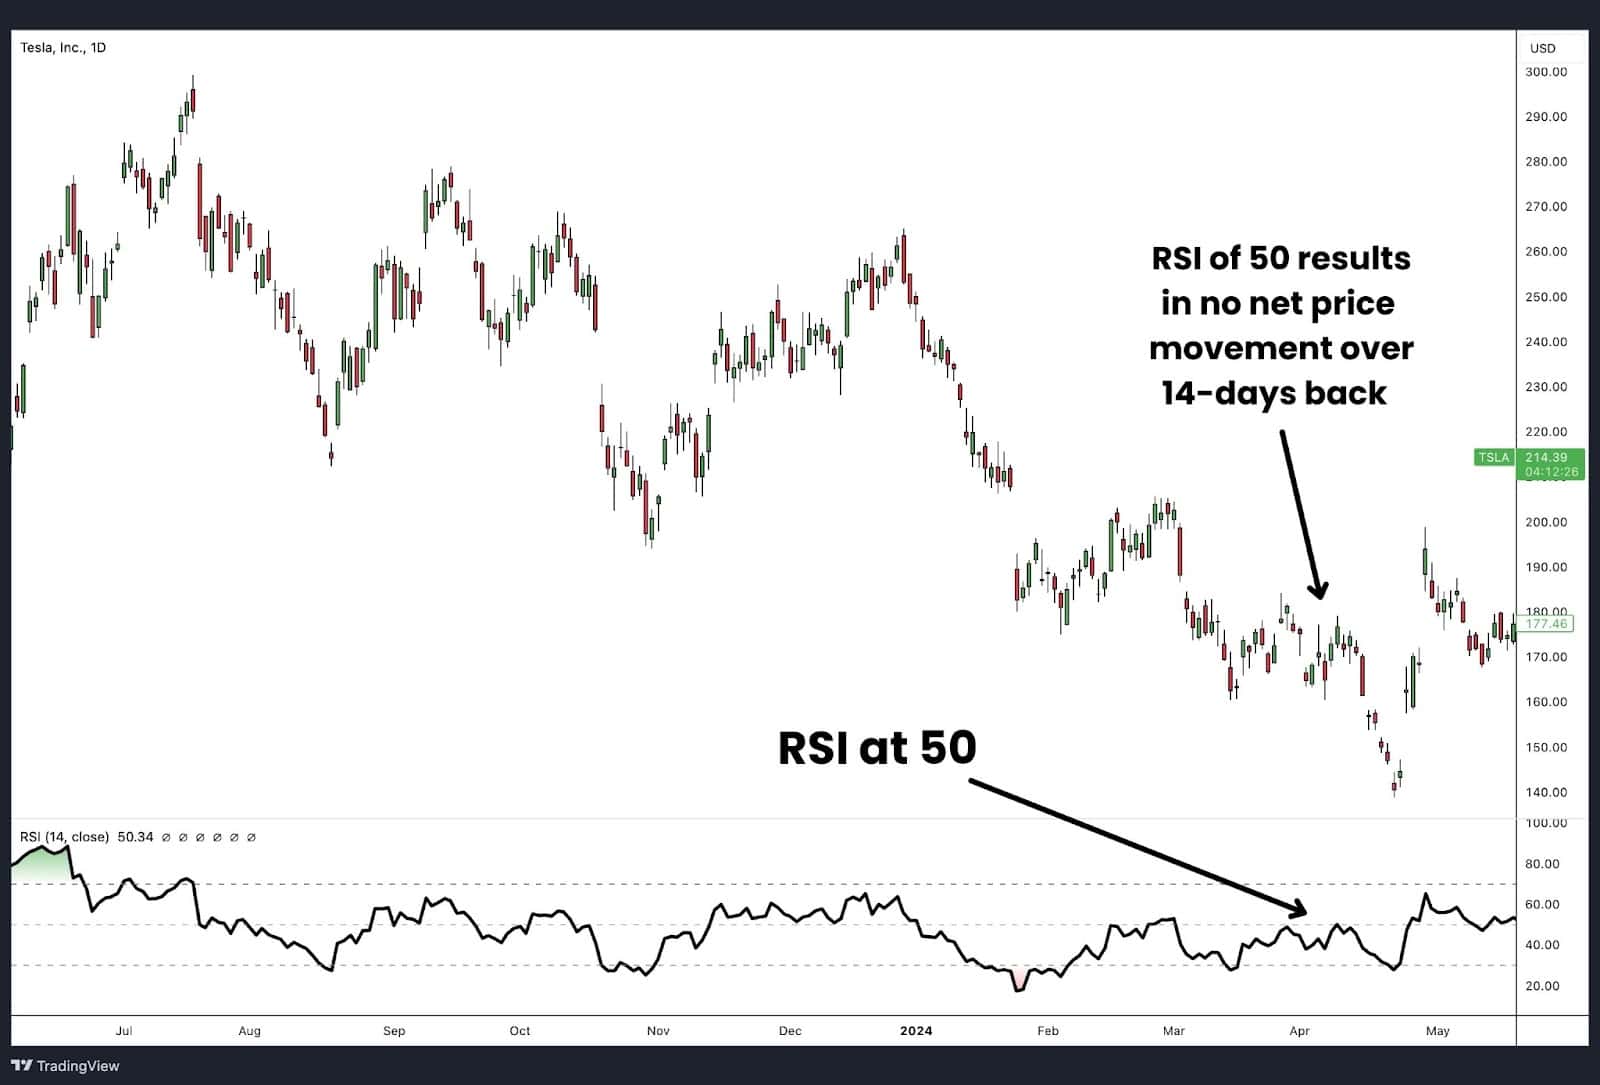
An RSI reading of 50 signifies that the upward and downward price movements over the look-back period are balanced. This neutrality suggests that the market lacks a clear directional strength—neither bullish nor bearish. Essentially, the price remains relatively unchanged from where it was at the beginning of the look-back period, indicating no net gain or loss in momentum.
The chart above illustrates this concept. The RSI is at 50, reflecting that the price movements over the past 14 days have been evenly matched. Upward and downward price movements have cancelled each other out, resulting in a price that is nearly the same as it was 14 days ago. This is a classic example of a neutral RSI, where the market shows no dominant trend.
RSI Overbought Indicator
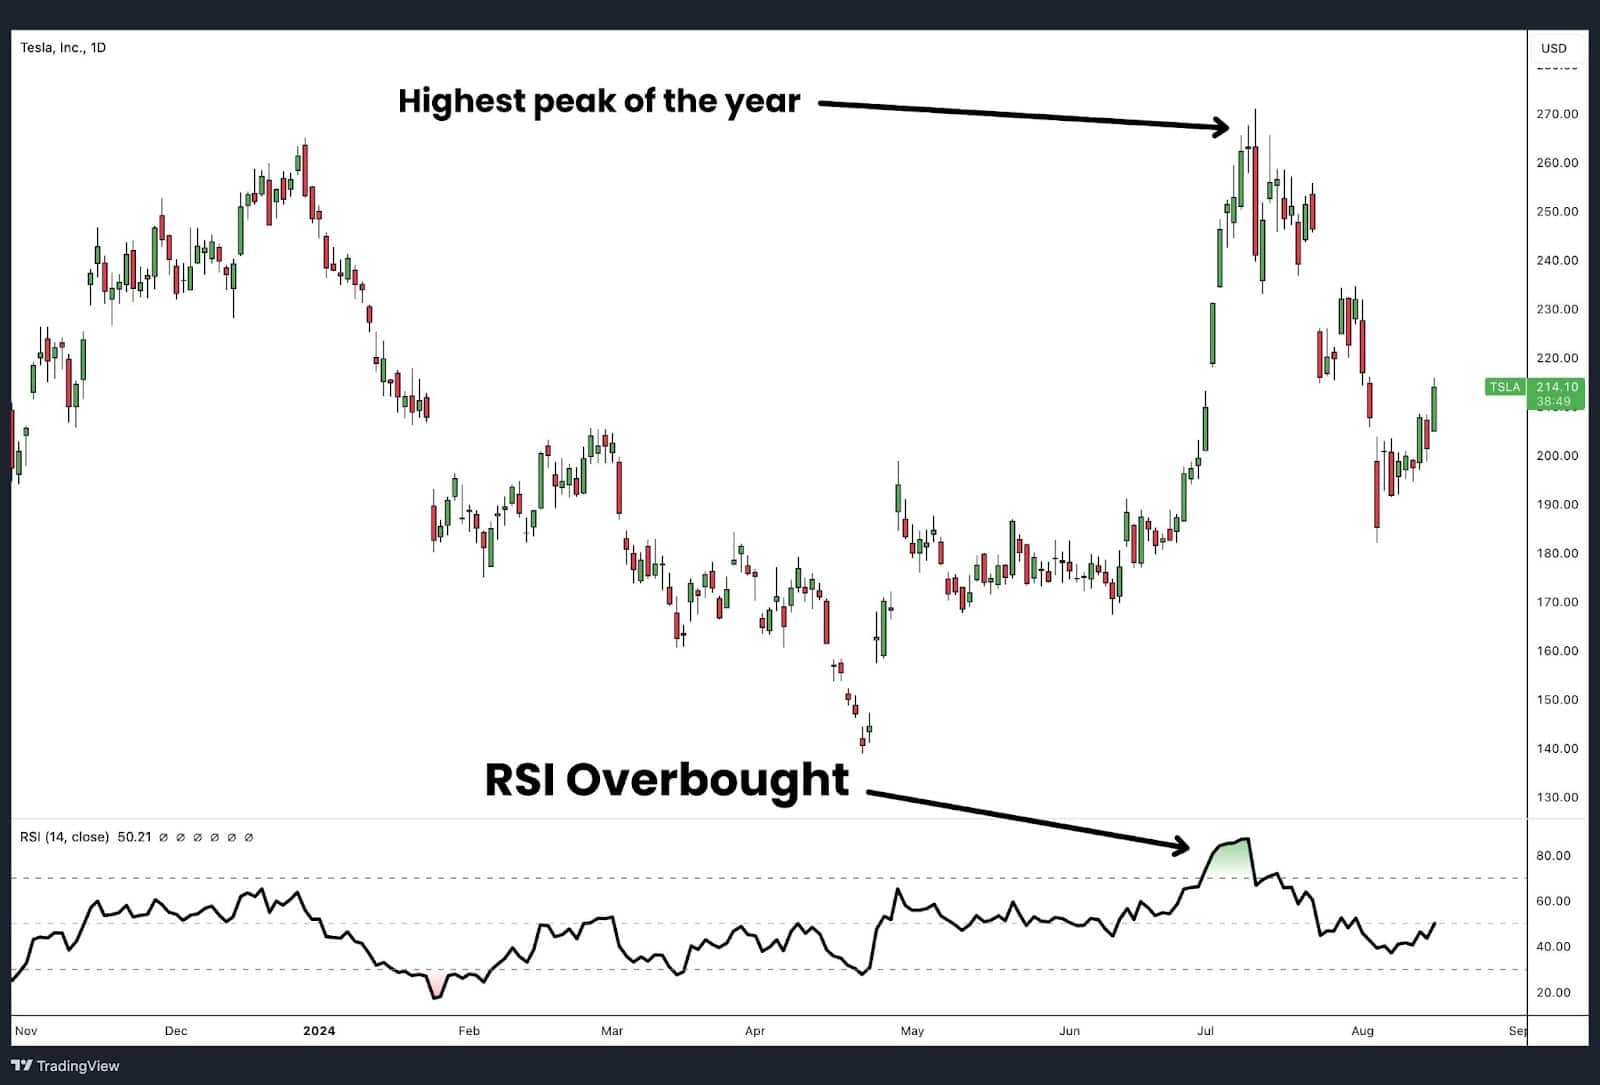
When the RSI rises above 70, it typically indicates that the asset is in an overbought condition, meaning that it has experienced strong upward momentum and may be due for a pullback or consolidation. This can occur when buying pressure has pushed prices up rapidly, often to unsustainable levels.
In the chart above, Tesla (TSLA) reached its highest peak of the year, coinciding with the RSI entering overbought territory. As the RSI climbed above 70, it signalled that the stock was potentially overextended to the upside. This overbought condition often alerts traders to the possibility of an impending reversal or a period of price correction, as the asset may struggle to maintain such elevated levels of buying pressure.
In this case, after reaching the peak, Tesla’s price began to decline, illustrating how the overbought RSI can precede a downturn. While an RSI above 70 doesn’t guarantee an immediate reversal, it serves as a warning that the asset might be overvalued in the short term and that caution is warranted.
RSI Oversold Indicator
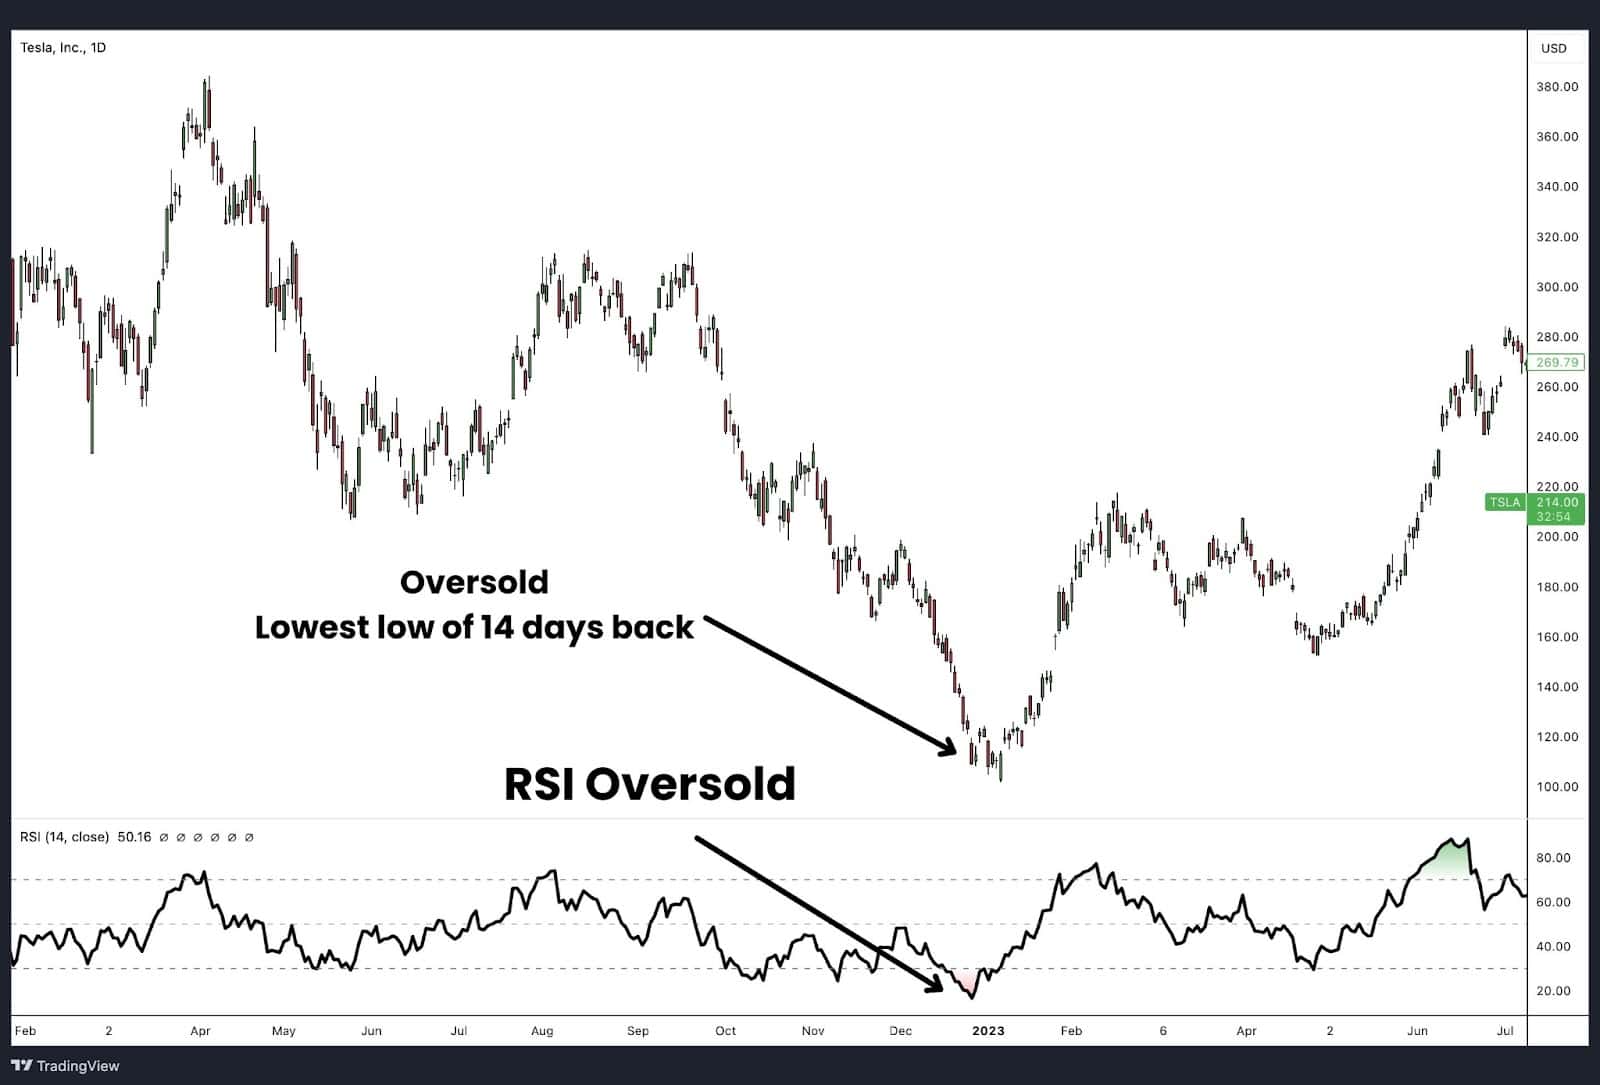
When the RSI falls below 30, it signals that an asset, such as Tesla (TSLA) in the chart above, is in an oversold condition. Though not guaranteed, the recent selling pressure may have driven the price too low and a reversal or bounce could be around the corner. This is determined over a standard 14-day look-back period, where the RSI compares the magnitude of recent losses to gains.
In Tesla’s case, the RSI dipped into oversold territory, coinciding with the lowest low within the 14 days, indicating significant downward momentum. After reaching this oversold level, the stock began to recover, illustrating how the RSI can signal potential buying opportunities.
This principle mirrors the behaviour seen in overbought conditions, where an RSI above 70 suggests excessive upward momentum, often preceding a price pullback.
The Stochastic in Stoch RSI
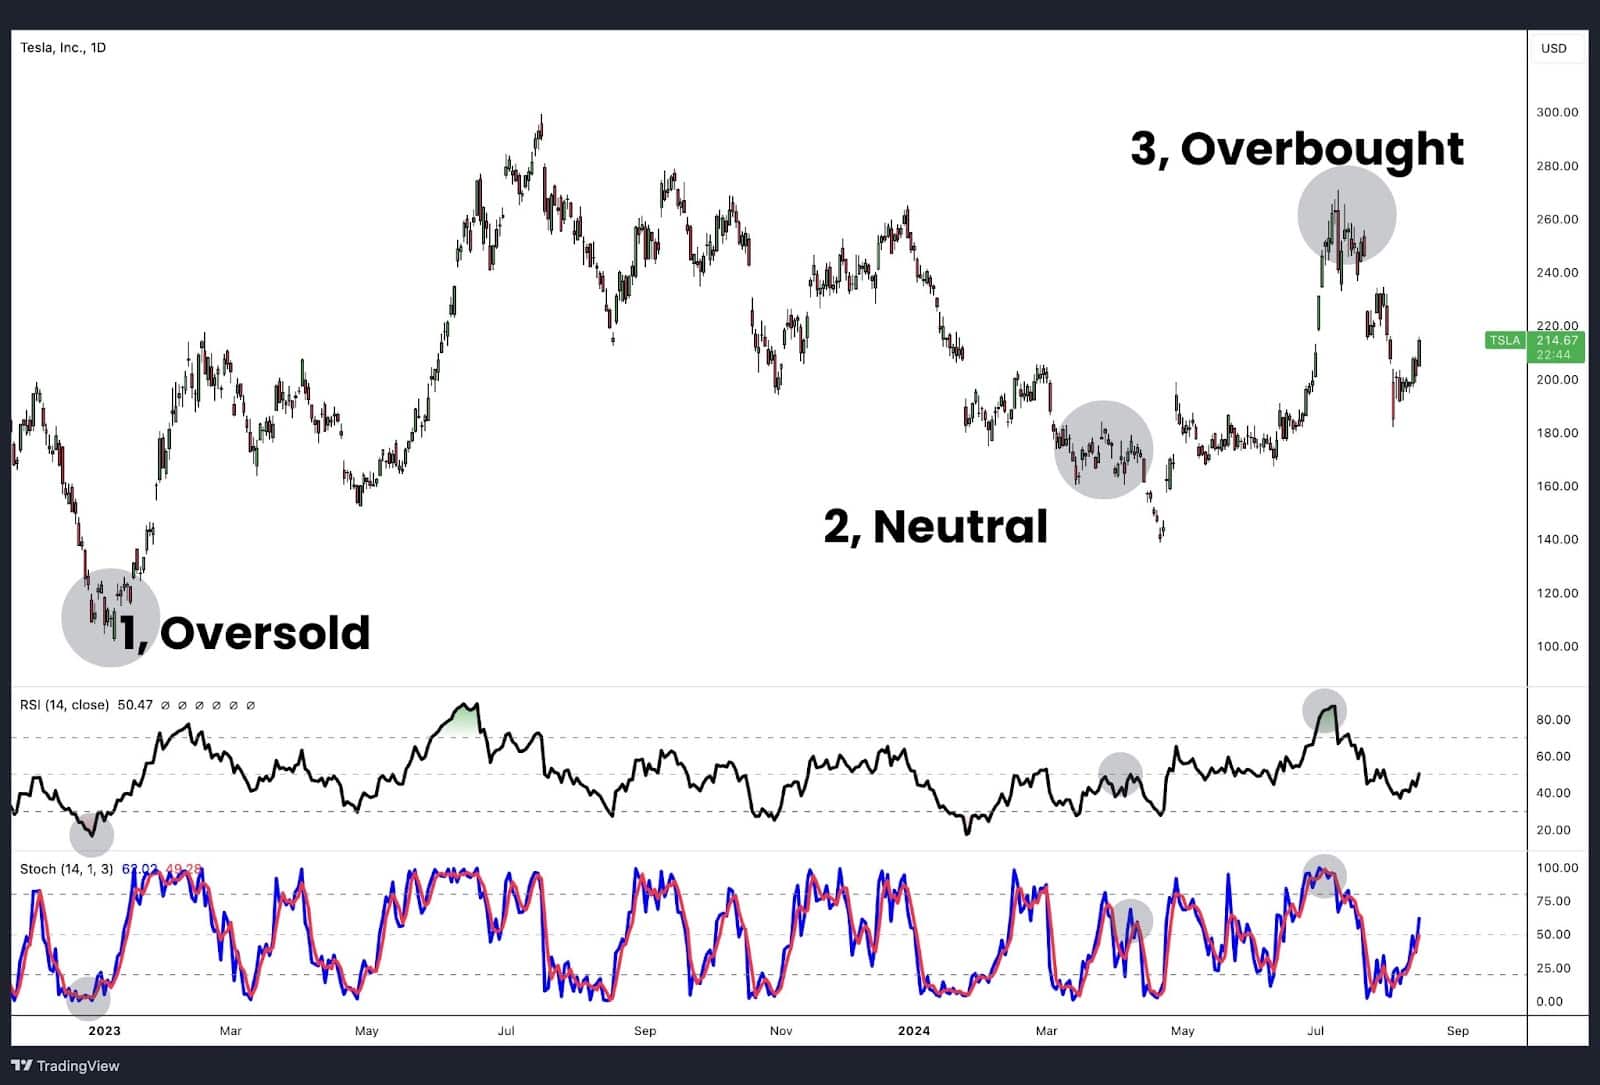
The Stochastic Oscillator, displayed as the bottom indicator in the chart above, measures the position of the closing price relative to the highest high and lowest low within a set look-back period, usually 14 days. This helps traders identify overbought and oversold conditions in the market.
For instance, if Tesla’s price during this 14-day period fluctuated between $150 and $250, and the closing price at the end of the period was $200, the Stochastic %K reading would show where this closing price stands within that range. A closing price around the middle of the range, like $200, would give a %K reading of 50. Simultaneously, the %D line (a smoothed moving average of %K) would also show near 50, indicating neutral momentum, similar to what is labelled as #2 in the chart.
In the chart, the Stochastic Oscillator highlights three key points:
- Oversold Condition (#1): The first point, labelled “1,” shows Tesla’s price reaching an oversold extreme, where the Stochastic Oscillator’s %K and %D lines are near zero, indicating that the current price is close to the lowest low of the 14-day period. This corresponds with the RSI also being in oversold territory, suggesting a potential buying opportunity as the price might reverse upward.
- Neutral Condition (#2): The second point, labelled “2,” represents a neutral state, where the Stochastic Oscillator’s %K and %D lines are around the 50 mark, indicating that the current price is in the middle of the 14-day range. This neutral reading suggests that there is no strong momentum in either direction, which is also reflected in the RSI, showing a balanced market condition at this point.
- Overbought Condition (#3): The third point, labelled “3,” illustrates Tesla’s price reaching an overbought level, with the Stochastic Oscillator’s %K and %D lines near the upper extremes around 100. This overbought signal, along with the RSI also indicating overbought conditions, warns of a potential price decline as the asset may be overvalued in the short term.
The Stochastic RSI indicator integrates these calculations with those of the RSI to offer a more nuanced tool for detecting potential market reversals. By assessing both momentum through the RSI and the price’s position relative to its range through the Stochastic Oscillator, traders can make more informed decisions based on a deeper understanding of market dynamics.
Stochastic RSI Indicator (Bottom Indicator)
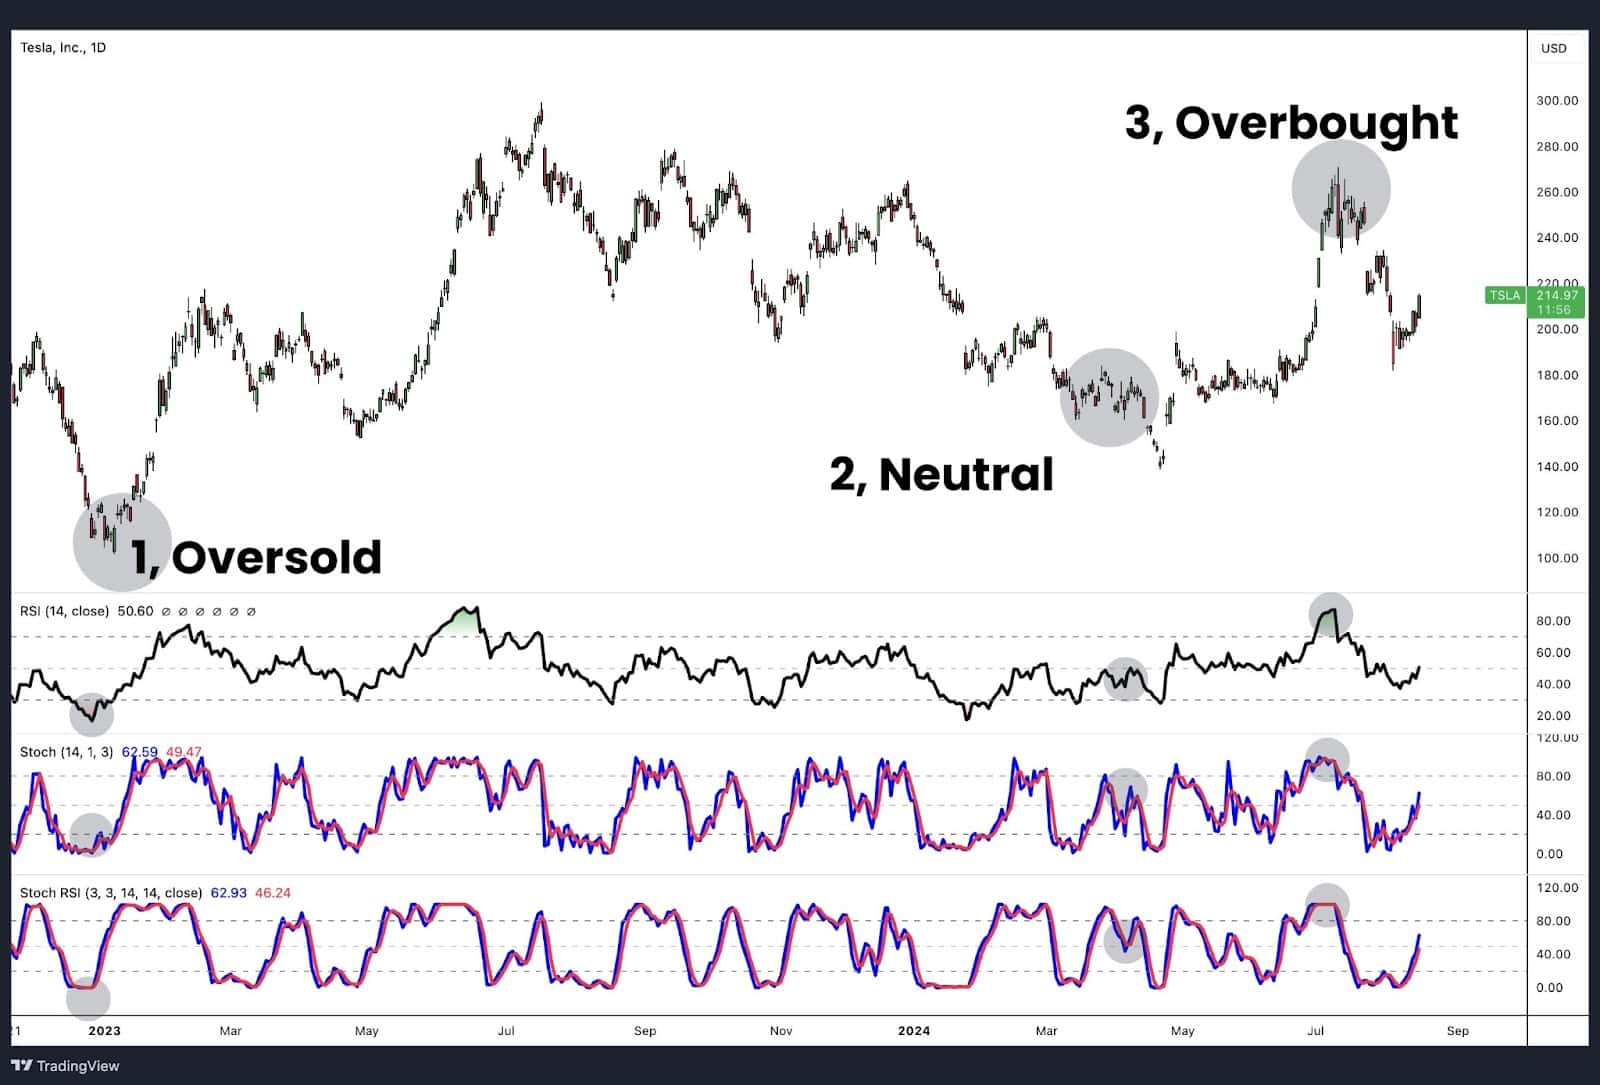
Now, let’s add the Stochastic RSI indicator to the mix. It is displayed as the bottom indicator in the chart above. Remember, Stoch RSI merges the Stochastic Oscillator with the Relative Strength Index (RSI) to create a highly responsive momentum oscillator. This tool helps traders identify overbought and oversold conditions in the market more quickly and accurately than the standard RSI or Stochastic Oscillator alone.
In the chart, the Stochastic RSI is represented by two lines: the %K line (blue) and the %D line (red). The %K line reflects the raw Stochastic RSI value, showing where the RSI is relative to its high-low range over the look-back period. The %D line is a moving average of the %K line, smoothing out short-term fluctuations to provide clearer signals.
- Oversold Condition (#1): At the first point labelled “1,” Tesla’s price hits an oversold level, with the Stochastic RSI %K and %D lines dropping near zero. This indicates that the RSI is close to its lowest point within the look-back period, suggesting that the stock is in a strong downtrend. There is no forecasting element in the low Stoch RSI reading until the value begins to move higher above 20. A cross above 20 suggests a bullish reversal could be imminent. This is corroborated by the traditional RSI, which also shows oversold conditions.
- Neutral Condition (#2): The second point, labelled “2,” demonstrates a neutral market condition. Here, the Stochastic RSI lines hover around the midpoint of the scale (50), indicating that the RSI is neither at an extreme high nor low, reflecting a balanced market without significant upward or downward momentum. The traditional RSI similarly shows a neutral reading, confirming the market’s lack of strong directional bias.
- Overbought Condition (#3): At the third point labelled “3,” the Stochastic RSI lines approach 100, signalling that Tesla is in a strong uptrend. This indicates that the RSI is near its highest point in the look-back period. When the Stoch RSI crosses down below 80, then Tesla can be considered overbought and the potential for the correction to extend lower grows. The traditional RSI also shows an overbought reading, reinforcing this signal.
The Stochastic RSI indicator is highly sensitive to price movements, making it particularly useful for traders seeking to capitalise on short-term opportunities. However, due to its responsiveness, it may produce more false signals, so it’s often best used in conjunction with other indicators or analysis methods for confirmation.
What Does the Stochastic RSI Look Like?
Stochastic RSI Indicator

At first glance, the Stochastic RSI indicator closely resembles a typical price oscillator. It is displayed on a separate pane, either above or below the price action, and updates in real-time with price movements. The Stoch RSI includes two lines with a scale ranging from 1 to 100.
Crossovers with the readings at 80 and 20 are considered significant. A cross down below 80 from above suggests the bullish momentum is slowing and that a bearish correction is taking hold. On the other hand, a cross up from below 20 to above 20 suggests a new bull trend is emerging.
Key Features:
- Scale: The Stochastic RSI operates on a scale ranging from 0 to 1 (or 1 to 100 in some charting applications).
- Levels:
- 20: Indicates oversold conditions.
- 80: Indicates overbought conditions.
- Components:
- %K Line: Tracks the raw Stoch RSI values.
- %D Line: A moving average of the %K line, which smooths out the data.
Behaviour on the Chart:
- Default Settings:
- The default look-back period is 14 days on a daily chart.
- Market Conditions:
- Sideways Markets: The Stoch RSI typically mirrors the direction of price movements
- Trending Markets: It tends to remain in the overbought or oversold zones during sustained uptrends or downtrends, reflecting the prolonged strength or weakness in the market.
Importance of Stochastic RSI indicator
Like all price oscillators, the Stochastic RSI is most effective when used alongside other technical indicators. Depending on your trading strategy, price oscillators can serve as a tool for setting up trades, identifying entry triggers, or establishing exit conditions.
The Stochastic RSI offers remarkable flexibility because it combines the strengths of two underlying indicators: the RSI, which excels in trending markets, and the Stochastic Oscillator, which is more effective at signalling reversals in sideways markets. By integrating these two indicators, the Stochastic RSI becomes a versatile tool that can be effectively applied in both trending and ranging market conditions.
How to Calculate Stochastic RSI
In the previous section, we provided non-formal, elementary explanations to offer an intuitive understanding of how the Stochastic RSI indicator functions. Now, we’ll delve into the formal calculations for each of the underlying indicators, as well as the Stochastic RSI itself.
Let’s start with the Relative Strength Index (RSI). The formula for the RSI, using the standard length of 14 periods, is as follows:

A breakdown of the formula shows that the most critical part is the follow section:

This formula calculates the gains (upward price movements) relative to the losses (downward price movements). The other components of the formula simply process the result so it can be effectively plotted on an oscillator chart.
Reflecting on our earlier intuitive explanation, if a stock had equal upward and downward price movements over the 14-period look-back (let’s assume $10 for simplicity), the resulting RSI calculation would be:

The result is an RSI = 50. The middle of the scale for the RSI indicator and a reading that indicates no strength in either direction.
An increase in the upward price movement to $30 would result in the following calculation:

The result is an RSI = 75. A reading above the standard overbought conditions threshold of 70 that indicates upward strength.
Calculate Stochastic RSI
The Stochastic oscillator formula with the standard length of 14 is as Follows:

%D = 3-period simple moving average of %K
Next, we consider the %K calculation for the Stochastic Oscillator formula, which determines the position of the current price relative to the range of closing prices over the look-back period (14 periods in this example). For instance, if over the past 14 days (assuming a daily chart), a stock’s price ranged from as low as $10 to as high as $20, and is currently trading at $15, plugging these numbers into the %K formula would yield:

%K calculates to 50. The middle of the scale for the Stochastic Oscillator and a reading that indicates no strength in either direction.
If the current price is trading at $19 and the range remains the same, the %K calculation adjusts to the following:

The %K calculates to 50, indicating that the current price is exactly in the middle of its range over the look-back period. If the %K were to calculate closer to 90, this would push the reading well into the overbought level for the Stochastic Oscillator, signalling that the market is identifying overbought conditions.
The %D calculation, a three-period moving average of the %K, typically hovers slightly above or below the %K, depending on the prevailing direction of the %K.
The final step in calculating the Stochastic RSI involves substituting the closing price inputs used in the Stochastic Oscillator calculation with the RSI values generated from the previous step. Essentially, the Stochastic RSI is a Stochastic Oscillator calculation that uses the RSI, rather than the actual price, as its input.
Stochastic RSI Formula
The formula for a Stochastic RSI with a length of 14 is as follows:

%D = 3-Period Moving Average of Stochastic RSI
As you can see, rather than incorporating the asset’s value into the stochastics formula, the Stoch RSI uses the Relative Strength Index output values.
Stochastic RSI Example
Stochastic RSI Indicator

The formula described earlier calculates the Stochastic RSI, which is represented by the blue line in the indicator pane at the bottom of the chart. The %D line, shown in orange, is a 3-period moving average of the Stochastic RSI. This %D line is calculated by summing the previous three Stochastic RSI values and dividing the result by three. The Stochastic RSI line (blue) moves above or below the %D line (orange) depending on the directional momentum of the price action.
The key areas to follow on the Stoch RSI is when its value crosses above the 20 mark or below the 80 mark.
Stochastic RSI on the S&P 500

The chart above shows the stochastic RSI applied to the S&P 500 index. The two blue vertical lines show price turning points signalled by the indicator. The first blue vertical line on the left is when Stoch RSI crossed down below 80. This signalled a bearish turn in price. The second blue vertical line on the right illustrates when Stoch RSI crossed above 20. This signals a bullish turn in price.
Stochastic RSI on the GBPUSD

Here’s another example but in the forex market. The chart above shows the stochastic RSI applied to the British Pound/US Dollar pair (GBPUSD). The two blue vertical lines show price turning points signalled by the indicator. The first blue line is a bearish cross down below 80 while the second blue line is a bullish cross up above 20.
Stochastic RSI on the BTC/USD
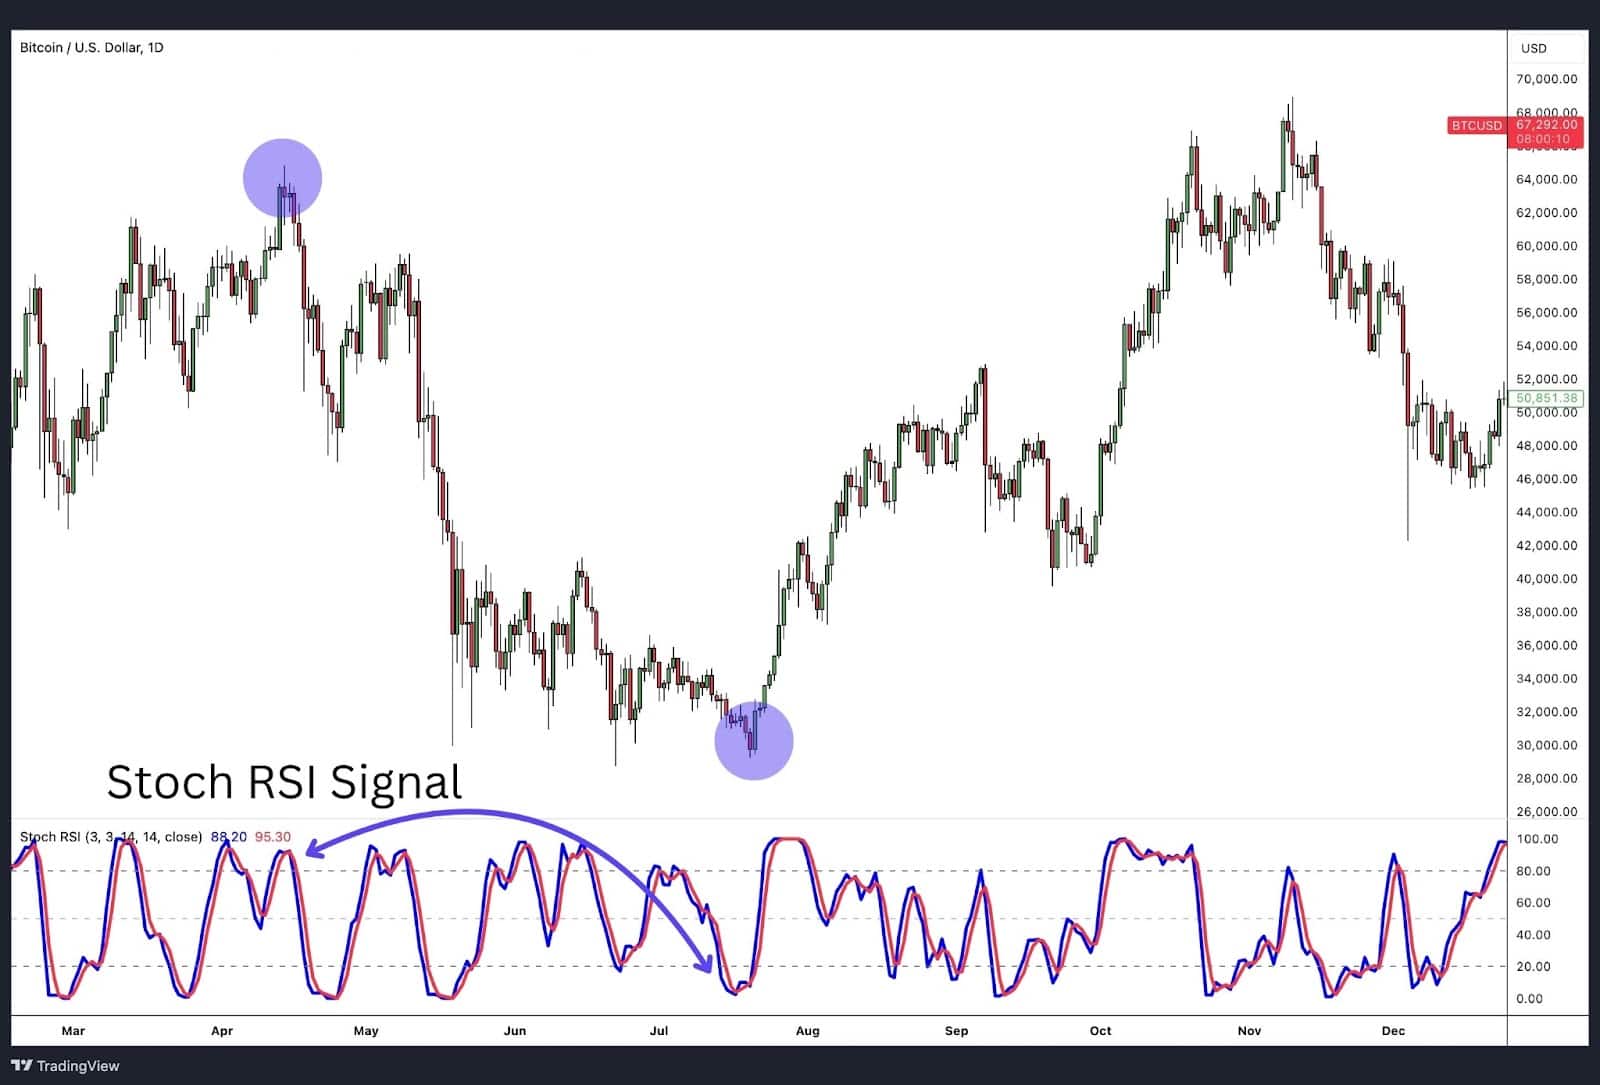
Here’s another example of Stochastic RSI, this time applied to the cryptocurrency market. The chart above demonstrates the Stochastic RSI crypto indicator on the Bitcoin/US Dollar pair (BTCUSD). Just like the previous forex example, key turning points are highlighted where the Stochastic RSI signals potential reversals.
In this instance, the Stochastic RSI crypto signal crosses above 80, indicating an overbought condition. This aligns with a peak in Bitcoin’s price, and a subsequent drop follows. A second blue circle shows an oversold condition when the Stochastic RSI crypto indicator dips below 20, signalling a bullish reversal, which is followed by a significant price increase.
This example demonstrates how traders can use the Stochastic RSI crypto indicator to capture key market reversals, particularly in the volatile cryptocurrency market.
Stochastic RSI Trading Strategies
The Stochastic RSI is a versatile technical indicator, and traders can employ several strategies when using it. Here are four Stochastic RSI trading strategies designed to help you identify trading opportunities in various market conditions.
Trading Stochastic RSI at Overbought/Oversold levels
Like all oscillators, the Stochastic RSI can be used in different ways to inform trading decisions. The most common method for generating trading signals with a bounded oscillator like the Stochastic RSI is to use the overbought or oversold reading levels as setup and trigger thresholds.
For the Stochastic RSI oscillator, the default overbought level is set at 80. When the Stochastic RSI reading crosses above 80, a trade setup is initiated. The trigger for executing the trade occurs when the Stochastic RSI reading crosses back below 80. Both the Stochastic RSI line or the %D line can initiate the trade setup or trigger by crossing these thresholds.
The chart below illustrates a trade trigger where the %D line crosses back below the 80 percent level after being in the overbought zone. It’s advisable to wait for the lines to cross back below the overbought threshold because the reading can linger in the overbought zone, especially if the price continues to move with upward momentum. Triggering a trade as soon as the Stochastic RSI enters the overbought zone could lead to a drawdown if the price remains elevated for an extended period.
Stochastic Overbought Short (Sell) Trade Signals

Long-side trade signals are the exact inverse of the short trade signals described above. A long trade setup occurs when the stochastic RSI readings dip below 20. When they cross back above 20 a trade trigger is generated for a buy trade.
Stochastic Oversold Long (Buy) Trade Signals

Trading Stochastic RSI with Market Trends Identification
Multi-timeframe analysis is a powerful strategy that traders use to get a clearer understanding of both short-term and long-term market trends. The goal is to identify trading opportunities where trends on different timeframes align, which can increase the likelihood of a successful trade. This technique involves analyzing the price movement of an asset across multiple timeframes—such as daily, hourly, and weekly charts—to pinpoint the best entry points. Below is a simple three-step process to implement this strategy.
Trend Following Strategy Combined with Stochastic RSI
Step 1: Identify the Long-Term Trend Using a Daily Chart
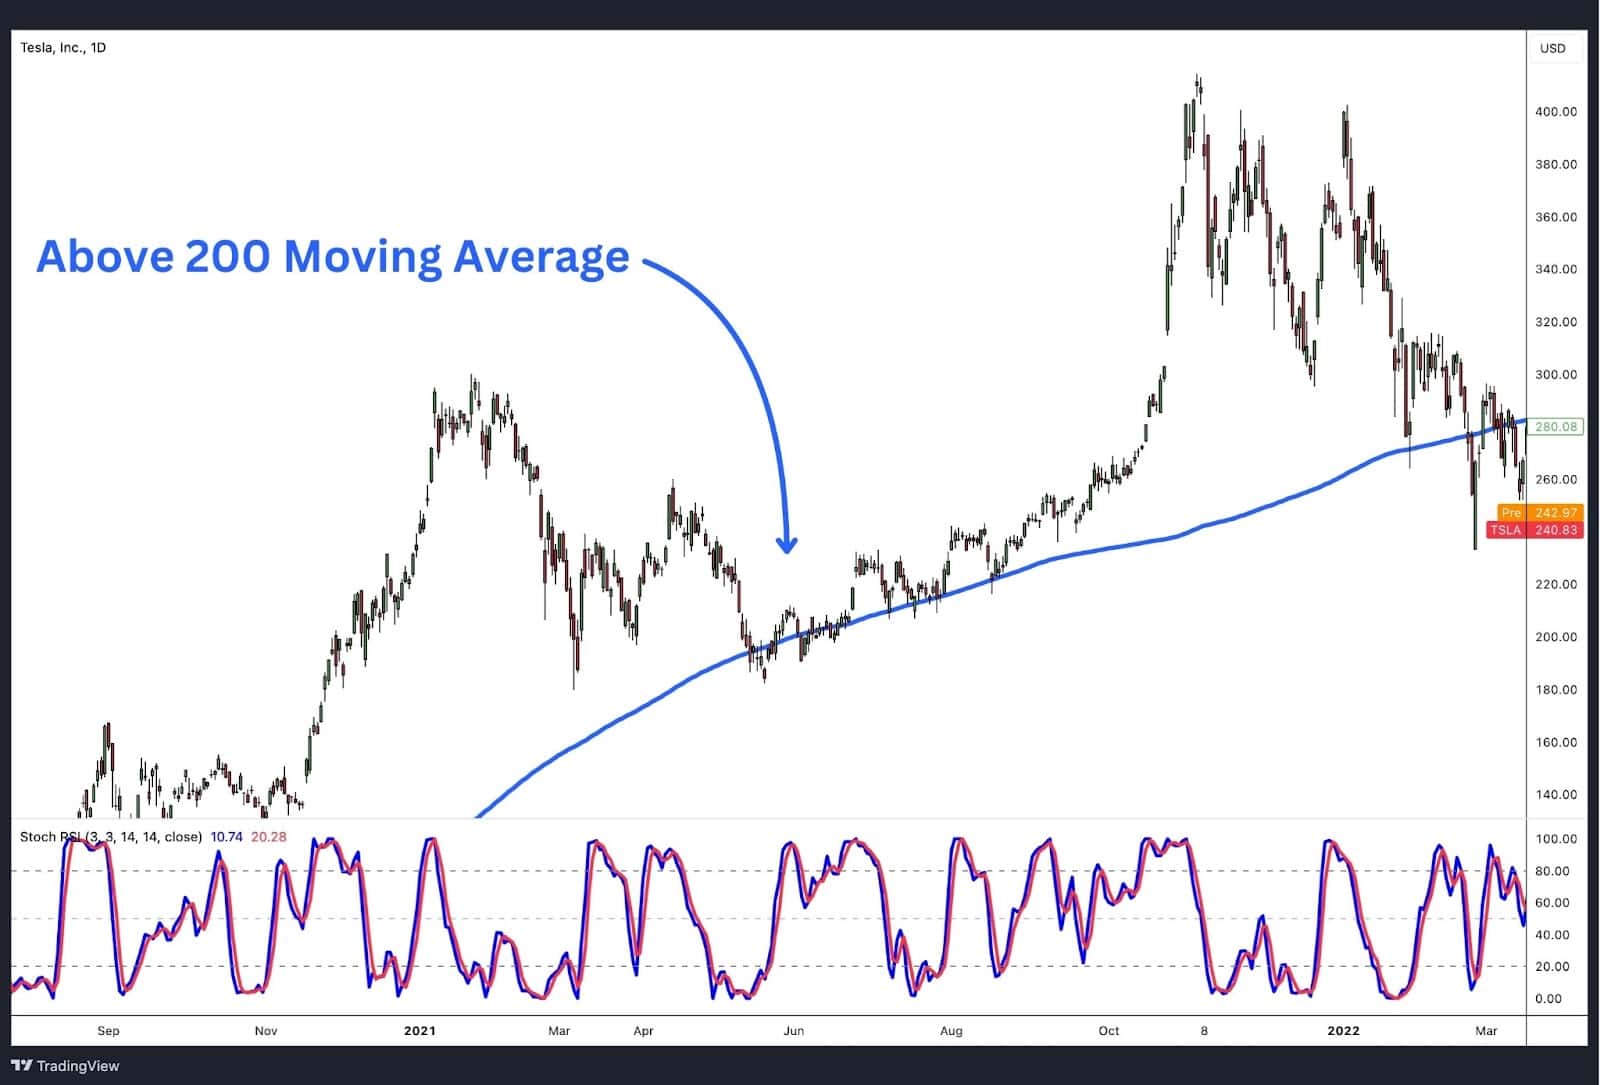
First, assess the longer-term trend using a daily chart and a 200-period simple moving average (SMA). This is your foundation for understanding the overall market direction.
- If the price is above the 200-period SMA, the trend is considered bullish (uptrend).
- If the price is below the 200-period SMA, the trend is bearish (downtrend).
This step helps you define whether to look for buy or sell opportunities in the next phase. For example, if the price of gold is above the SMA, the trend is up, and you should focus only on buy signals.
Step 2: Filter RSI Signals on a Smaller Timeframe
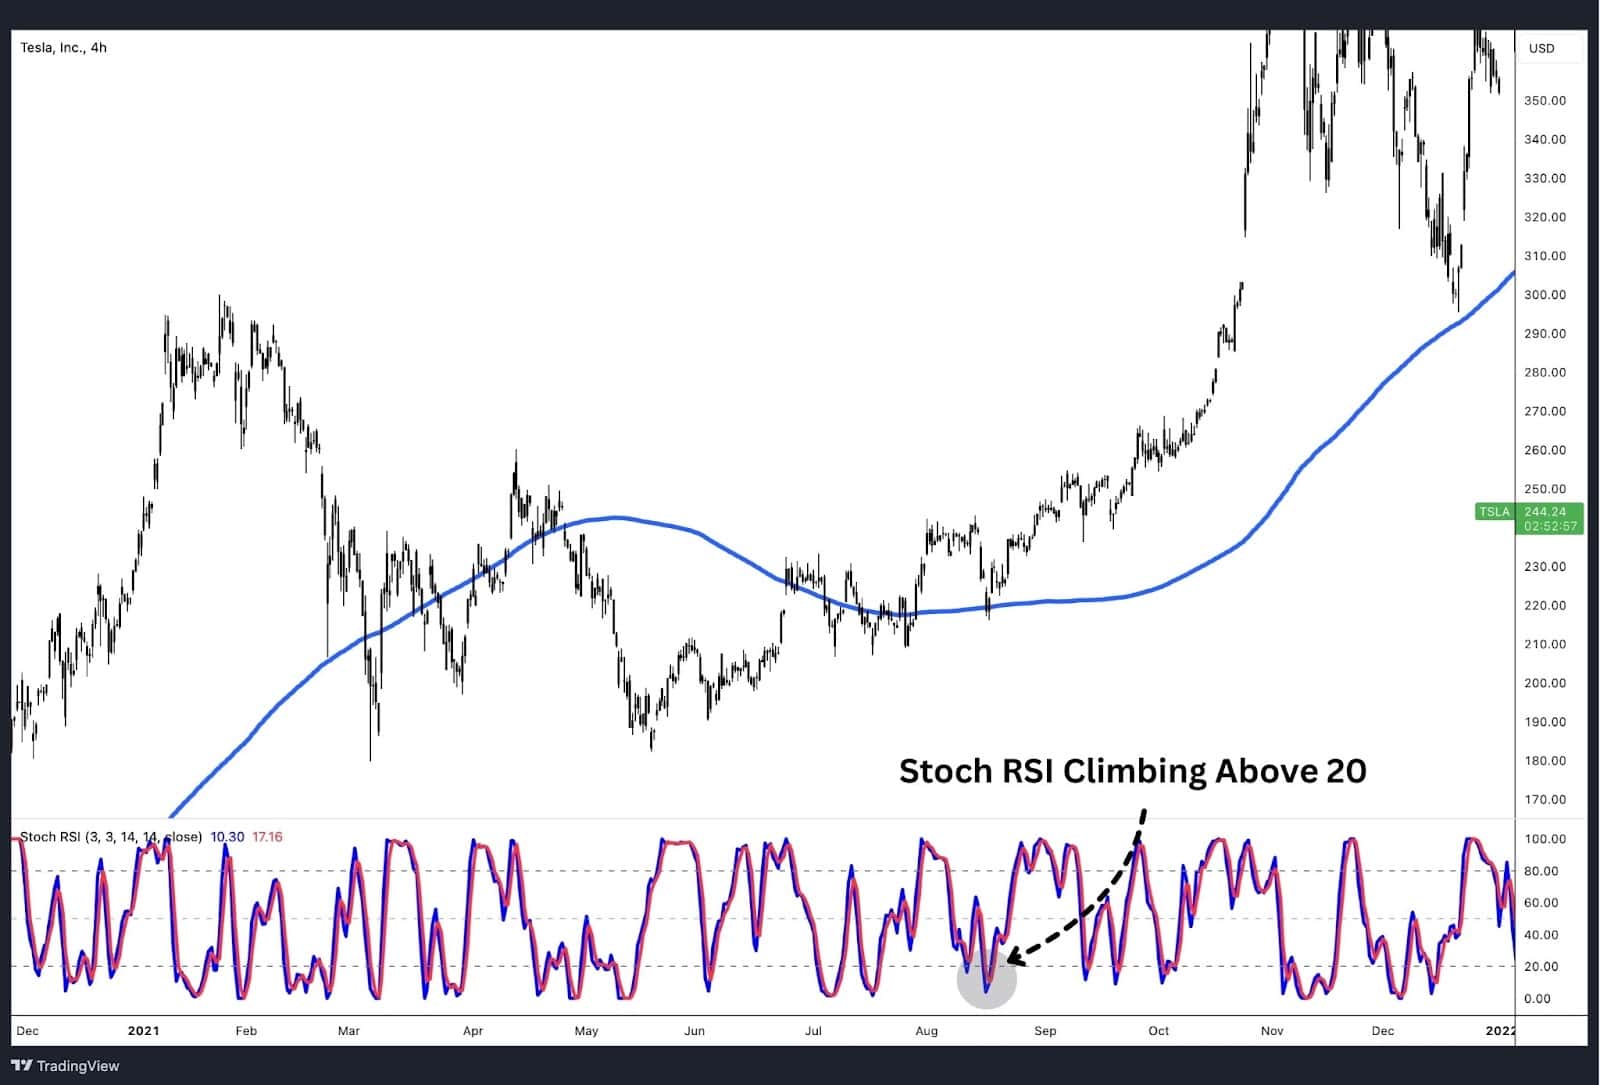
Now that you know the long-term trend, switch to a smaller timeframe, such as a 1 or 4-hour chart, to fine-tune your entry based on the Stoch RSI indicator. Your goal is to find signals that align with the direction of the long-term trend.
- If the long-term trend is up, you should only consider Stoch RSI buy signals. Ignore sell signals.
- To find a buying opportunity, wait for the Stoch RSI to dip below 20, which indicates that the asset is oversold.
- Enter the trade when the Stoch RSI crosses back above the 20 level, signalling a potential price reversal in line with the larger trend.
For example, since we’ve already identified that gold is in an uptrend from Step 1, we’ll ignore any Stoch RSI sell signals and focus only on buy signals when the Stoch RSI is oversold and moves back above 20.
Step 3: Place the Trade and Set Your Stop Loss and Take Profit
Once you’ve found a Stoch RSI buy signal that aligns with the long-term trend, you’re ready to enter the trade. This step involves managing your risk and setting up your exit levels.
- Stop Loss: Place your stop loss just below the most recent swing low. This acts as your safety net, ensuring you exit the trade if the price moves against you.
- Take Profit: Set your take profit level at the next significant resistance level or at a point that’s at least twice the distance of your stop loss. This gives you a risk-to-reward ratio of better than 1:2, meaning your potential profit is at least double the amount you’re risking.
For instance, if your stop loss is set at $5 below your entry price, your take profit level should be set at least $10 above the entry price. This approach allows for a tighter stop loss, maximising your risk-to-reward ratio.
Crosses of the 50 Level as a Buying or Selling Level
When a trend reversal occurs, the Stochastic RSI will quickly move out of the overbought or oversold zone—depending on whether the market is in an uptrend or downtrend—and re-enter the neutral zone between 20 and 80. In such market conditions, a common trading strategy is to initiate a trade when the Stochastic RSI crosses the 50 level.
Stochastic RSI Crossing Below 50 After Uptrend Reversal

For a short (sell) trade, this occurs when the Stochastic RSI moves down from the overbought zone and crosses below 50, as illustrated in the price chart above. Conversely, a long (buy) trade is initiated when the Stochastic RSI rises from the oversold zone and crosses above 50.
Using StochRSI and Divergence for Identifying Reversals
Another technique employed by technical traders to spot price reversals is divergence. This method seeks to identify situations where the price is trending in one direction, while a technical indicator, such as the Stochastic RSI, is moving in the opposite direction—indicating a form of “disagreement” between price action and technical analysis.
Identify Trend Reversal with Price Divergence

This divergence is generally unsustainable and often signals that a market trend is losing momentum, suggesting a potential upcoming reversal. Although divergence conditions are relatively rare, they are typically reliable indicators when they do occur. The price chart above illustrates an example of price divergence using the Stochastic RSI indicator.
Advantages of the Stochastic RSI
• Increased Sensitivity: The primary advantage of the Stochastic RSI is its heightened sensitivity to price action, which results in a greater number of trading signals compared to its two constituent indicators—the RSI and Stochastic Oscillator. This increased movement in the indicator allows traders to capitalise on more opportunities.
• Combination of Strengths: By integrating the RSI and Stochastic Oscillator, the Stochastic RSI harnesses the strengths of both indicators. The RSI excels at identifying momentum in trending markets, while the Stochastic Oscillator is better suited for spotting price reversals in range-bound markets. This combination provides a versatile tool for traders in various market conditions.
Disadvantages of Stochastic RSI
• Lag Due to Calculation Complexity: One of the main drawbacks of the Stochastic RSI is that it involves a calculation of another calculation (the RSI), which is itself derived from price. While this method is common in mathematical applications, in trading, being several steps removed from the actual price can introduce lag, potentially making the signals less effective or consistent.
• Volatility and Whipsaws: The Stochastic RSI can exhibit high volatility, particularly during abnormal market conditions such as those caused by news events or extreme price movements. This sensitivity can lead to false signals, especially in choppy markets. During such extreme conditions, it may be prudent to disregard signals generated by the Stochastic RSI to avoid unreliable trades.
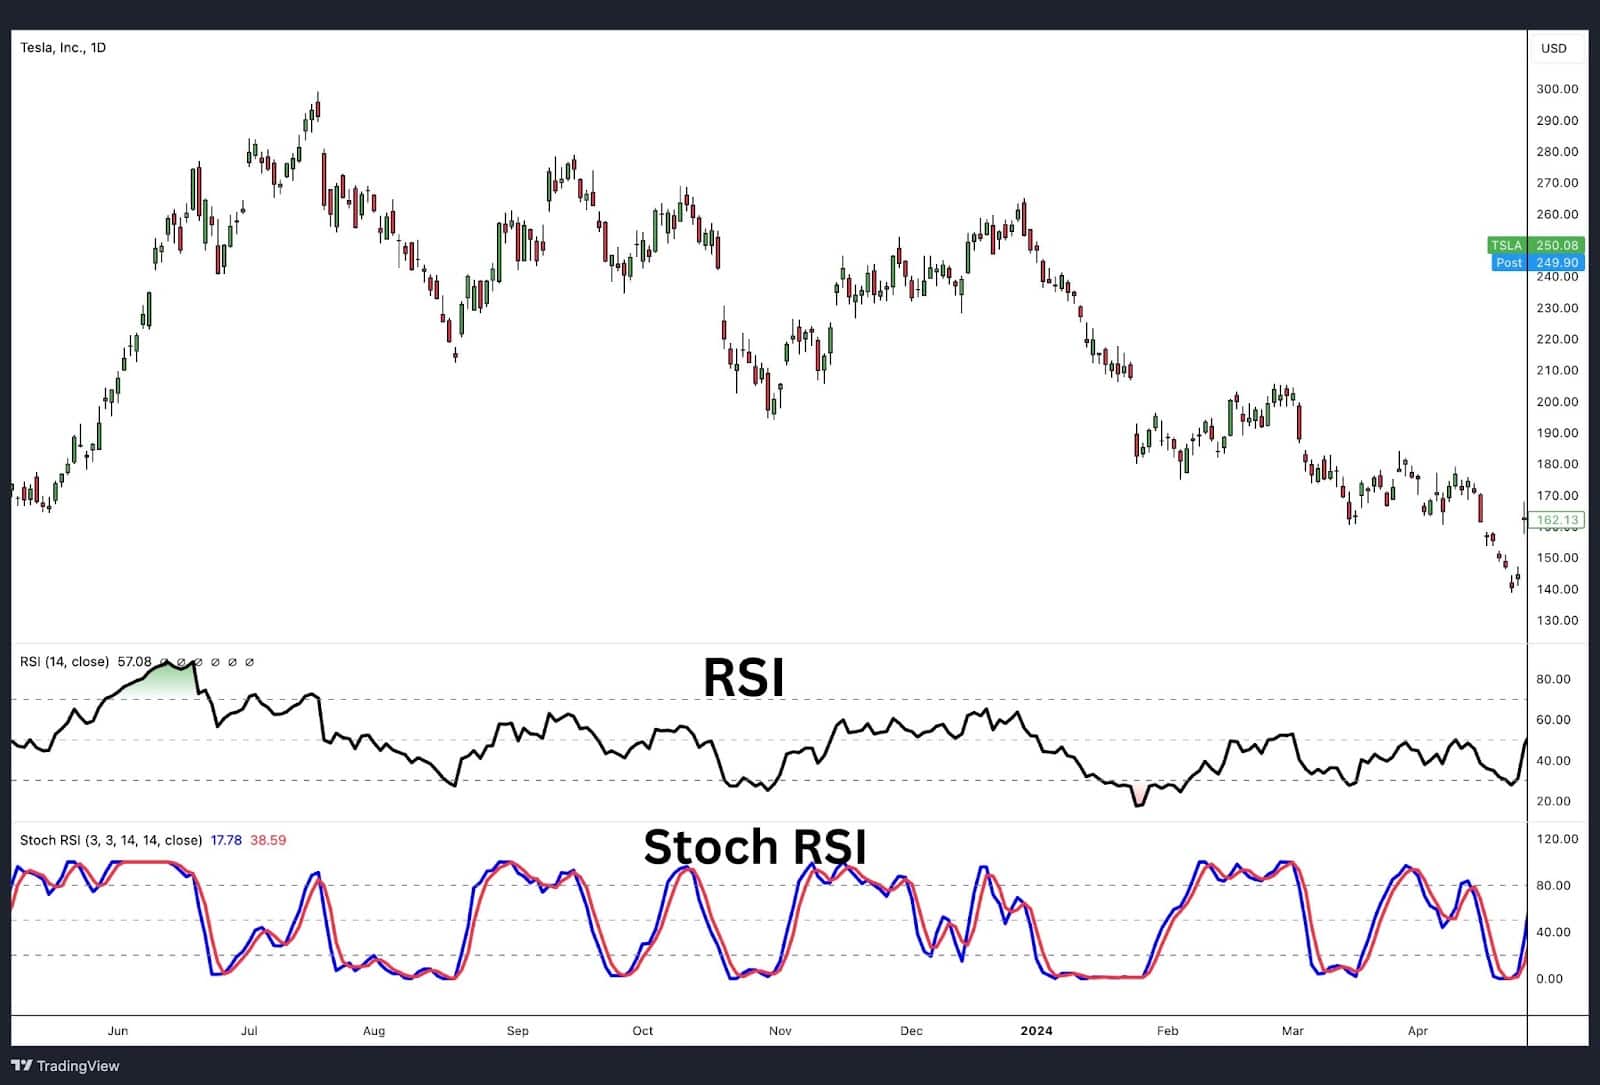
Stochastic RSI vs Relative Strength Index (RSI)?
Stochastic RSI Indicator vs. Relative Strength Index (RSI) Indicator
Similarities
The Stochastic RSI and the Relative Strength Index (RSI) share several notable similarities, as both are bounded price oscillators that range between 0 and 100. They are primarily used by technical traders to identify overbought and oversold conditions in the market. Additionally, many of the strategies and techniques applied to one can also be used with the other, making them both valuable tools in technical analysis.
Key Differences
Despite these similarities, there are key differences between the two indicators:
- Calculation Method:
The RSI is directly derived from price data. It measures the speed and change of price movements to identify potential overbought or oversold conditions.
On the other hand, the Stochastic RSI takes the RSI value as its input and then applies the Stochastic Oscillator formula. This compound calculation results in a more sensitive indicator that reacts faster to price changes. Essentially, it is a stochastic calculation based on RSI readings rather than directly on price.
- Number of Trading Signals:
The Stochastic RSI tends to generate more trading signals than the RSI due to its increased sensitivity to price movements. This makes it more suitable for traders who seek frequent opportunities but may also lead to more false signals.
- Indicator Lines:
The RSI is represented by a single line, which makes it simpler and potentially less nuanced. The Stochastic RSI uses two lines, %K and %D, providing additional layers of analysis through crossovers, which can offer further insights into potential market reversals.
Additionally, both indicators utilise separate levels of overbought and oversold zone. The RSI uses 30 and 70 as its default thresholds. On the other hand, Stochastic RSI uses 20 and 80 to signal more extreme market conditions.
Stochastic Oscillator vs Stochastic RSI
Stochastic RSI Indicator vs. Stochastic Oscillator
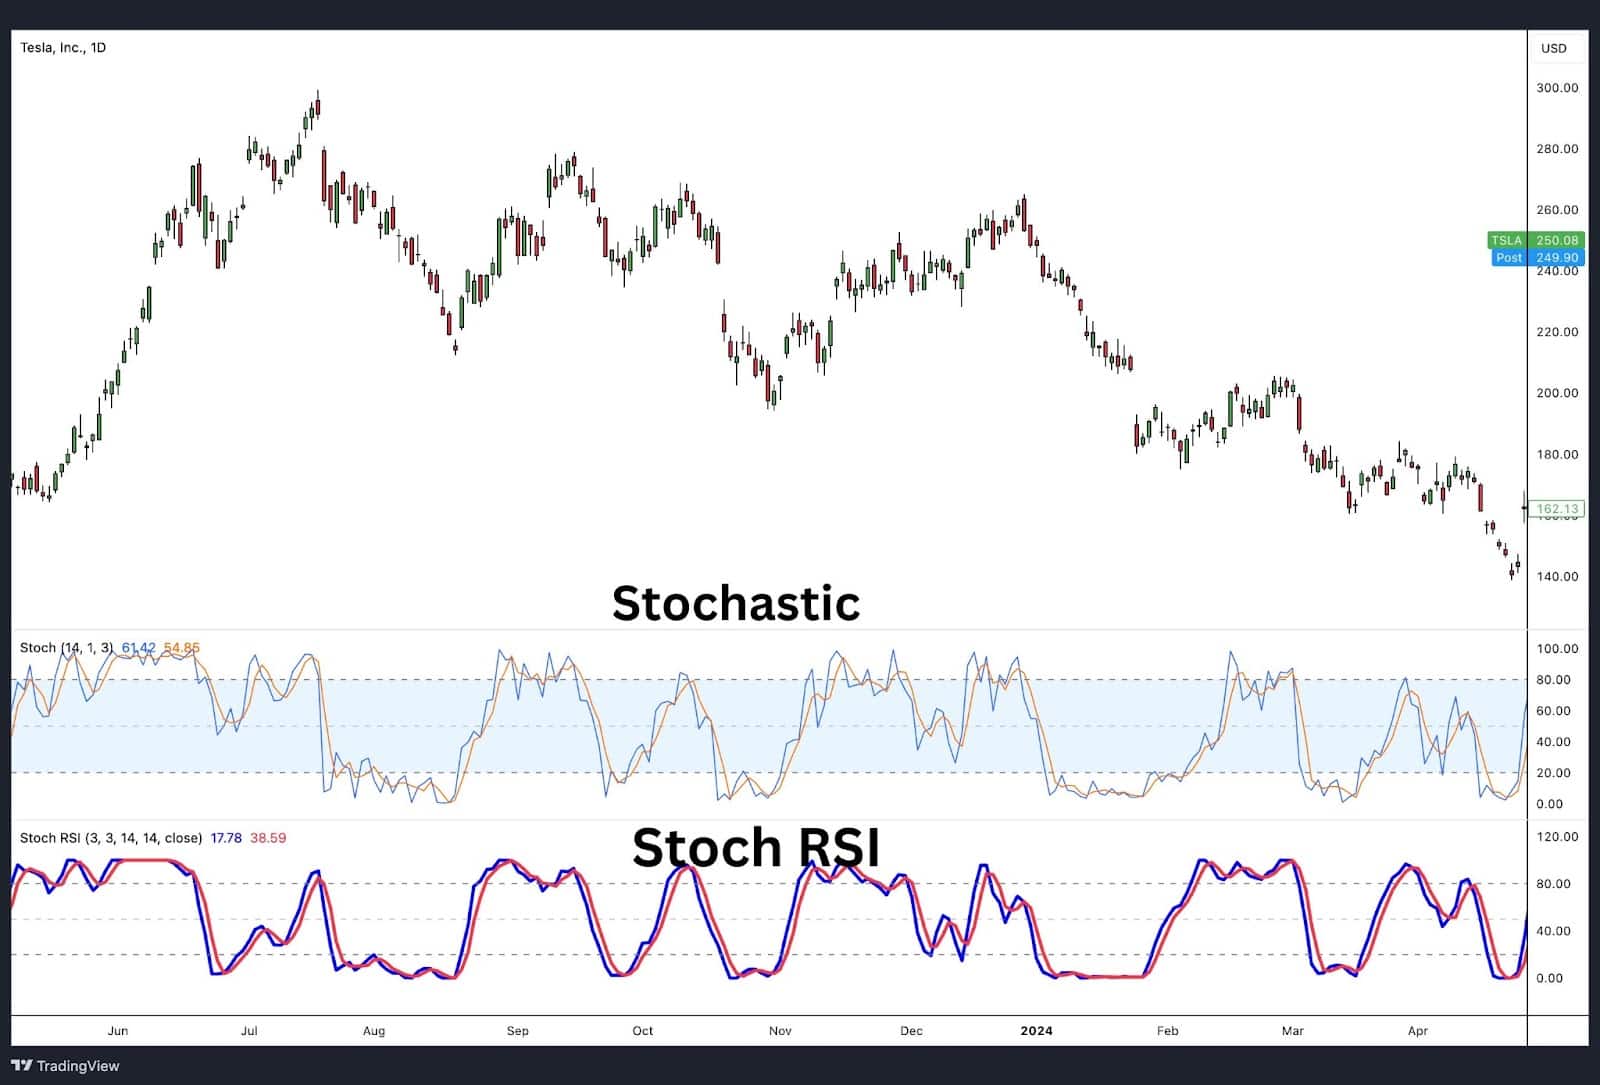
Clearly, both the Stochastic Oscillator and Stochastic RSI have the same formula embedded within it.
The primary difference between them lies in the input used for their calculations. The Stochastic RSI is essentially a Stochastic Oscillator that takes the Relative Strength Index (RSI) of the same asset, within the same time frame, as its input in a compound calculation. Despite this difference, both indicators are quite similar in nature. They are both price oscillators designed to signal when a market is overbought or oversold.
The table below summarises the key characteristics of these three indicators:
Comparison Table: RSI vs. Stochastic Oscillator vs Stochastic RSI
| RSI | Stochastic Oscillator | Stochastic RSI | |
| Input | Average gain/loss over (n)-periods | Closing Price | RSI result |
| Formula | RSI = 100 − 10/1 + RS | % K = 100 × (Current Close − Lowest Low (n) / Highest High (n) − Lowest Low (n) | StochRSI = [Current RSI (n) − RSI Lowest Low] / [RSI Highest High (n) − RSI Lowest Low (n)] |
| Output | Oscillator between 0 and 100 to signal Overbought/Oversold | Oscillator between 0 and 100 to signal Overbought/Oversold | Oscillator between 0 and 100 to signal Overbought/Oversold |
| Sensitivity Level | Low | Average | High |
Stochastic RSI vs MACD
Stochastic RSI Indicator vs. MACD Indicator
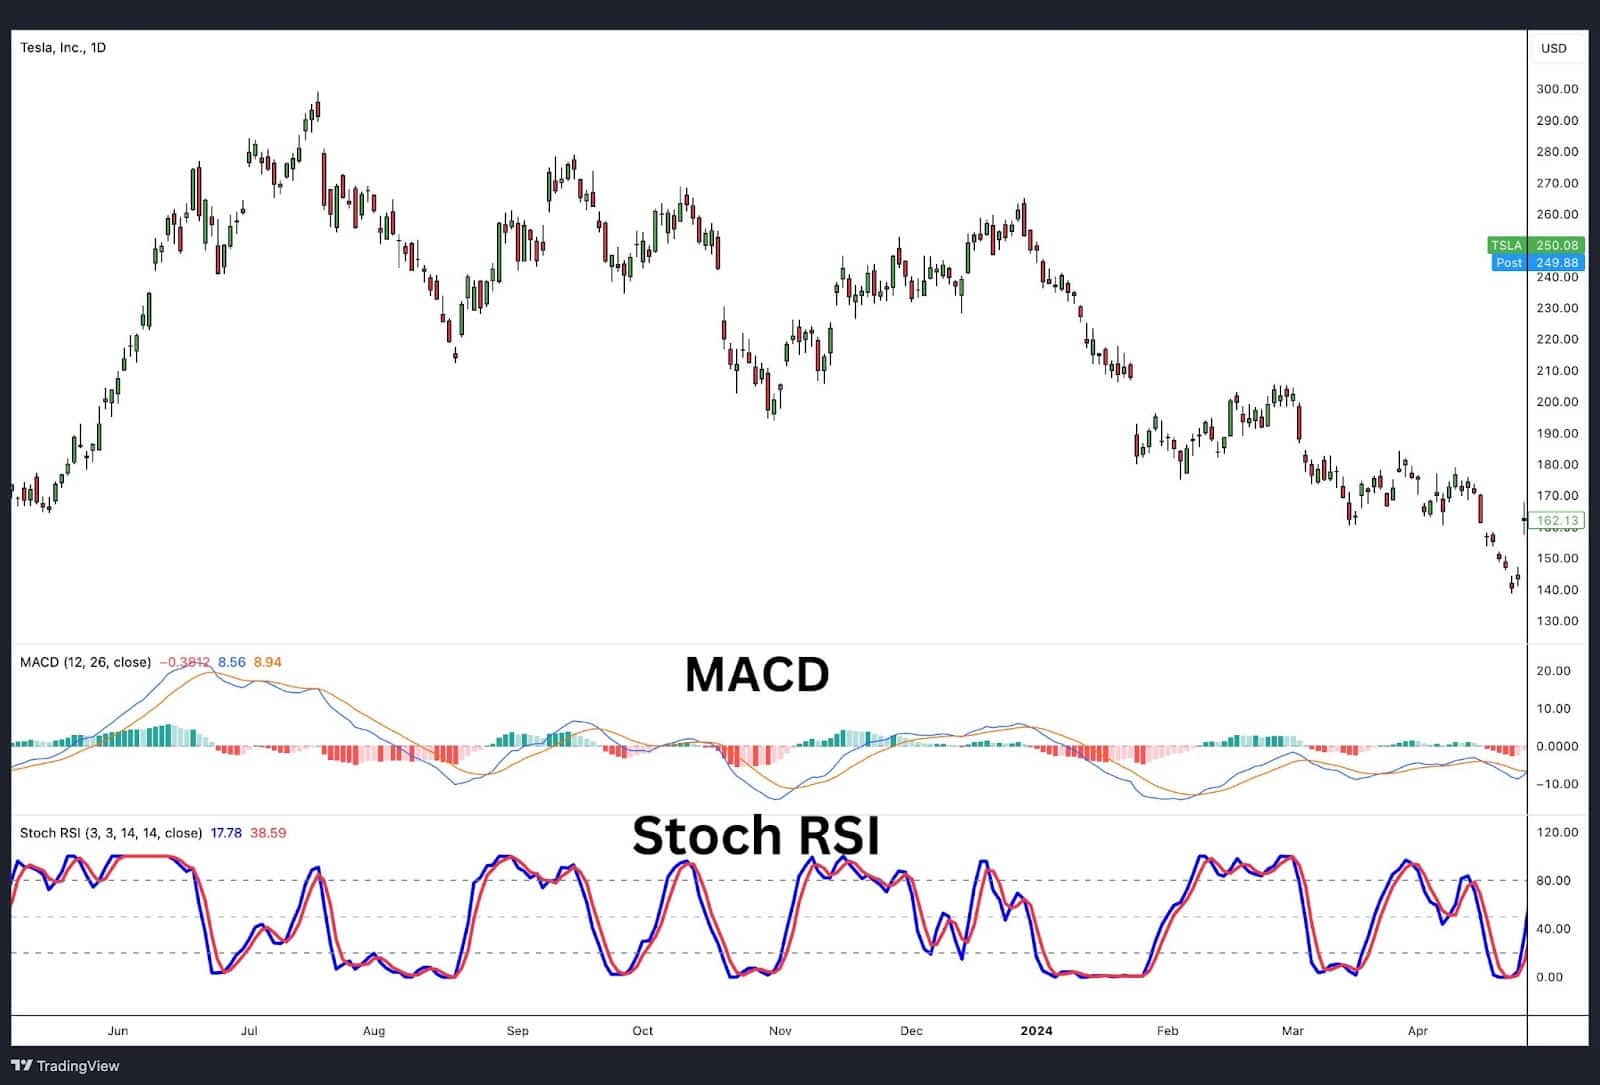
Both the Stochastic RSI and the MACD rely on compound calculations to produce their respective indicators. However, the key difference lies in how these calculations are performed.
The Stochastic RSI indicator combines two different calculations—the Relative Strength Index (RSI) and the Stochastic Oscillator—to create a more sensitive metric for detecting overbought and oversold conditions.
On the other hand, the MACD uses two moving averages of different lengths (typically the 12-period and 26-period EMAs) to identify momentum and trend direction. The result is then plotted as the MACD line, along with a secondary moving average (signal line) and a histogram that measures the difference between the two MACD lines.
As an oscillator, the Stochastic RSI is designed to detect overbought and oversold conditions in the market. It is plotted on a bounded scale between 0 and 100. On the flip side, the MACD is not a bounded oscillator and is instead plotted on an unbounded scale with a zero line. This helps traders determine whether momentum is positive or negative. The MACD is also used to identify potential trend reversals and momentum shifts.
Stochastic RSI vs Connors RSI
Stochastic RSI Indicator vs. Connors (RSI) Indicator
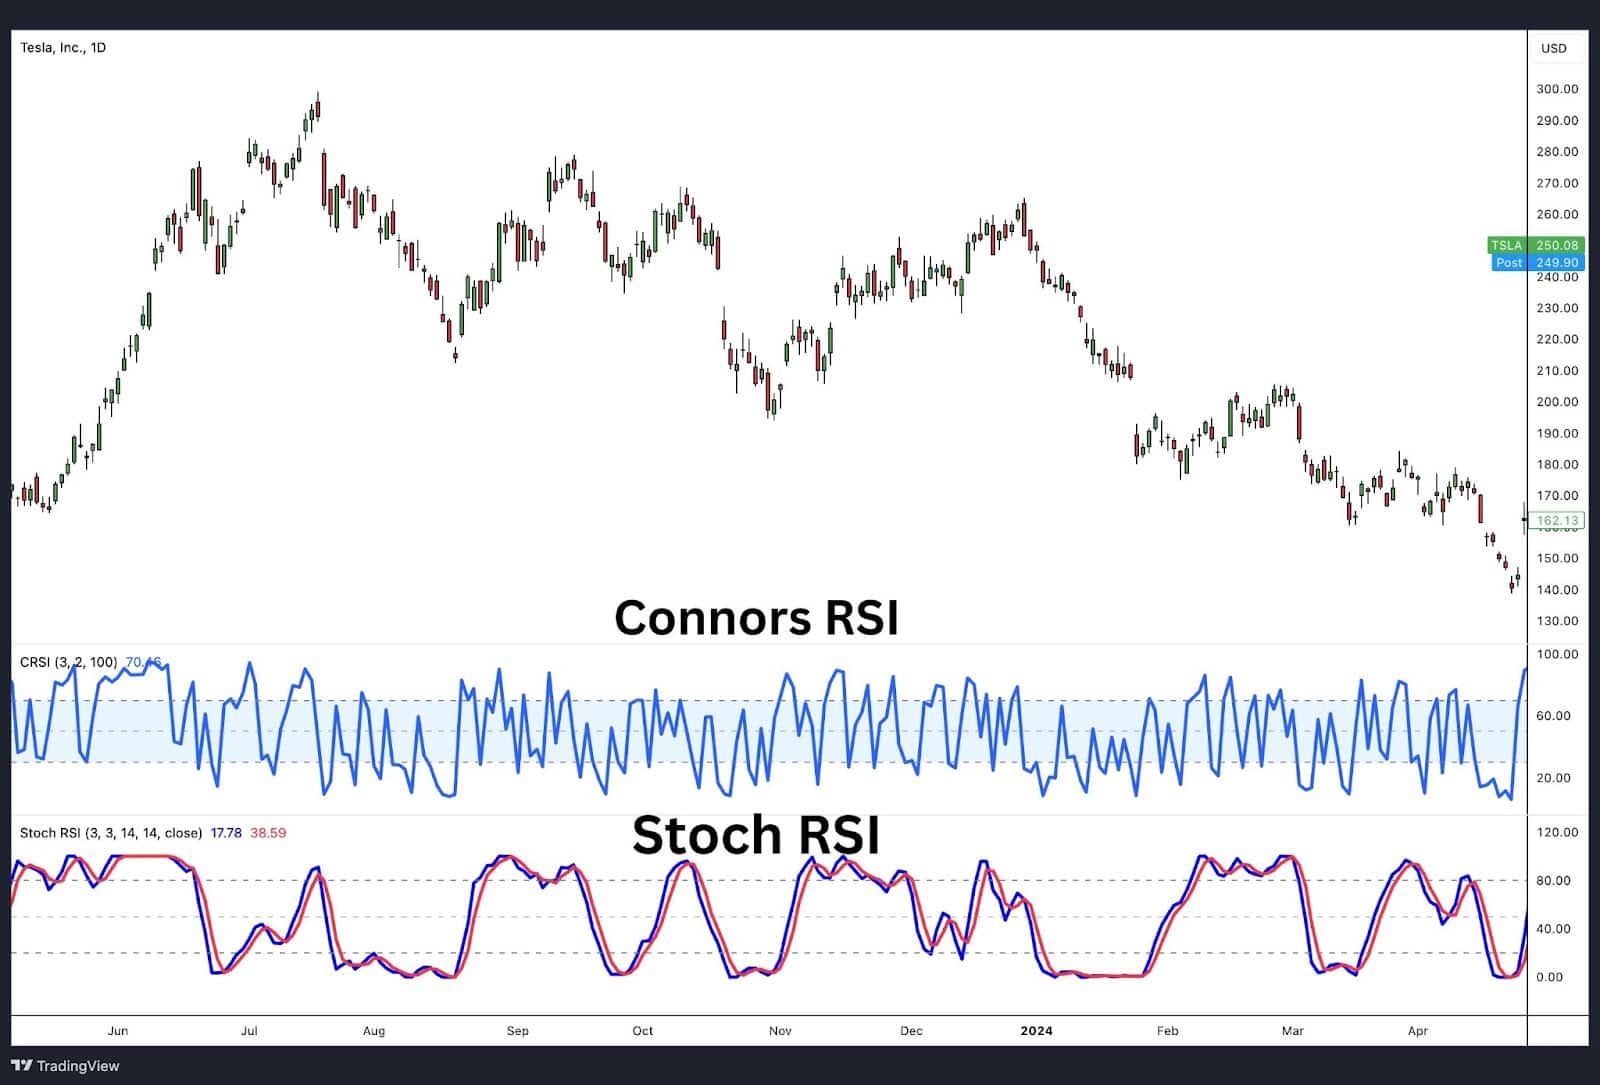
Both the Stochastic RSI and the Connors RSI are oscillator indicators that use compound calculations. The results of these calculations are plotted on a chart with a scale ranging from 0 to 100, highlighting overbought and oversold levels. However, the two indicators differ significantly in their composition and intended use:
The Stoch RSI indicator is based on two lines, %K and %D, which are derived from the combination of the Relative Strength Index (RSI) and the Stochastic Oscillator. It is designed to detect overbought and oversold conditions by providing a more sensitive measure of market momentum.
On the other hand, the Connors RSI is specifically tailored for very short-term trading. It modifies the traditional RSI by using a setting of (2) and adds two additional components: an up/down streak length component and a magnitude of price change component. This makes the Connors RSI particularly effective for identifying short-term price movements.
FAQs
What are the best Stochastic RSI settings?
The default setting that most traders use is 3, 3, 14, 14 (%D, %K, RSI Length, Stoch Length). While technical indicators come with default settings that generally work across most strategies, test out settings for your strategy in a practice account.
How reliable is Stochastic RSI?
The Stochastic RSI is simply a tool that is sensitive to turning points in the market’s price. It’s reliability will fall back on the trader’s use of the tool. For example, if an indicator consistently generates small winning trades but also causes large and significant drawdowns, it may be viewed as reliable even though the strategy may pose a high risk to the trading account.
Is Stochastic RSI a leading or lagging indicator?
The Stochastic RSI is a lagging indicator, as it relies on historical price data to calculate its values. Since it uses the Relative Strength Index (RSI), which is itself based on past price movements, the Stochastic RSI naturally lags behind current market conditions.
What are k and d in Stochastic RSI?
The %K in the Stochastic RSI represents the initial calculation, where the current RSI value is compared to its highest and lowest points over a specified period. The %D is a 3-period moving average of the %K. Both %K and %D are plotted on a scale from 0 to 100 and their crossovers often signal potential changes in market direction.
What is the origins of Stochastic RSI?
The Stochastic RSI was developed by Tushar S. Chande and Stanley Kroll and introduced to the trading world in 1994 through their book, The New Technical Trader. The indicator was designed to combine the strengths of two existing tools—the RSI and the Stochastic Oscillator—to create a more sensitive indicator capable of generating a greater number of trading signals.
Which timeframe is best for Stochastic RSI?
Shorter intraday time frames might be more effective for day trading in the forex market while a daily time frame could be better for trading stocks over a longer period. Comprehensive testing is recommended to determine the most suitable time frame for your strategy.


