


Written by:

Reviewed by:


- August 12, 2025
- 21 min read
Money Flow Index (MFI) – How To Trade It
The Money Flow Index (MFI) is a powerful momentum oscillator that combines price and volume to reveal real buying and selling pressure in the market.
Despite being a highly valuable technical indicator, it remains underused by many traders, even though when used correctly, it can confirm trade entries and help identify high-probability setups across different markets.
What is a Money Flow Index?
The Money Flow Index (MFI) is a volume-weighted momentum indicator that identifies overbought or oversold conditions by analysing price and volume data. Incorporating volume data into technical analysis is important, and the MFI achieves this by using both price movement and trading volume to calculate buying and selling pressure, offering deeper insights into market sentiment.
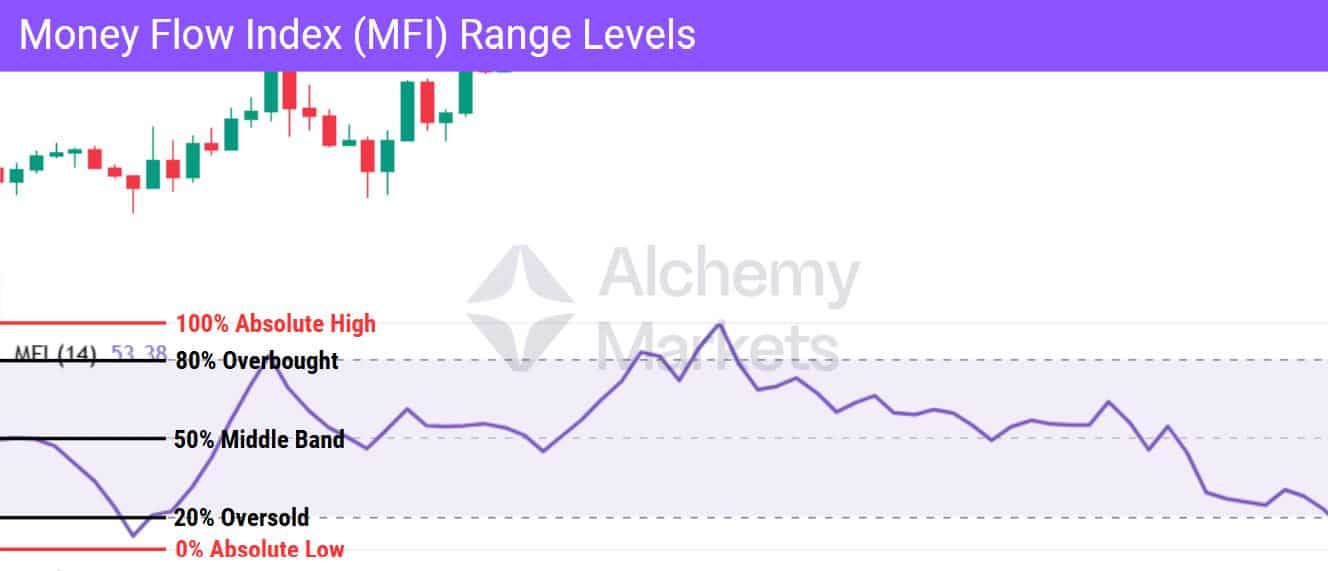
The indicator ranges from 0 to 100. An MFI value above 80 typically signals overbought conditions, while a reading below 20 suggests oversold conditions. This enables traders to anticipate reversals or confirm trend strength using volume-backed signals.
What makes the MFI unique is its ability to capture the intensity of money flow into or out of a security, rather than relying solely on price action. This provides traders with a more comprehensive tool for understanding market behaviour, especially when used in conjunction with other indicators, such as the Relative Strength Index (RSI), moving averages, and additional indicators for signal confirmation.
The MFI highlights price extremes that are supported by real volume activity. This balance of price and volume makes it an essential tool for technical analysis, particularly in trending markets.
How Does the Money Flow Index Indicator Work?
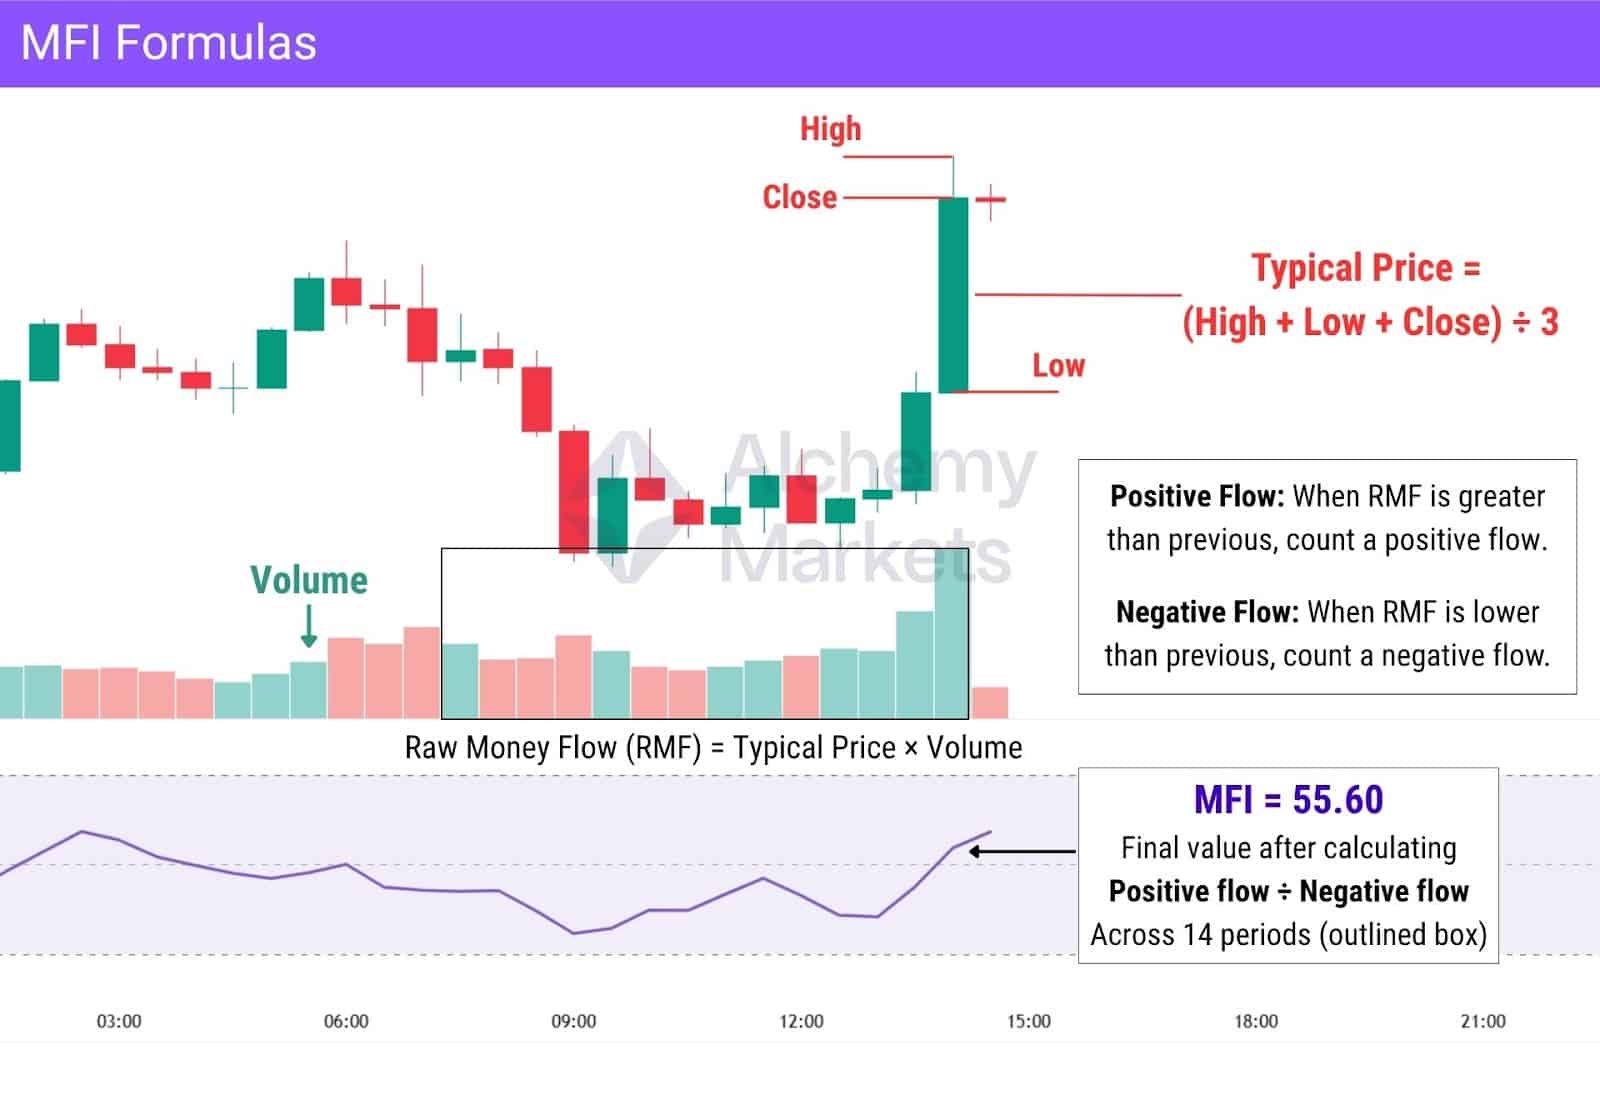
The Money Flow Index calculation follows a logical sequence of steps that combine price and volume data to assess whether capital is flowing into or out of a financial asset. It begins by calculating the typical price for each period:
Typical Price = (High + Low + Close) ÷ 3
This typical price is then multiplied by the volume to determine the raw money flow. If the current period’s typical price is higher than the previous period’s, the flow is classified as positive; if lower, it’s considered negative.
Over a common lookback period, typically 14 periods, the MFI calculation totals the total positive and negative money flows separately. These figures are used to compute the money ratio, which is then converted into the final index value using the formula:
MFI = 100 – [100 ÷ (1 + Money Flow Ratio)]
The resulting value ranges from 0 to 100 and reflects the balance of buying and selling pressure, weighted by volume. By incorporating volume alongside price, the MFI offers a more complete view of market sentiment than price-based indicators alone.
Why is the Money Flow Index (MFI) important?
The Money Flow Index (MFI) is important because it provides a more comprehensive view of market strength by integrating both price and volume. Unlike traditional indicators that focus solely on price, the MFI captures actual capital inflows and outflows, offering clearer insights into buying and selling pressure, particularly in volatile markets.
This volume-based perspective helps traders detect early signs of trend weakness. For instance, when price continues to rise while the MFI declines, it may indicate fading bullish momentum and a potential reversal.
The MFI also improves the reliability of overbought and oversold signals by filtering out noise from irregular price movements. This makes it especially effective for identifying precise entry and exit opportunities across various timeframes and asset classes.
When used alongside other technical tools, the MFI enhances signal confirmation and supports smarter risk management as part of a well-rounded trading strategy.
Money Flow Index Formula
The Money Flow Index (MFI) quantifies buying and selling pressure by blending price and volume into a single momentum reading. The calculation begins with the typical price:
Typical Price = (High + Low + Close) ÷ 3
This value is then multiplied by volume to determine the raw money flow:
Raw Money Flow = Typical Price × Volume
Next, each period’s money flow is classified as positive or negative based on whether its typical price is higher or lower than the previous period.
Over a standard 14-period lookback, the sum of positive and negative money flows represents the total money flow for that period. These totals are then divided to calculate the money flow ratio:
Money Flow Ratio = Sum of Positive Flow ÷ Sum of Negative Flow
Finally, the MFI is derived using the following formula:
MFI = 100 – [100 ÷ (1 + Money Flow Ratio)]
The result is a value between 0 and 100. Extreme readings on this scale, especially above 80 or below 20, can signal potential market reversals, with price movements supported by underlying volume shifts.
How to Calculate Money Flow Index
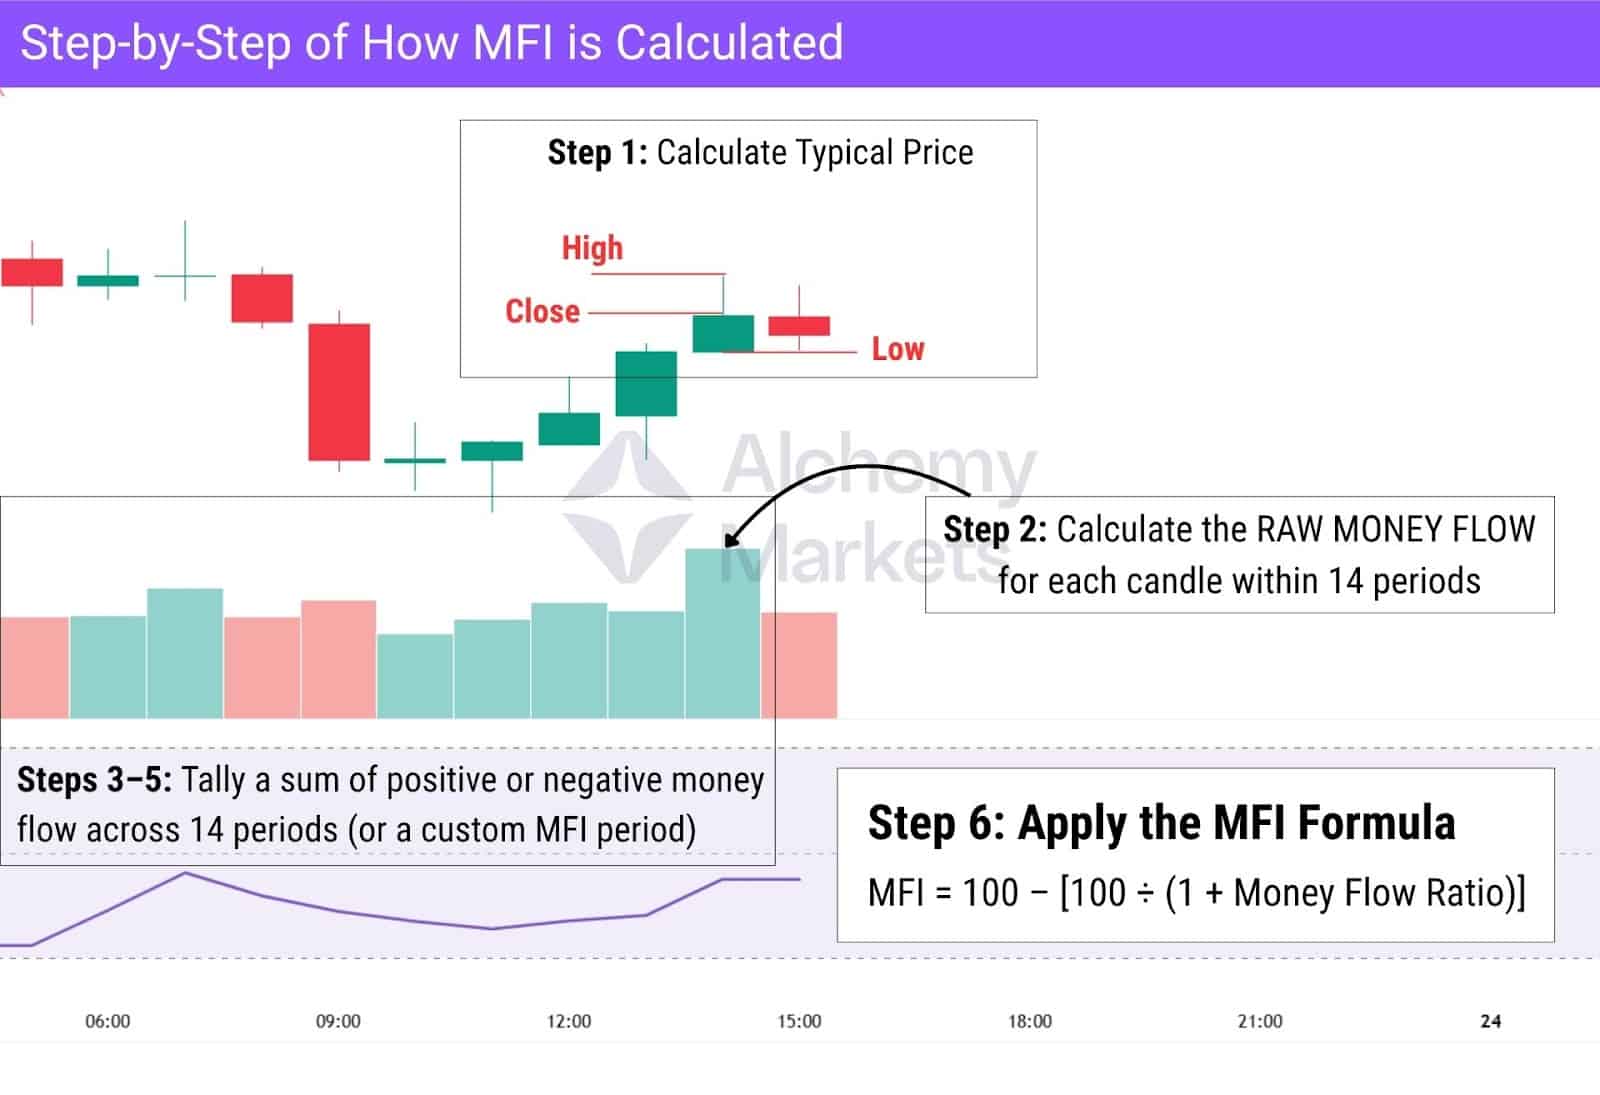
Calculating the Money Flow Index (MFI) involves a structured, six-step method that combines price and volume data.
Here’s the process:
- Calculate the typical price: Typical Price = (High + Low + Close) ÷ 3
- Determine the raw money flow within the MFI period: Raw Money Flow = Typical Price × Volume (For all 14 candles)
- Classify the money flow: If the typical price is higher than the previous period, record it as positive flow. If it’s lower, classify it as negative flow.
- Sum the flows: Add up all positive flows and all negative flows over the selected lookback period (usually 14 periods).
- Calculate the money flow ratio: Money Flow Ratio = Total Positive Flow ÷ Total Negative Flow
- Apply the MFI formula: MFI = 100 – [100 ÷ (1 + Money Flow Ratio)]
How to Interpret the MFI’s Signals
The Money Flow Index (MFI) can produce misleading signals when used alone. That’s why having a basic understanding of market structure, and MFI ranges can be key to your ability to use this indicator.
As the chart above illustrates, an overbought reading initially signalled a potential reversal, but price continued to rise, showing a false signal due to a lack of confirmation and because it went against the uptrend. This demonstrates how price moves can sometimes persist despite an overbought reading, highlighting the importance of analyzing both price and volume data.
Later, the MFI pulled back to the 60% level and bounced, aligning with the overall trend and a bullish candle confirmation. In this scenario, prices rise in alignment with the MFI and trend, providing a much stronger, more reliable signal.
Interpreting Money Flow Index (MFI) signals can greatly improve trading decisions, as the indicator reveals buying and selling pressure by tracking how capital flows into or out of a market.
The most common interpretation involves overbought and oversold zones. An MFI value above 80 typically indicates an overbought condition, suggesting that a price correction could follow. Conversely, a reading below 20 highlights oversold conditions, which may precede a bullish rebound.
However, these thresholds are best used alongside other techniques. A powerful confirmation method involves identifying divergence between price and the MFI. For example, if price forms a higher high while the MFI forms a lower high, it may reflect waning bullish momentum, a possible bearish reversal — not dissimilar to how an RSI divergence works.
Similarly, if price makes a lower low but the MFI posts a higher low, it can indicate strengthening underlying demand and potential upward movement.
Another key signal comes from the midpoint level of 50.
- A rise above 50 often confirms growing buying pressure.
- A drop below 50 suggests increasing selling pressure.
Used in combination with other indicators, MFI signals can help validate entry and exit decisions with greater precision. It’s particularly effective in trend analysis, where volume-supported shifts are more likely to sustain.
Money Flow Index Example
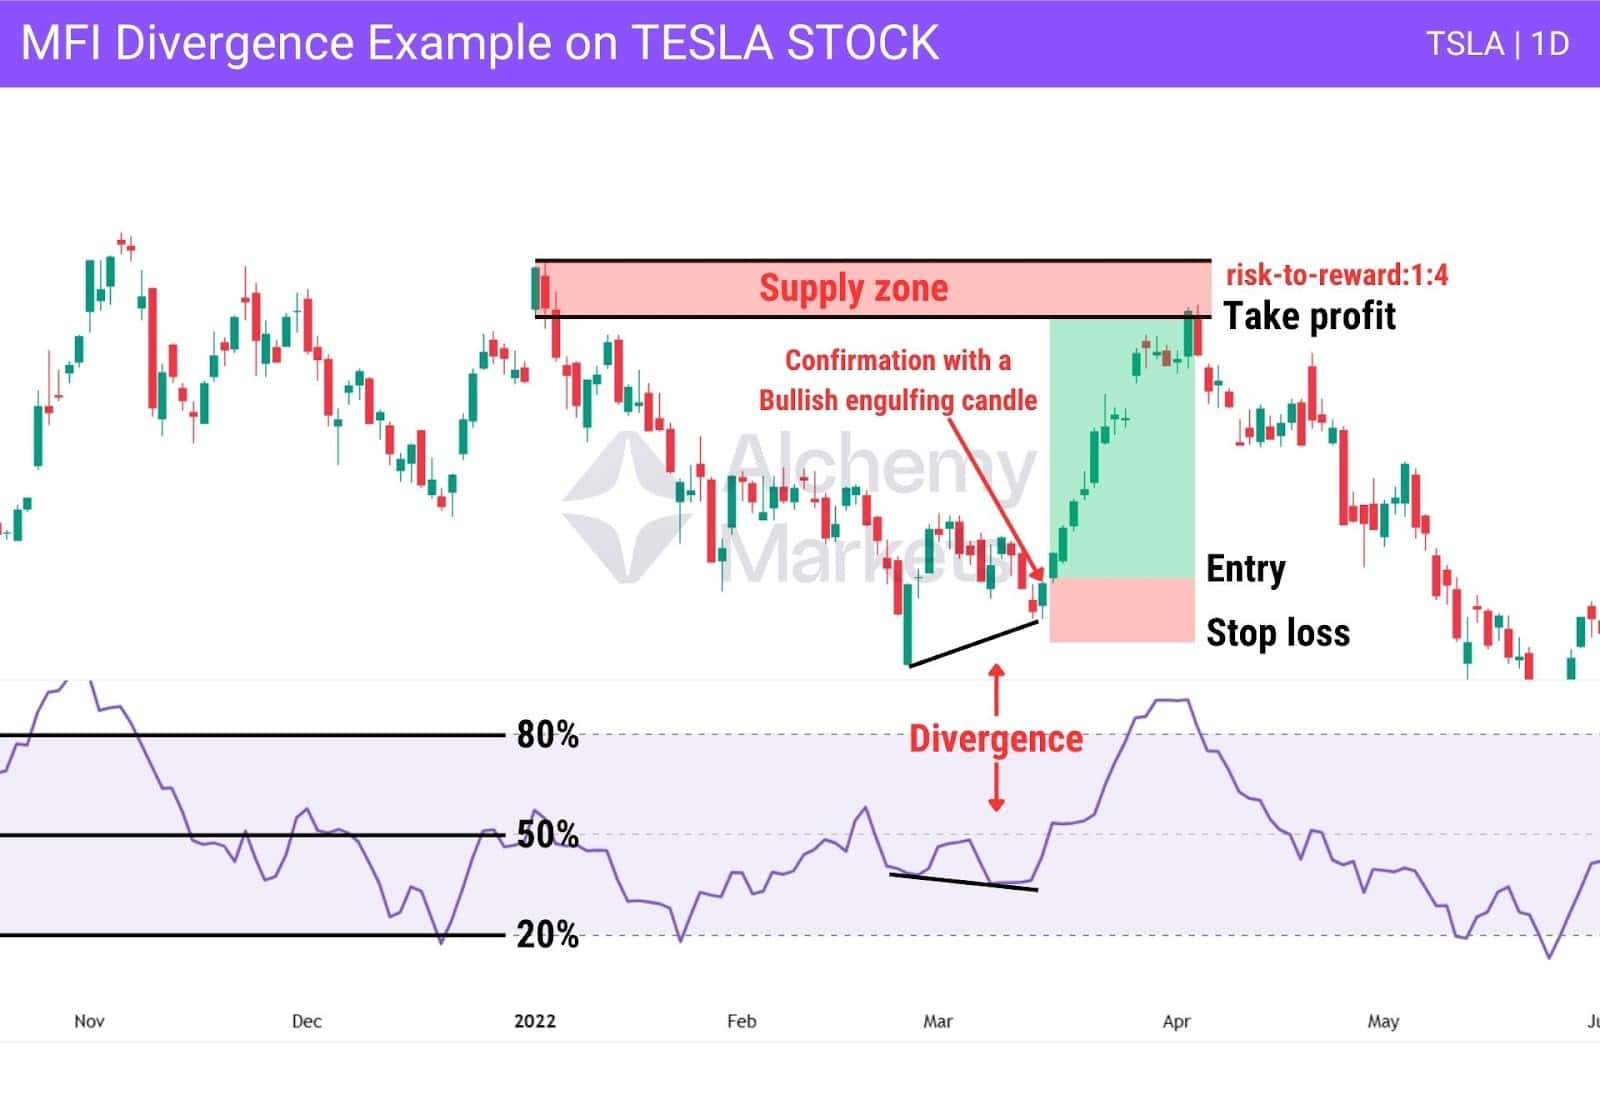
In the daily chart of Tesla (TSLA), we observe a clear case of hidden bullish divergence between price and the Money Flow Index (MFI). While the price failed to make a new lower low and instead held a higher low, the MFI printed a lower low below the 50 level signalling underlying accumulation and suggesting a continuation of bullish momentum.
This kind of divergence often precedes a significant price movement, especially when supported by increasing volume or key support zones. Shortly after the signal appeared, TSLA rallied sharply, reinforcing the bullish outlook and validating the hidden divergence.
Traders may view this setup as an early entry opportunity. When combined with volume spikes or bullish candlestick patterns, it becomes a much stronger confirmation. This example shows how the MFI can reveal subtle shifts in market sentiment before they appear clearly in price action.
Money Flow Index Trading Strategies
The Money Flow Index (MFI) isn’t just a signal for overbought or oversold conditions, it can be used in a variety of trading strategies to improve entries, exits, and trend confirmation.
By combining price and volume, the MFI helps traders spot momentum shifts and hidden opportunities across different market environments. Whether you trade breakouts, reversals, or range-bound setups, MFI strategies can provide reliable, volume-backed signals to guide your decisions.
Let’s explore some of the most effective ways to use the MFI in real trading scenarios:
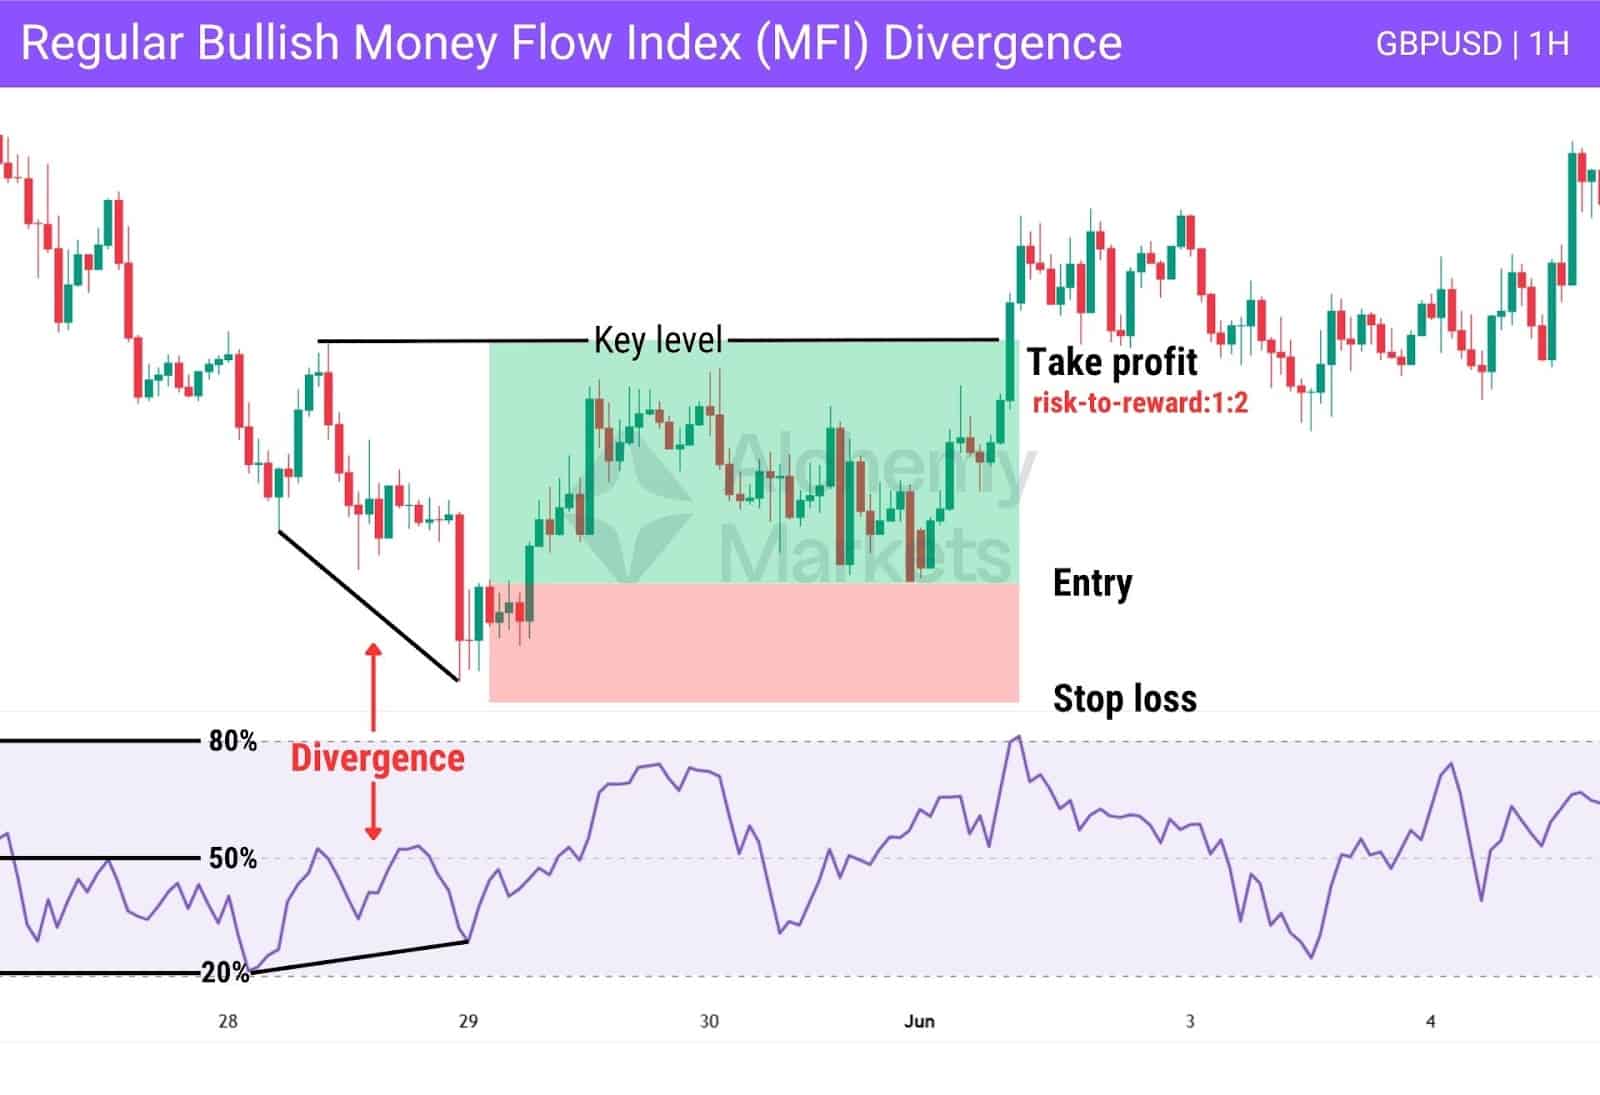
Bullish Money Flow Index (MFI) Divergence
Bullish divergence occurs when price makes a lower low, but the MFI prints a higher low. This suggests that although prices are falling, underlying buying pressure is increasing a potential signal that the downtrend is weakening and that price momentum may be shifting in favor of buyers.
Traders interpret this as a sign of positive money flow re-entering the market. The signal gains strength when combined with volume confirmation, key support levels, or bullish candlestick structures. In oversold zones, this setup becomes especially powerful for spotting early reversal opportunities.
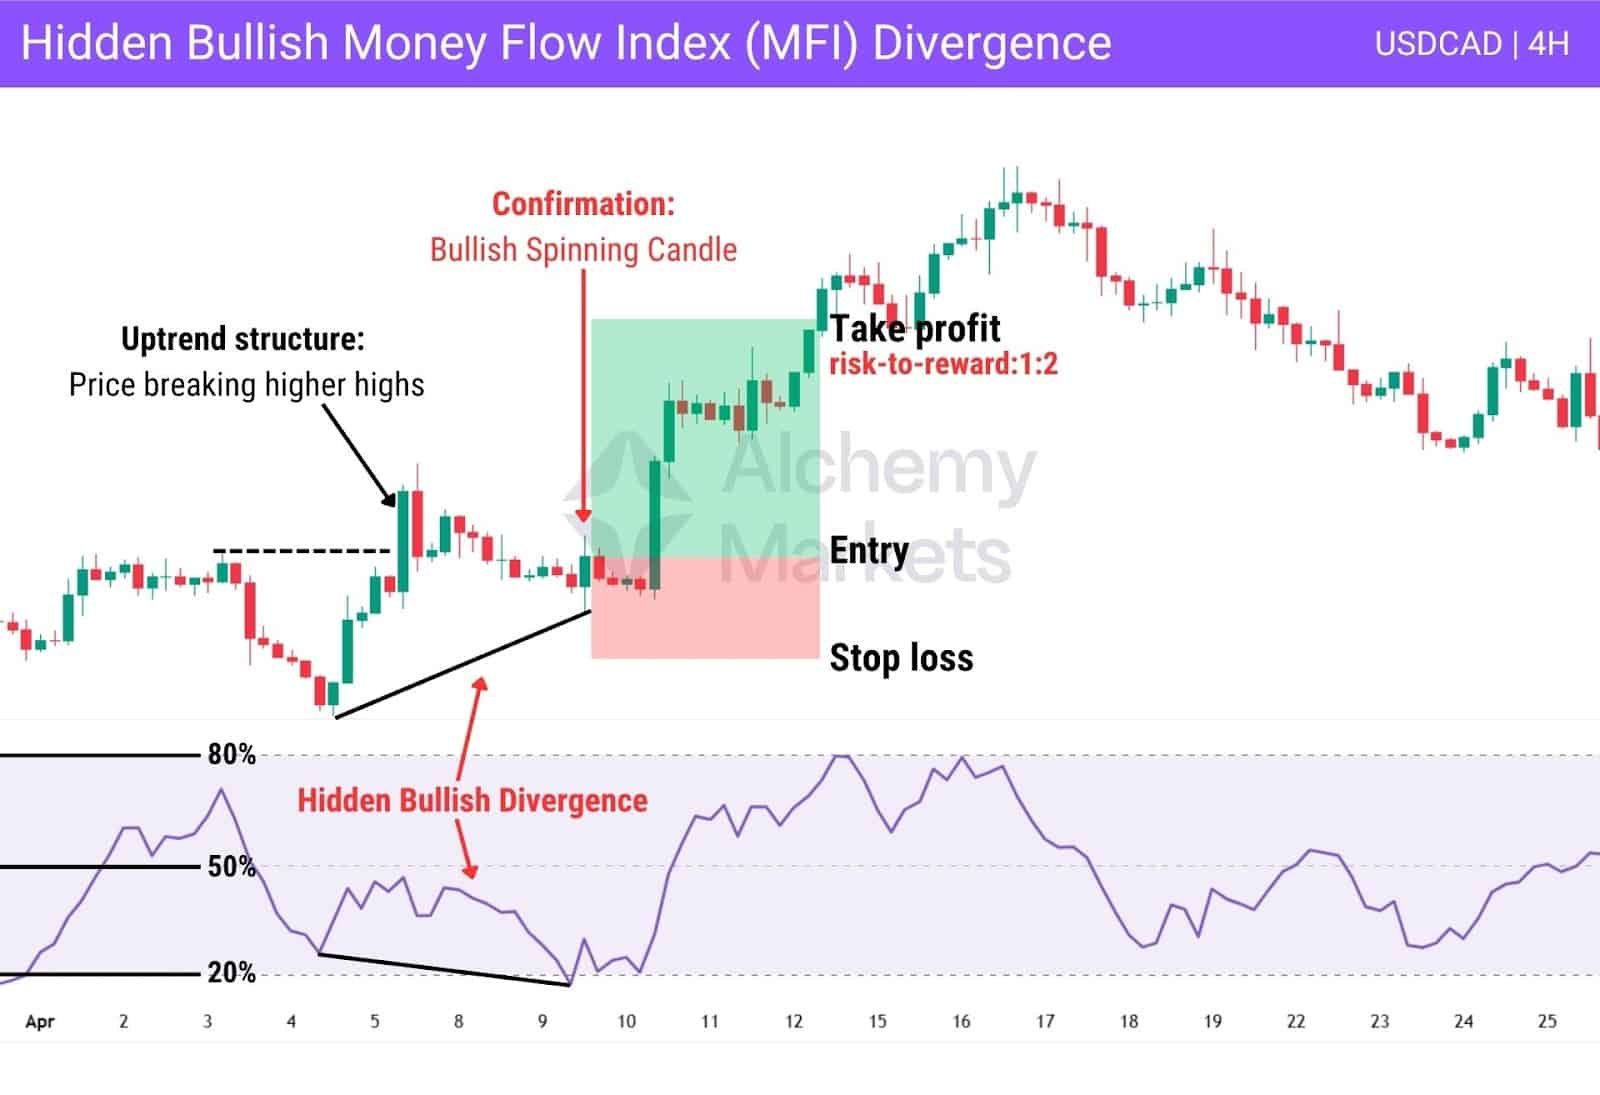
Apart from regular bullish divergences, the MFI can also signal hidden bullish divergences, typically seen in an upward trend when price makes higher lows while the MFI prints lower lows, suggesting potential trend continuation.
Traders can add further confirmation by analysing market structure, such as price forming higher highs, to strengthen the setup.
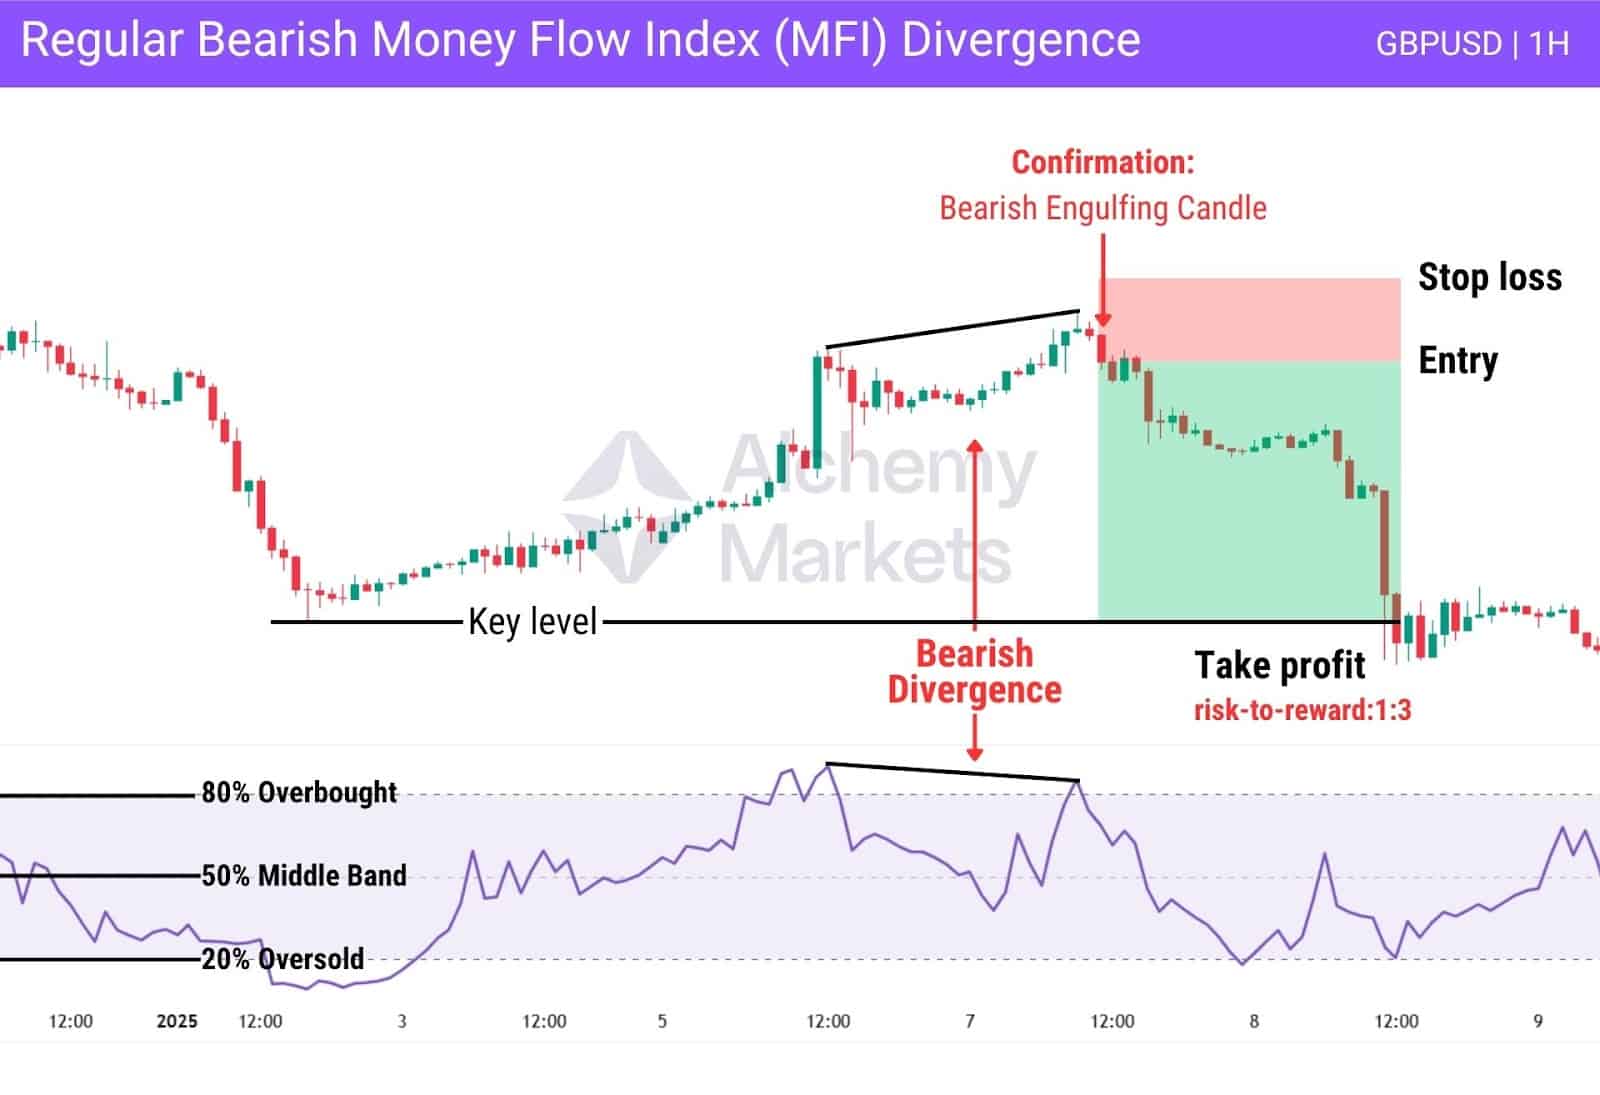
Bearish Money Flow Index (MFI) Divergence
Bearish divergence appears when price sets a higher high, but the MFI registers a lower high. This reflects weakening momentum and fading buyer interest, even as the market climbs a red flag that the uptrend may not be sustainable.
Such divergence is often used to signal exits or short entries, particularly when paired with overbought conditions, trendline breaks, or bearish candlestick formations. These signals are most effective near price extremes where reversals are more probable.
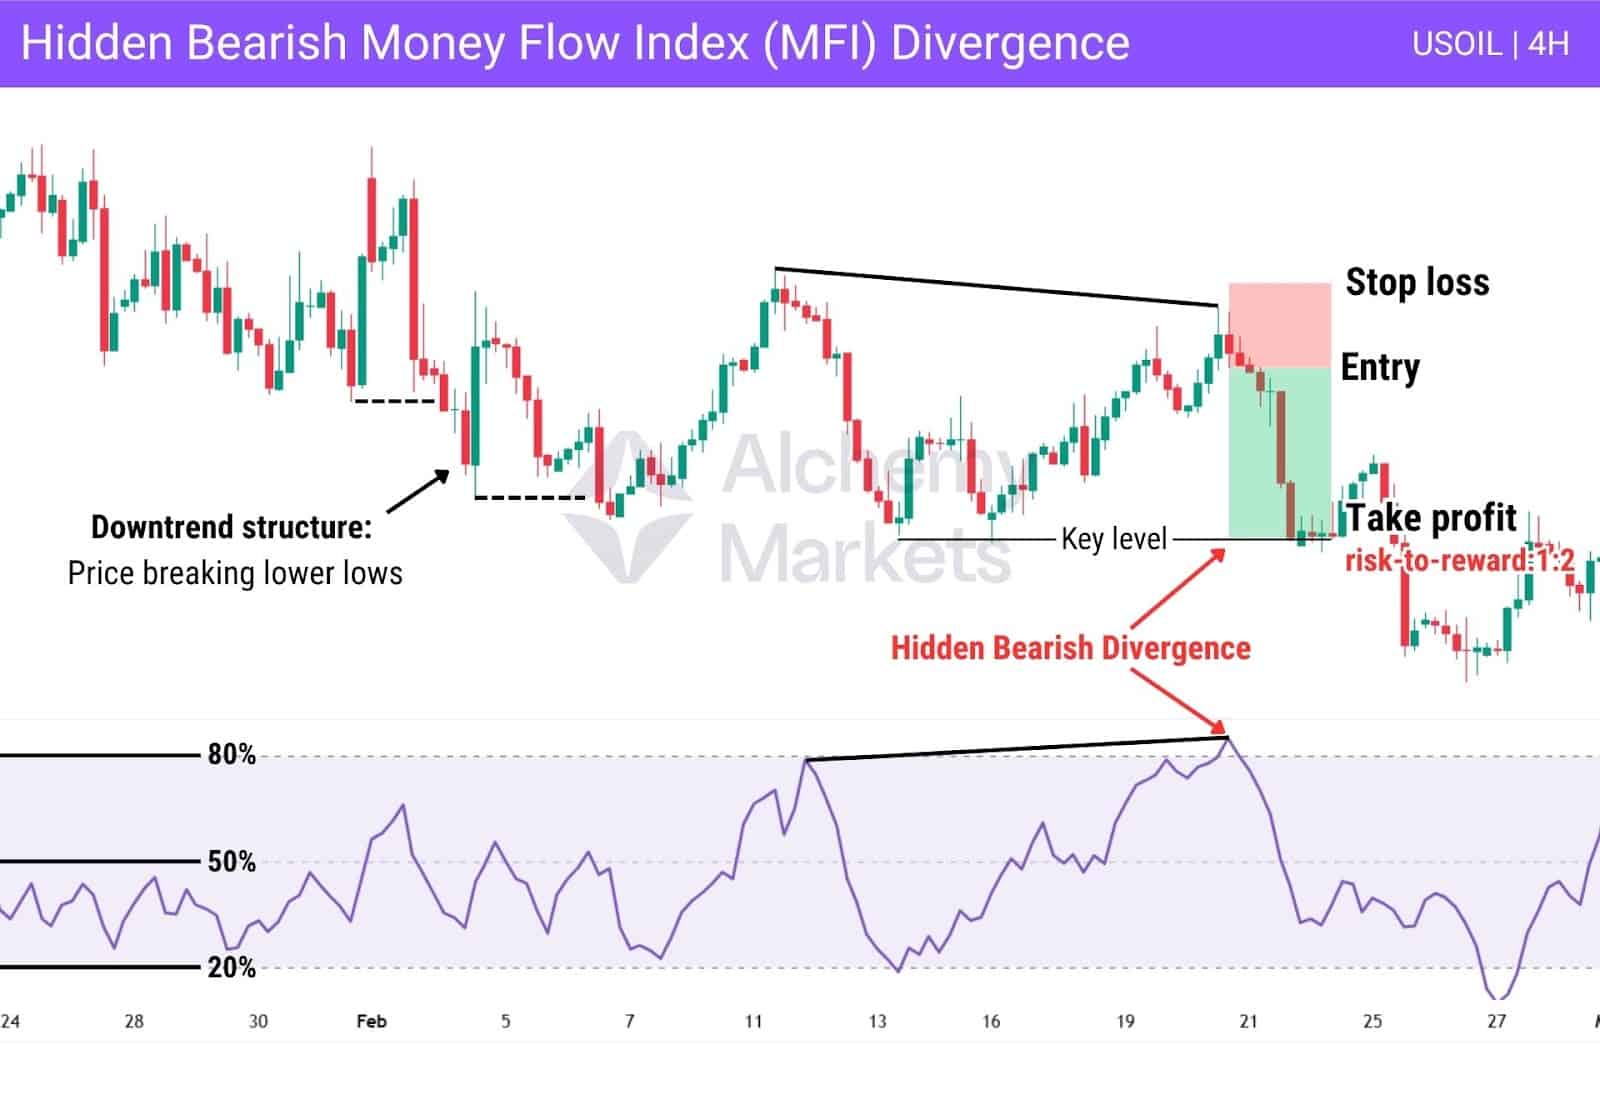
Beyond standard bearish divergences, the MFI is capable of identifying hidden bearish divergences, typically seen in a downtrend when price forms lower highs while the MFI prints higher highs, signalling potential trend continuation.
Traders can strengthen the setup by confirming market structure, such as price consistently making lower lows.
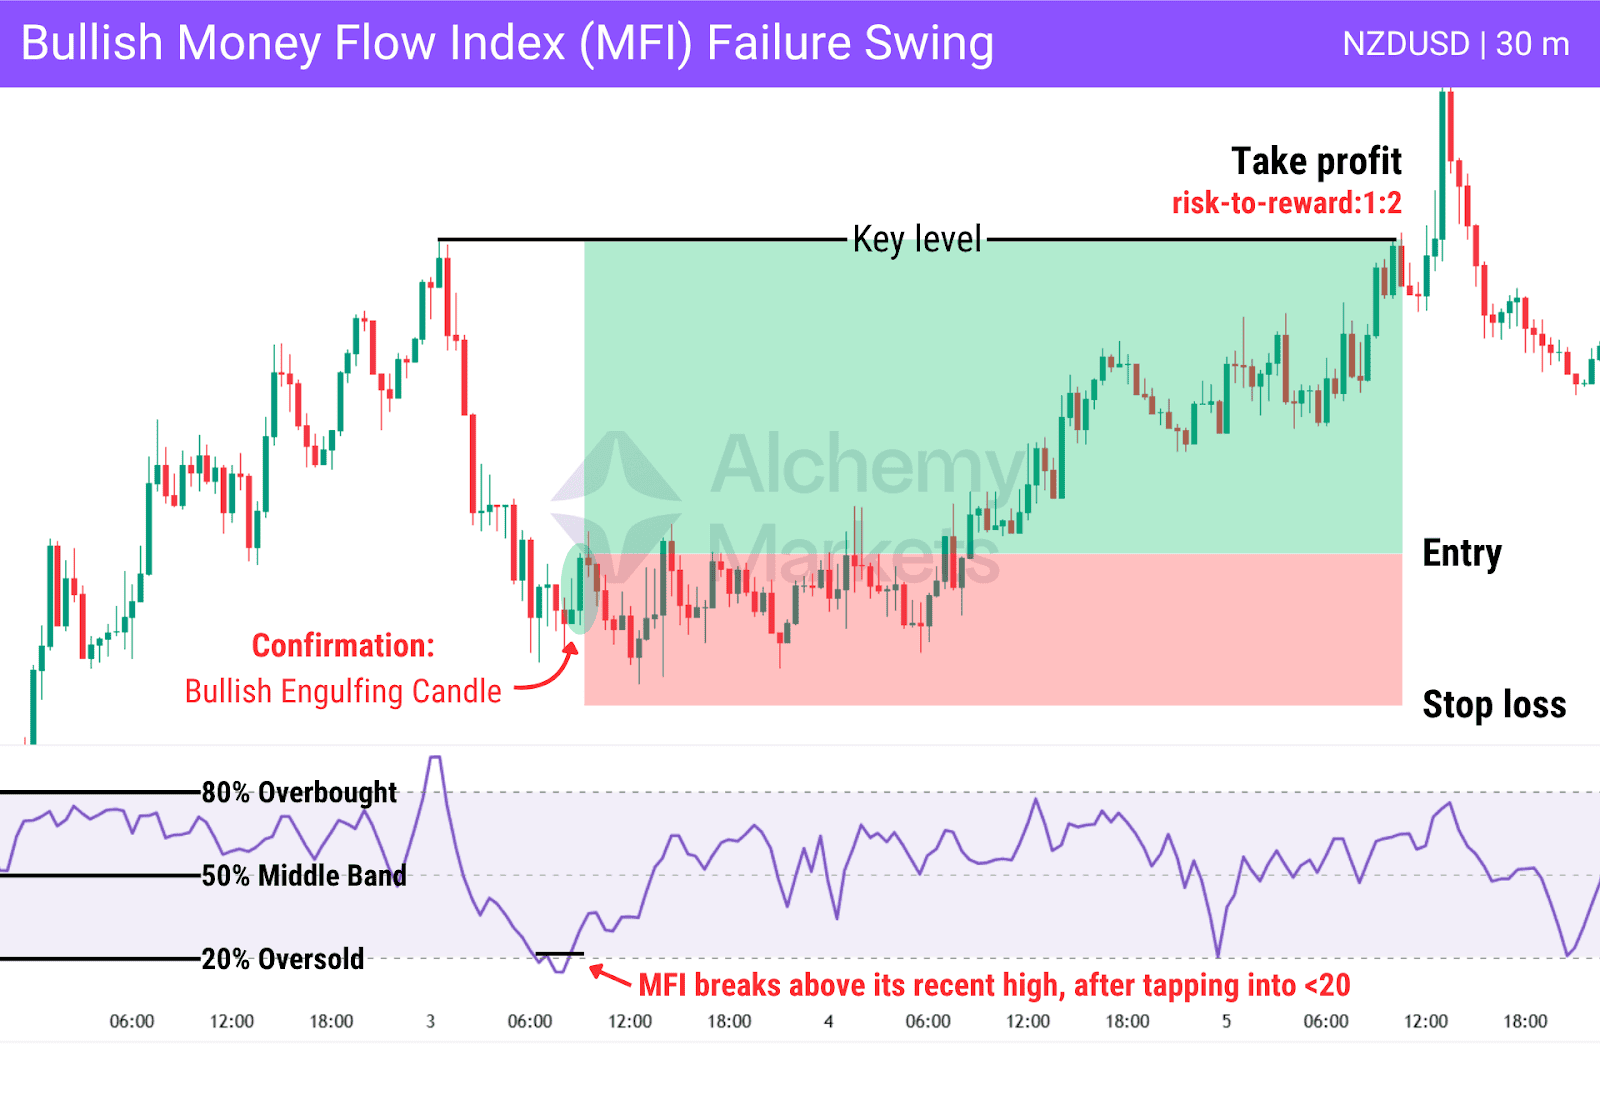
Bullish Money Flow Index (MFI) Failure Swing
This pattern develops when the MFI drops below 20 (oversold), then rebounds above 20, pulls back without forming a new low, and subsequently breaks above its recent high. It indicates that selling pressure is diminishing and buying momentum is beginning to build.
Unlike divergence, a failure swing is a standalone signal that doesn’t require price action to validate it. Traders often use this setup as an early entry into potential reversals, particularly in consolidating or mildly trending markets.
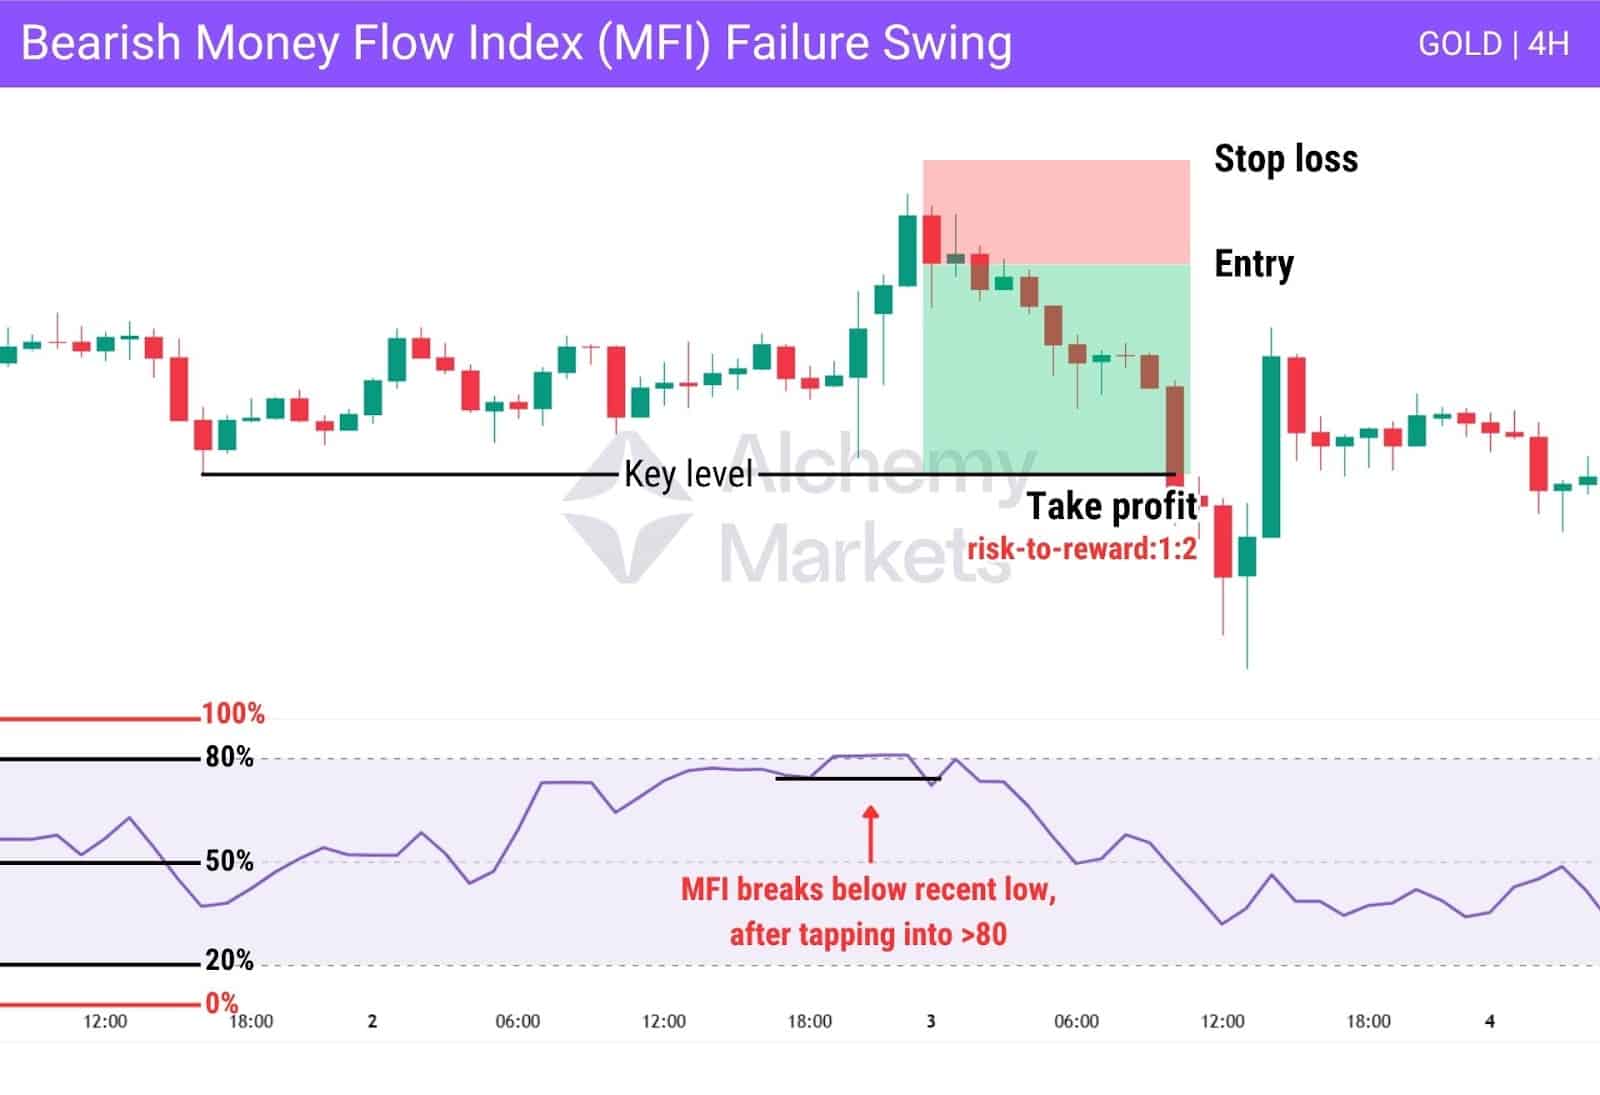
Bearish Money Flow Index (MFI) Failure Swing
The bearish version unfolds when the MFI rises above 80 (overbought), drops back below 80, forms a lower high, and then breaks beneath its previous low (the previous swing low). This indicates weakening buying pressure and increasing selling interest, often leading to downward movement.
Because this pattern plays out entirely within the MFI, it acts as a self-contained reversal signal, and is especially useful when price is extended or volume begins to decline. Traders may use it to exit long positions or initiate short trades with added confidence.
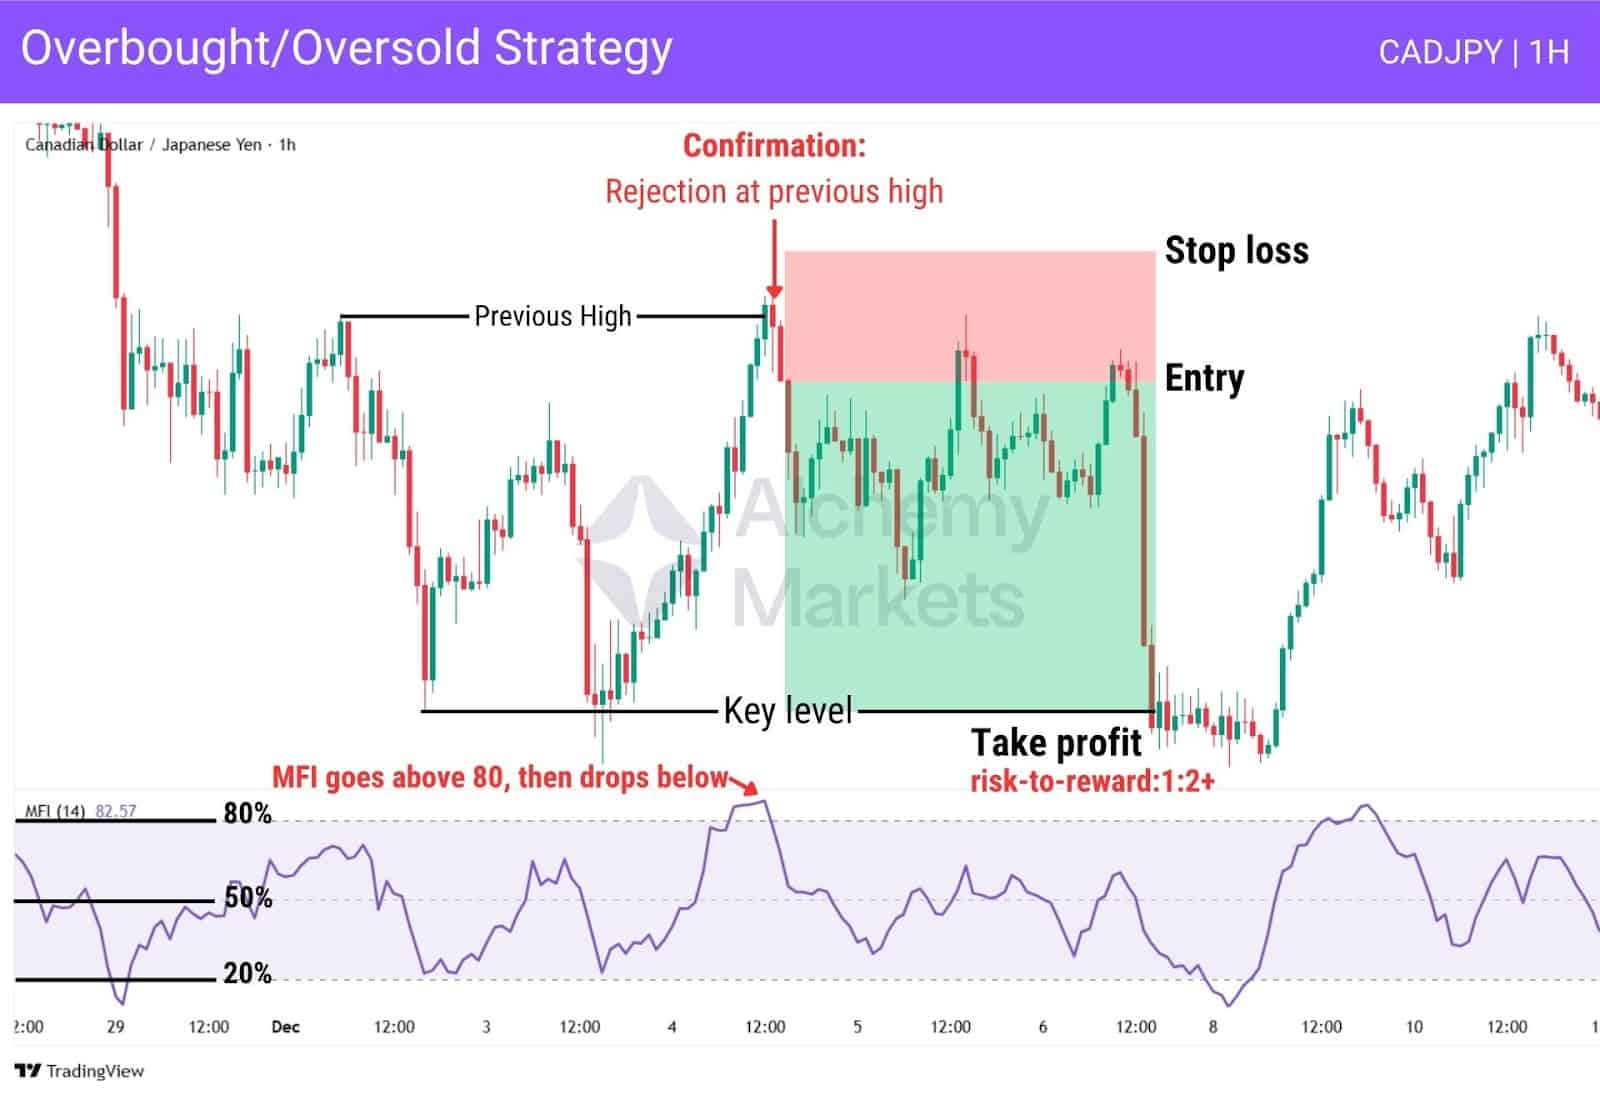
Overbought/Oversold Strategy
One of the simplest ways to use the Money Flow Index is to watch for key levels near 80 and 20. A reading above 80 signals overbought conditions, while a reading below 20 points to oversold conditions.
What matters most is the reversal from these levels:
- When the MFI reverses and drops below 80, it may indicate that buying momentum is fading and a pullback could follow.
- Conversely, when the MFI reverses and rises above 20, it can suggest recovering demand and a potential rebound.
Traders are encouraged to look for confluence with other tools such as candlestick patterns, moving averages, volume, or trend strength indicators to confirm these shifts. This strategy is particularly useful in range-bound markets where price is stuck in a range and forms multiple relatively equal highs or lows.
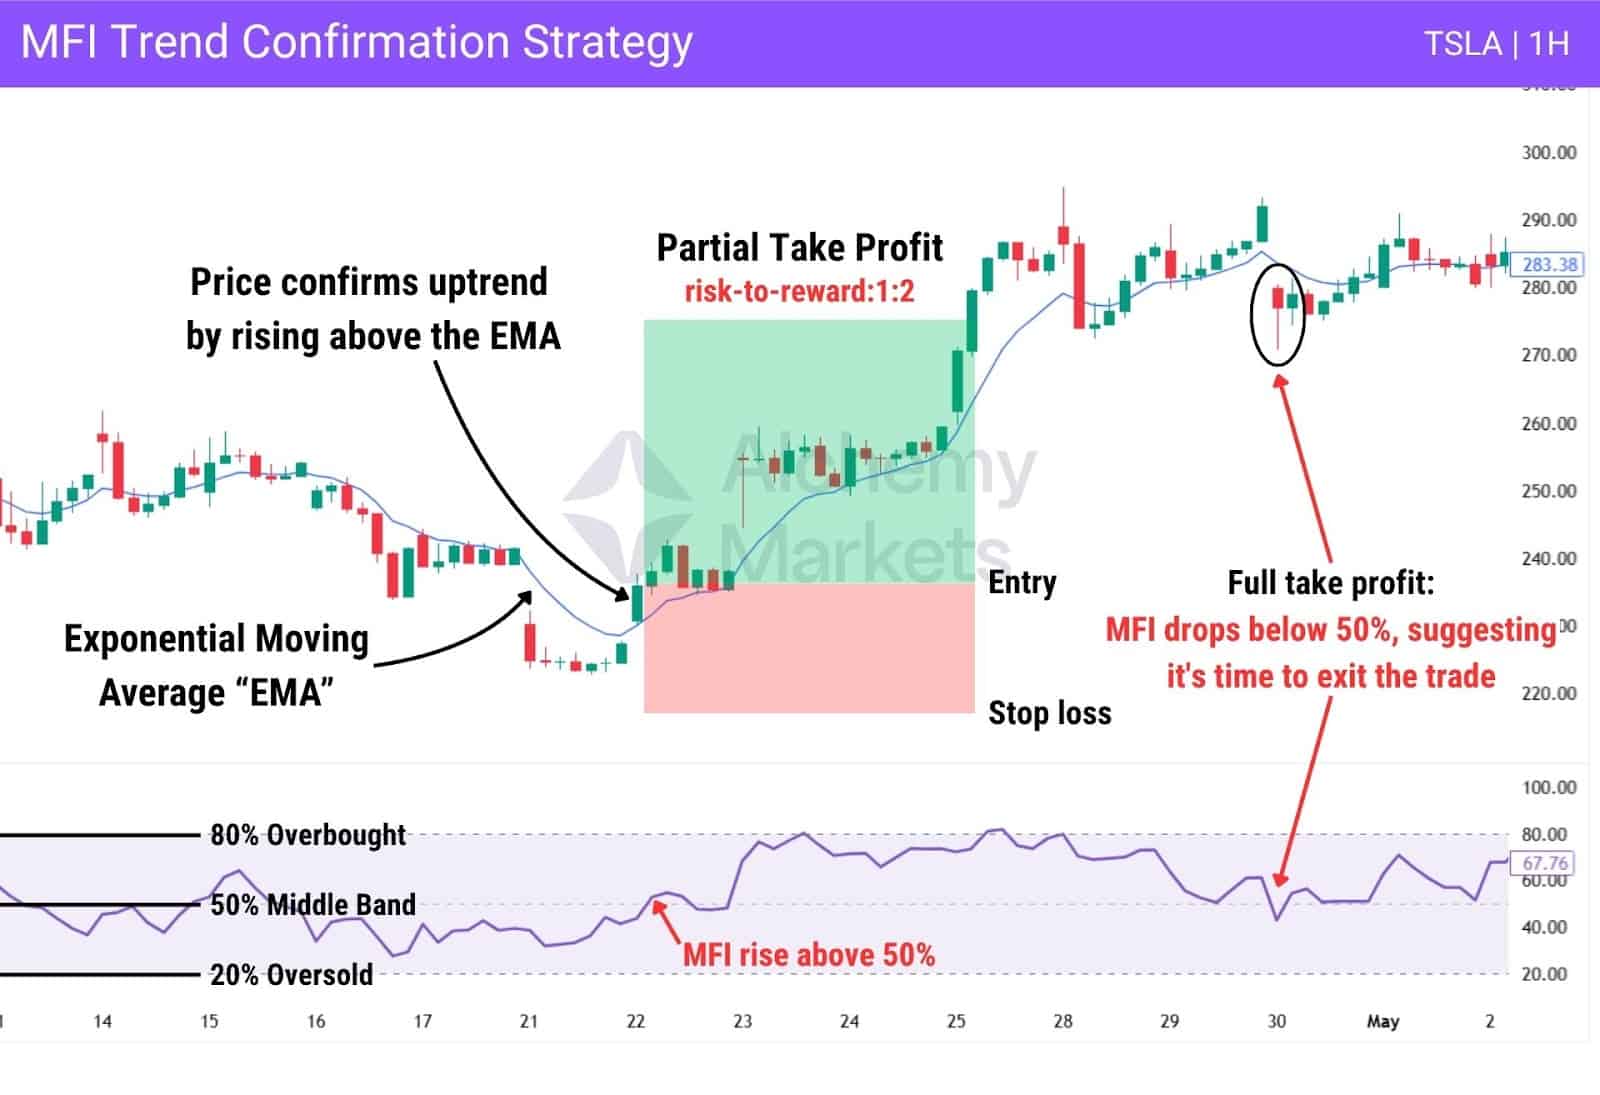
Trend Confirmation Strategy
In trending markets, the MFI can be used to validate momentum direction. If the price is rising and the MFI moves above 50, it confirms that buying pressure supports the uptrend. On the flip side, falling price action with an MFI reading below 50 reinforces bearish sentiment.
This method helps traders avoid false reversals and stay aligned with the prevailing trend. For entry and exit, traders may go long when the MFI rises above 50% during an uptrend, and consider exiting when it drops back below 50%.
Advantages of The Money Flow Index
The MFI stands out as a volume-based oscillator that offers more than just price action insights. By combining price and volume, it gives a fuller view of market activity making it a useful tool for different types of traders and trading styles. Whether you’re trading short-term moves or analysing long-term trends, the MFI can help confirm setups and improve decision-making. Below are some of the main reasons why many traders choose to use it in their strategies:
1. Combines Price and Volume
The Money Flow Index (MFI) offers several distinct advantages that make it popular among technical traders. By incorporating both price and volume, it captures the flow of capital into and out of a market, something price-only indicators often miss.
2. Detects False Breakouts and Early Reversals
This dual-input design gives the MFI an edge in identifying false breakouts, early reversals, and periods of momentum loss, particularly in volatile or thinly traded markets.
3. Highlights Overbought and Oversold Zones
Another key benefit is its ability to highlight overbought and oversold conditions, helping traders time entries and exits more effectively. When used in combination with tools such as RSI or trendlines, it enhances signal reliability and strengthens risk management decisions.
4. Versatile Across Timeframes and Markets
The MFI is also highly adaptable. It performs well across a variety of timeframes and asset classes, from equities and forex to crypto. It responds quickly to short-term shifts but remains stable enough for swing or position trades.
5. Simple and Accessible
Finally, it’s relatively easy to calculate and interpret, making it accessible for newer traders while still offering depth for advanced users who rely on volume-based strategies.
Disadvantages of The Money Flow Index
Like any indicator, the MFI has its limitations. While it can be a helpful tool, relying on it alone may lead to missed or false signals, especially in low-volume markets or during high-impact news events. It’s important to understand where the MFI falls short so you can apply it more wisely in real-world trading. Below are some key disadvantages of the MFI you should be aware of before relying on it in your trading strategy:
1. Sensitive to Volume Spikes
While powerful, the Money Flow Index isn’t without limitations. One drawback is its sensitivity to sudden spikes in volume data, which can lead to false signals, especially in assets with low liquidity. These fluctuations may distort the MFI reading, misleading traders about market conditions.
2. Lags in Fast-Moving Markets
The indicator also lags in fast-moving markets. Although it incorporates volume, it still uses past data, meaning it may react slowly to price changes during breakouts or high volatility. This makes it less suitable for high-frequency trading or scalping.
3. Can Mislead During Strong Trends
Another issue is the potential for misinterpretation in strong trends. During aggressive uptrends or downtrends, the MFI can remain in overbought or oversold levels for extended periods, causing inexperienced traders to exit positions too early.
4. Should Not Be Used Alone
Finally, the MFI is best used in conjunction with other indicators or other analysis. Relying on it alone can lead to poor decision-making, especially if volume anomalies or unusual price behaviour affect its readings. As always, context and confluence matter in effective technical setups.
Money Flow Index (MFI) vs Relative Strength Index (RSI)
The Money Flow Index (MFI) and the Relative Strength Index (RSI) are both widely used momentum indicators, but they differ in a key respect: the MFI incorporates volume, whereas the RSI is based purely on price.
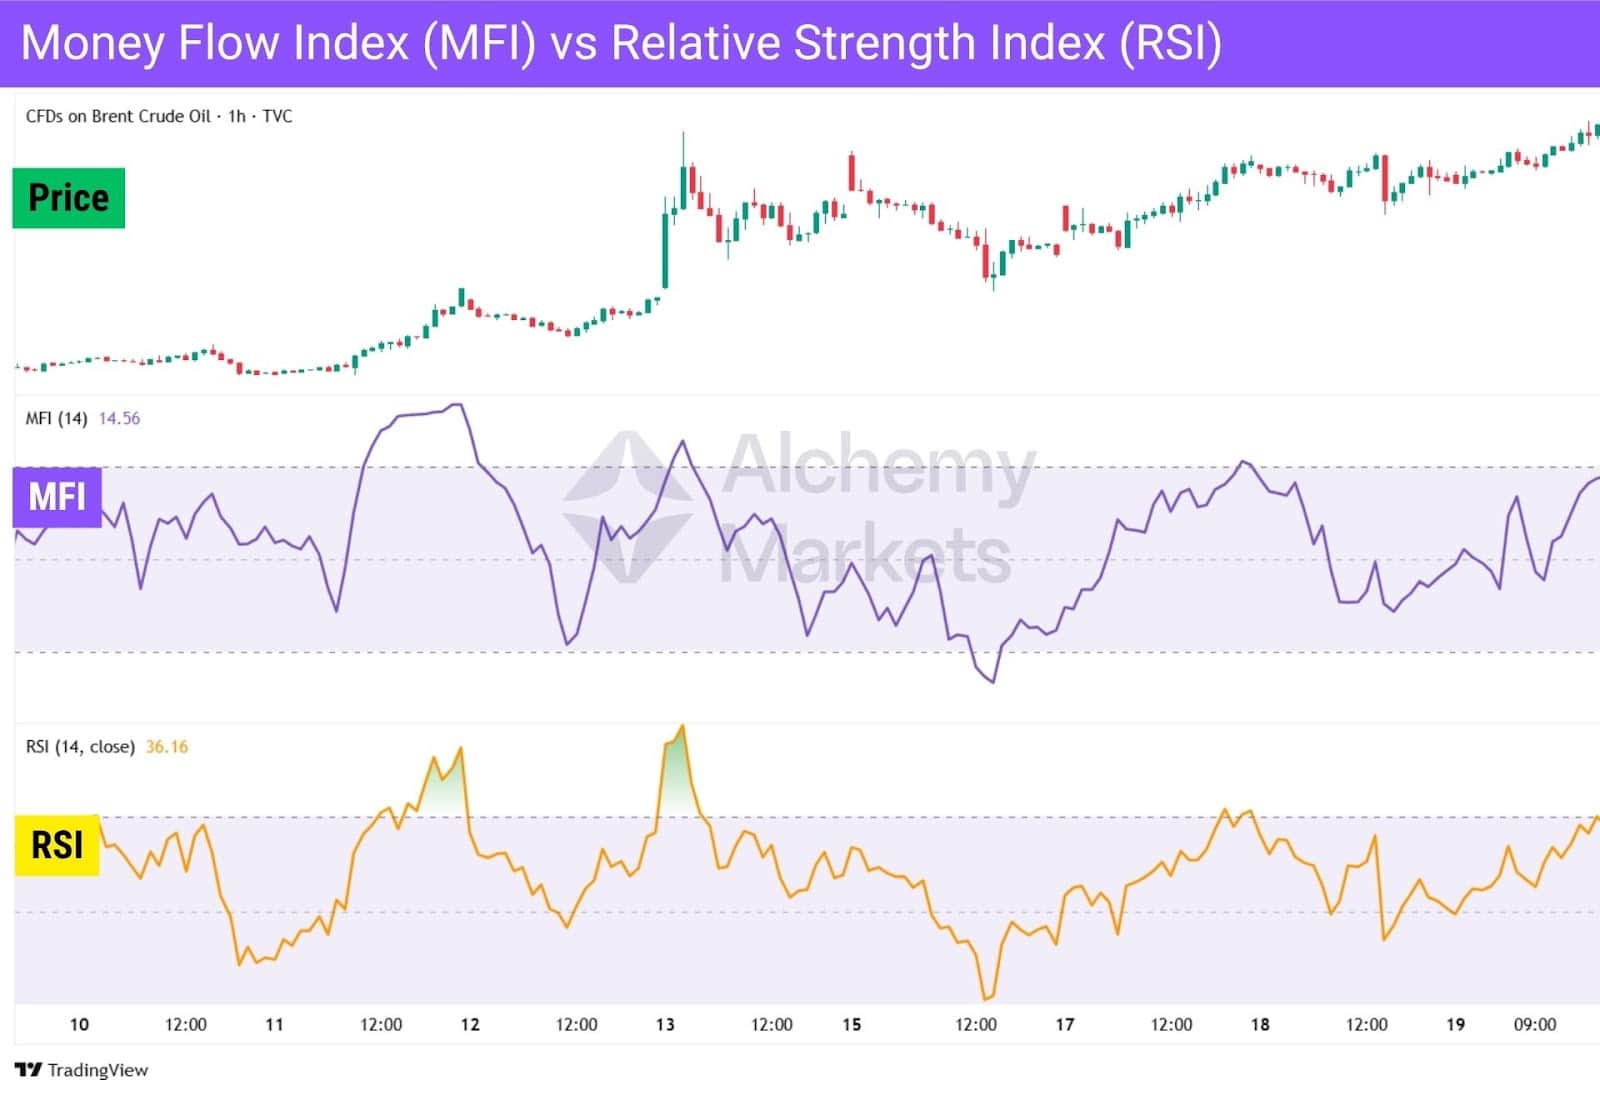
The RSI calculates momentum by measuring the relative size of recent gains versus losses over a given period, typically 14. It is effective at identifying overbought and oversold conditions, but it doesn’t account for the strength of market participation.
In contrast, the MFI starts with the typical price and multiplies it by volume to calculate raw money flow. These flows are then categorised as positive or negative, and the final index value, ranging from 0 to 100, reflects both price and volume dynamics.
Another key distinction lies in their overbought and oversold thresholds: RSI typically uses the 70/30 range, while MFI uses a wider 80/20 range, making MFI more sensitive to volume-backed extremes. This gives the MFI additional context, particularly in volatile or low-liquidity markets.
Traders often use both indicators together. When the MFI and RSI confirm each other, confidence in the signal increases. However, divergence between the two may expose hidden shifts in momentum such as volume-backed reversals not yet visible through price alone.
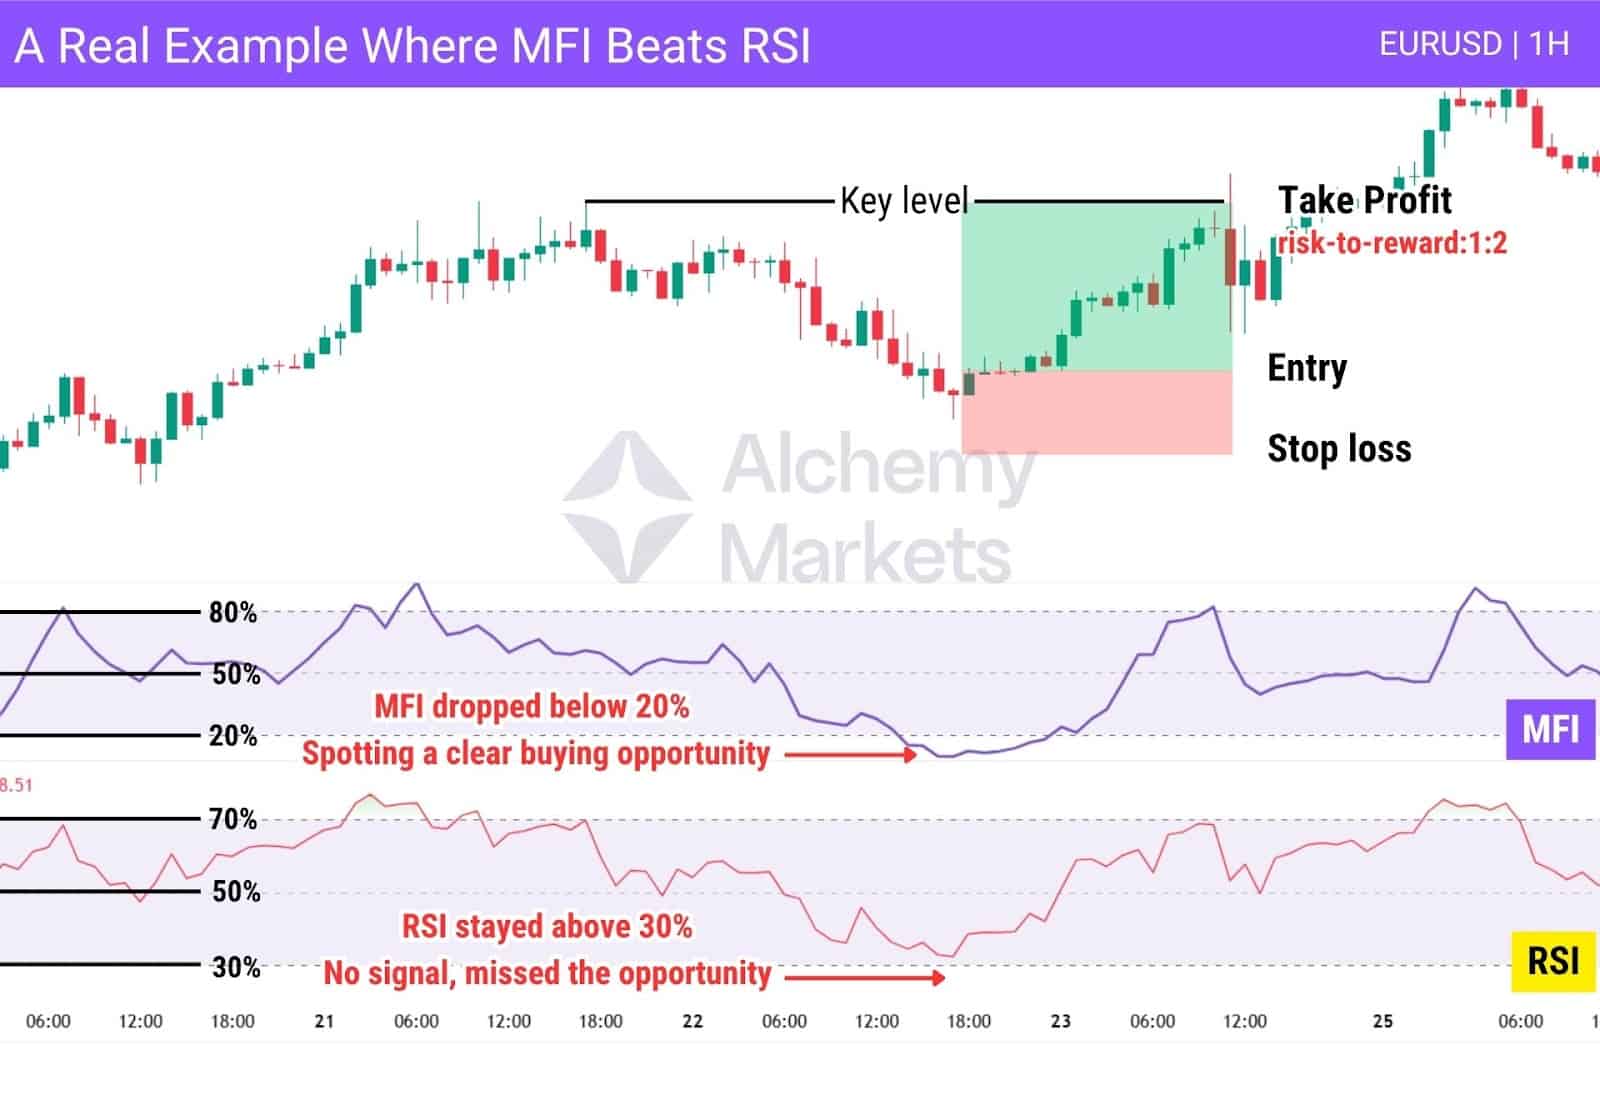
While the RSI remains a simpler and more familiar tool, the MFI is often preferred by traders who prioritise volume-based confirmation. Used together, they provide a more complete perspective on market sentiment and potential turning points. Since MFI is based on both price and volume, while RSI only considers price, relying on RSI alone can lead to missed opportunities or low-probability setups.
Chaikin Money Flow vs Money Flow Index
Money Flow Index (MFI) and Chaikin Money Flow (CMF) both track buying and selling pressure, but in different ways.
MFI multiplies the average price of a candle (called the typical price) by volume to get raw money flow, then compares inflows vs outflows over a set flow period, usually 14.
- For MFI, you’d want to look for divergence plays and overbought/oversold signals.
CMF, instead, looks at where the price closes within the candle’s range.
If it closes near the top, that’s bullish; near the bottom, bearish. This value is multiplied by volume, then summed over the flow period to show whether money is consistently flowing in or out; without being bound to a 0–100 scale like MFI.
- For CMF, see if the indicator stays above 0 = net positive money flow to validate bullish conditions.
- Alternatively, look for crossovers, where CMF crosses up from negative to positive, or vice versa.
MFI is better for short-term trades, highlighting overbought and oversold conditions. CMF fits longer-term setups, revealing steady buying or selling pressure that might signal big players quietly accumulating.
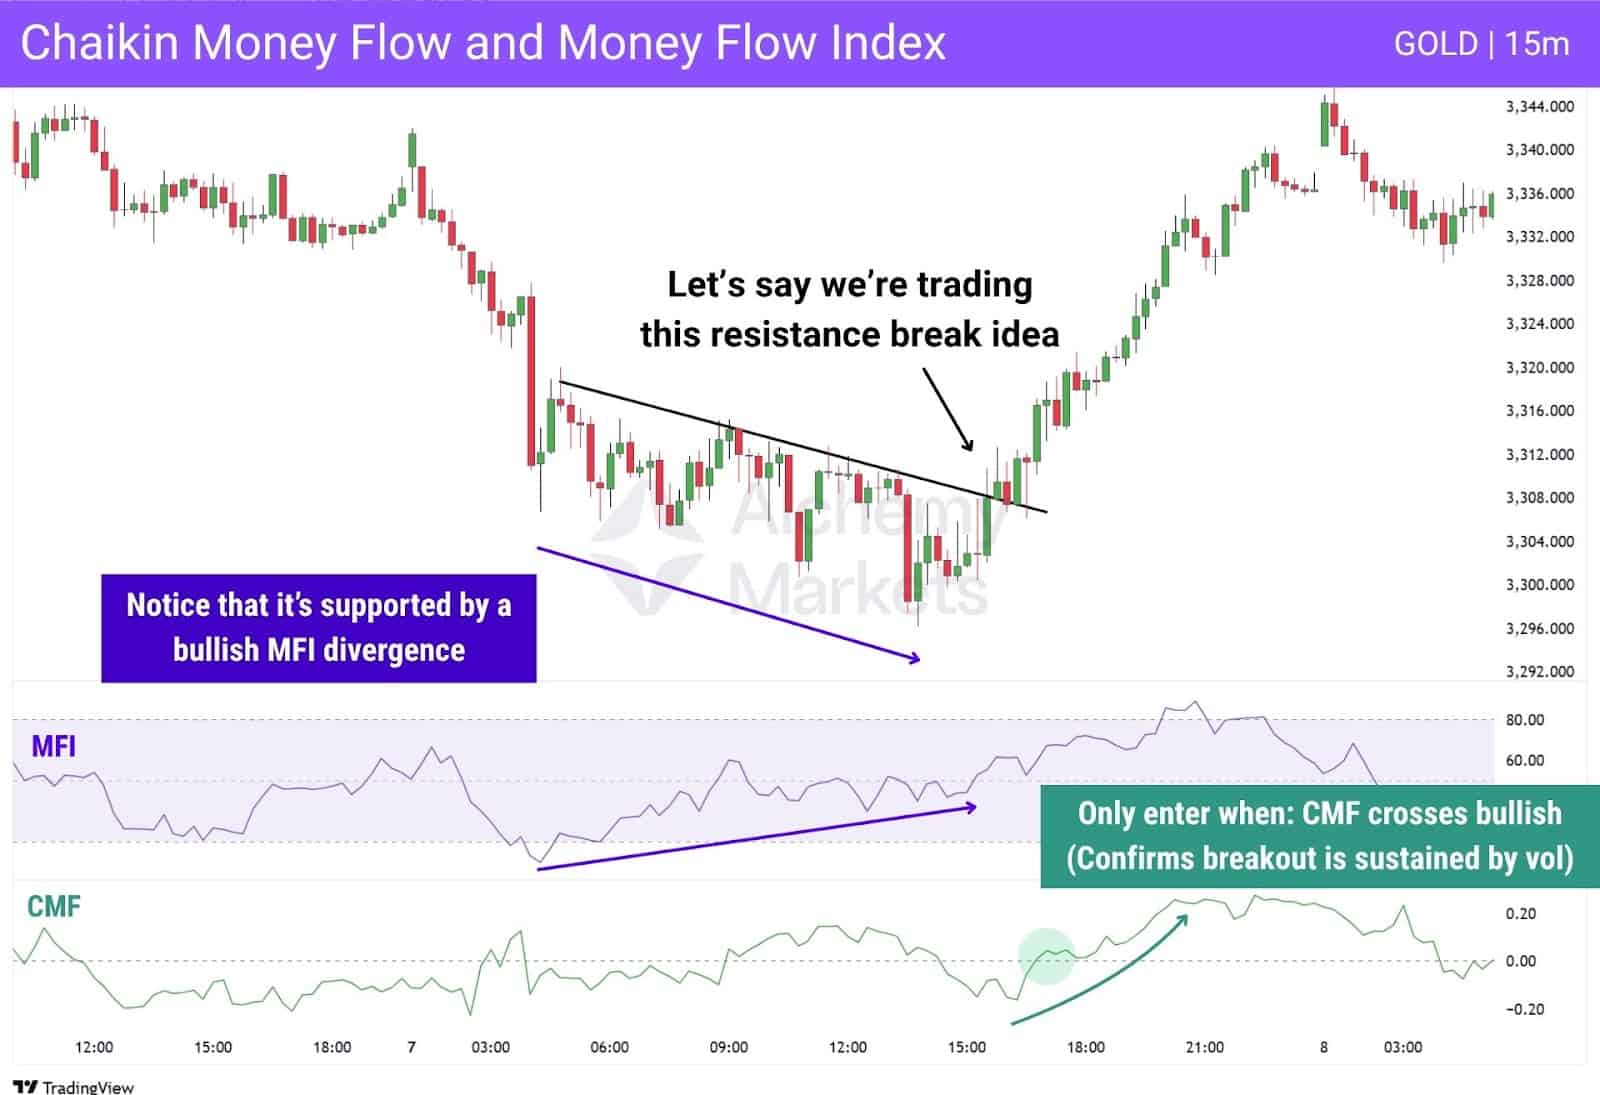
Although they are powerful indicators, both can still generate false signals. MFI tends to misfire in low-volume or sideways markets, while CMF can be skewed by large volume spikes that distort the true buying or selling pressure.
The MFI and CMF serve different purposes, and can work well together in a broader strategy.
What Common Mistakes Should Traders Avoid When Using the Money Flow Index?
One of the most frequent mistakes is treating overbought and oversold readings as automatic entry or exit signals. The MFI can remain in these zones for extended periods during strong trends, and acting too quickly may lead to poor timing.
Another pitfall is using the MFI in isolation. While it reflects the balance of buying and selling pressure, it’s most effective when paired with other tools such as support and resistance levels, candlestick patterns, or trend indicators. Relying solely on the MFI can expose traders to false signals.
Traders may also miscalculate the MFI by using incorrect input data. Errors such as omitting the proper typical price or failing to correctly classify positive and negative flows can distort the indicator and lead to unreliable readings.
Finally, one of the most overlooked elements is divergence. Failing to recognise when the MFI and price action move in opposite directions means missing one of the indicator’s most reliable early reversal signals.
Avoiding these mistakes can significantly improve the MFI’s reliability and support more disciplined risk management.
FAQs
Why should traders care about the money flow index?
The Money Flow Index (MFI) matters because it integrates both price and volume to reflect genuine market sentiment. Unlike traditional price-only indicators, the MFI helps traders identify early shifts in buying or selling pressure, making it a valuable tool for timing entries, exits, and managing risk across varying market conditions.
How accurate is the Money Flow Index for trading decisions?
The MFI is generally reliable when used alongside other indicators and sound technical analysis. Its inclusion of volume data enhances signal quality, particularly for spotting divergences or confirming trends. However, like any tool, it can produce false signals, especially in thinly traded markets or during periods of high volatility. Accuracy improves with context and confirmation.
What are the best settings for the Money Flow Index indicator?
The default 14-period setting is widely used for its balance between responsiveness and stability. Shorter settings (e.g., 7 periods) can increase sensitivity but may produce more noise, while longer settings (e.g., 21 periods) offer smoother trends. Traders should adjust the period based on asset class, strategy, and time frame ideally refining it through backtesting.
Can the Money Flow Index predict market tops and bottoms?
The Money Flow Index can highlight overbought and oversold conditions, but it does not predict precise market tops or bottoms. Instead, it offers early warning signals through divergences and failure swings, especially when combined with price action and volume analysis. It’s best used to anticipate potential reversals rather than pinpoint exact turning points.
Does the Money Flow Index work for all markets and timeframes?
Yes, the MFI is effective across a wide range of asset classes, including stocks, forex, cryptocurrencies, and commodities. It performs well on various timeframes, from intraday charts to longer-term setups. However, its accuracy may decline in low-liquidity environments or assets with inconsistent volume. Proper context and calibration improve its performance.
How often do Traders use the MFI indicator for Analysing Stock Market?
The MFI is widely used by traders who rely on technical analysis and volume-based strategies. It’s popular among intraday, swing, and position traders alike for its ability to confirm trends and detect shifts in buying or selling pressure. Its appeal lies in merging momentum signals with volume data, offering a more complete picture of market sentiment.
Is MFI a leading or lagging indicator?
The Money Flow Index is considered a leading indicator because it aims to forecast potential price movements before they happen. By analysing changes in money flow relative to price action, it can detect shifts in momentum early. Still, it should be used with other tools to confirm signals and reduce false positives.
Is MFI a volume flow indicator?
Yes, the MFI is a volume flow indicator that measures the movement of capital into and out of a security. It calculates positive and negative money flow using both the typical price and volume, making it effective for gauging real-time buying and selling pressure, essential for accurate market analysis.
Is a higher MFI good or bad?
A higher MFI generally indicates strong buying pressure, which can support bullish trends. However, if the reading exceeds 80, it may signal overbought conditions and a possible pullback. Whether it’s favourable depends on your strategy and market context, whether you’re entering, holding, or planning to exit a position.
Is a lower MFI good or bad?
A lower MFI typically reflects growing selling pressure. While that might appear negative, values below 20 may signal oversold conditions and highlight potential buying opportunities. Interpretation always depends on trend strength, broader market conditions, and supporting indicators.
How reliable is Money Flow Index?
The MFI is considered relatively reliable particularly for identifying divergences, failure swings, and overbought/oversold levels. Its inclusion of volume data gives it an advantage over price-only indicators. That said, no tool is perfect. Its effectiveness improves when used with other indicators and within the correct market context.
What are the origins of Money Flow Index?
The MFI was developed by Gene Quong and Avrum Soudack in the early 1990s as an evolution of the Relative Strength Index (RSI). By incorporating volume into RSI’s price-based framework, they created a more complete indicator for analysing buying and selling pressure. It remains widely used in modern technical analysis.


