


Written by:

Reviewed by:

- June 28, 2024
- 25 min read
Exponential Moving Average (EMA): Mastering Market Trends
Are you trying to decode the market’s trends, hidden support and resistances, and gain more insights into where to take your trades? This powerful trading tool is commonly used by traders and trading bots alike. Explore the Exponential Moving Average (EMA) in this article, and learn how to trade with it.
Key Takeaways
- The Exponential Moving Average (EMA) is a trend-following technical indicator that reacts quickly to recent price changes.
- EMAs calculate the average price of an asset across an adjustable, set period of time.
- While EMAs are advantageous for their responsiveness to price action, they are lagging indicators that may produce false signals during volatility, which necessitates combining them with other technical indicators to enhance trading accuracy.
What is the Exponential Moving Average (EMA)
The Exponential Moving Average, or EMA, is a tool used by traders to identify trend direction, entry, and exit points of a trade by displaying areas of value, and market sentiment change.
As its name suggests, the exponential moving average shows the average price of an asset, calculated across a set period of time. This set period of time can be adjusted by the trader, allowing them to discover the average price across 9 candlesticks, or even 50 candlesticks. In essence, exponential moving averages smooth price data, forming a trend-following technical indicator that defines the current direction with a lag.
You can use more than one exponential moving average at once, which helps you discover which EMA length the asset you’re trading is currently respecting.
This can provide long or short signals when the price bounces or rejects from the EMA!
Unlike other moving average indicators, the EMA is different in that it more closely follows the recent price action, allowing the line to adapt faster to recent changes. This makes the EMA a fantastic tool for day traders, while still being highly valuable for swing traders as well!
The EMA can also indicate market sentiment, making it a highly versatile and beloved tool by traders.
What Does Exponential Moving Average (EMA) Indicate?
The Exponential Moving Average (EMA) helps traders identify potential areas for a reversal, and also provides insights on the market trend. However, keep in mind that moving averages do not predict price direction, but help report back visibly on the chart what the current trend is.
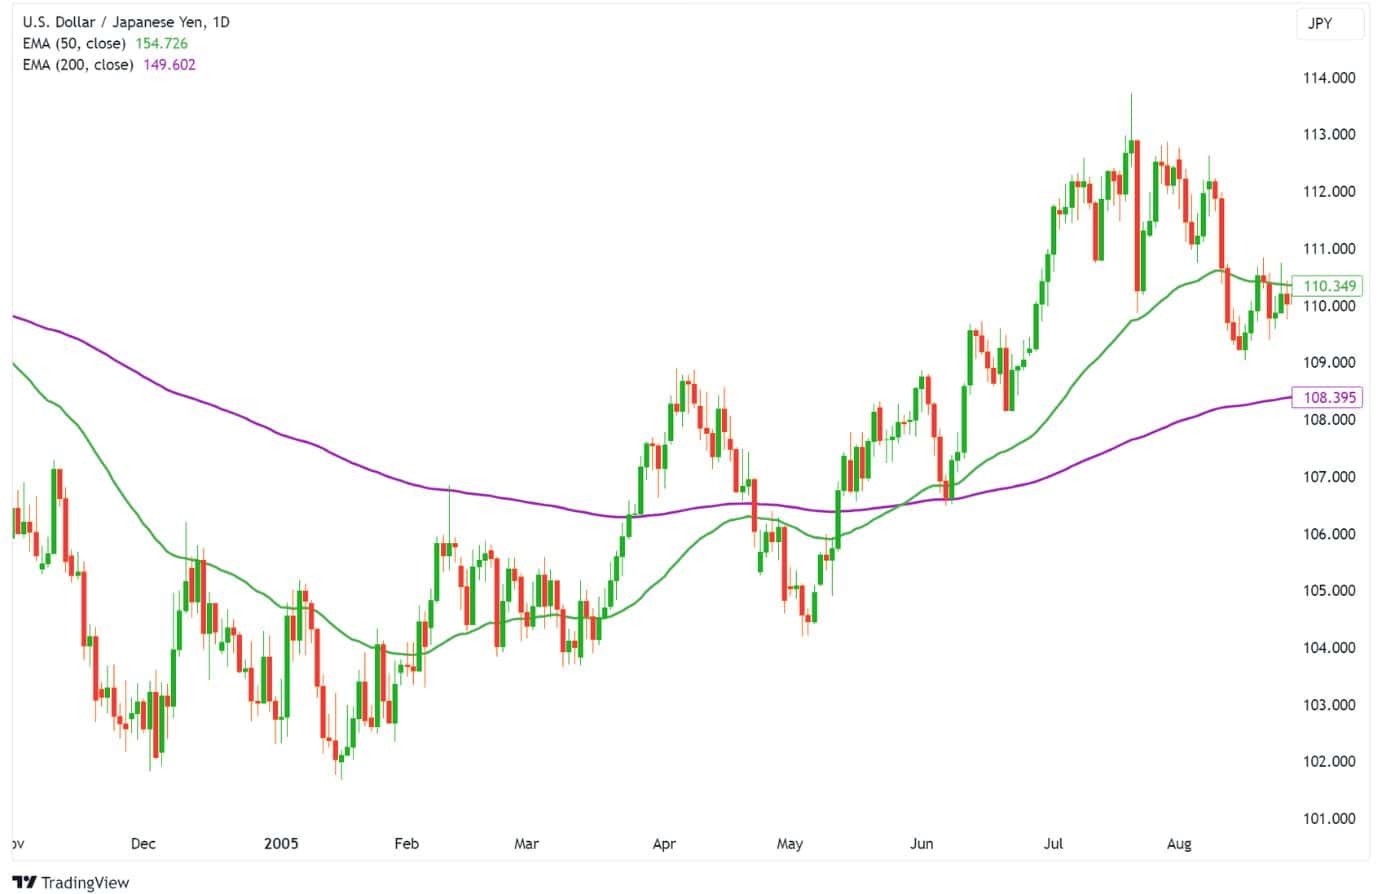
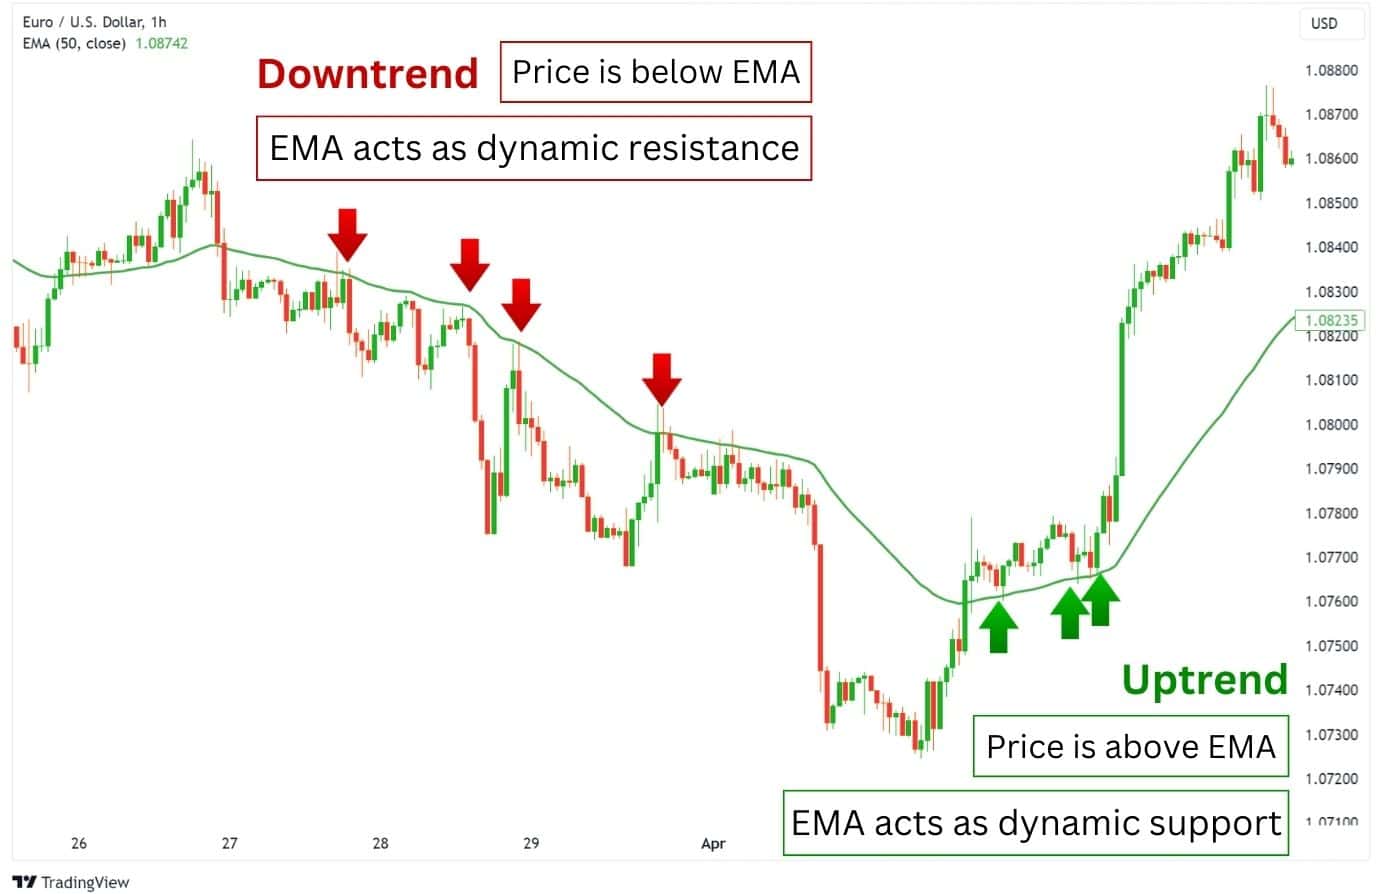
When the EMA slopes upwards and price action remains above it, this indicates an uptrend, with the EMA providing a level of support. Conversely, during downtrends, the price typically stays below the EMA, which then acts as resistance.
These characteristics make the EMA a versatile tool, aiding traders in identifying potential entry and exit points and understanding the current market trajectory—up for bullish momentum, down for bearish.
The Exponential Moving Average (EMA) Formula
As one of the key tools in a trader’s toolbox, understanding the EMA, starts with its formula. The EMA is calculated using a specific formula, which involves a smoothing factor and the EMA from the previous day.
This calculation of the EMA is:

- W is the weight multiplier (or smoothing factor), computed as 2/(N+1)
- N is the number of periods
The crucial part of this formula is the weight multiplier. This multiplier amplifies the difference between the closing price and the previous EMA, giving more prominence, or weight to the recent data.
For instance, a 200-day EMA has a smoothing factor, or weight multiplier, of 0.0099 [2/(200+1)] representing the weighted impact on the most recent price. The lower N is, the more weight the EMA places on the current price. This formula is the magic behind the EMA’s responsiveness to recent price changes as it smooths price data effectively making it a preferred tool for traders.
Calculating the EMA
As you may have noticed, the EMA calculation presents a “Chicken and Egg” issue – to get the current EMA, you need the previous EMA, which subsequently needs the previous EMA.
This is why all EMA calculations begin with a simple moving average (SMA) as the starting point, where the sum of all closing prices are simply divided by the calculation period.
SMA = (Sum of Closing Prices in N) / Number of Period
- Where N is the number of calculated periods
Using the SMA as the previous EMA, the EMA can now be calculated with the formula:

This process is then repeated for the subsequent EMA calculations, which creates a smooth price action line that runs through the price chart.
Importance of Exponential Moving Average (EMA) in Technical Analysis
Many traders utilise the EMA to determine the market’s trend direction. This helps filter out which side of the trade to take (buy or sell), and often serves as an extra level of confirmation.
Usually, the EMA tells us the trend direction following these rules:
- When the price is above the EMA, it is in an uptrend.
- When the price is below the EMA, it is in a downtrend.
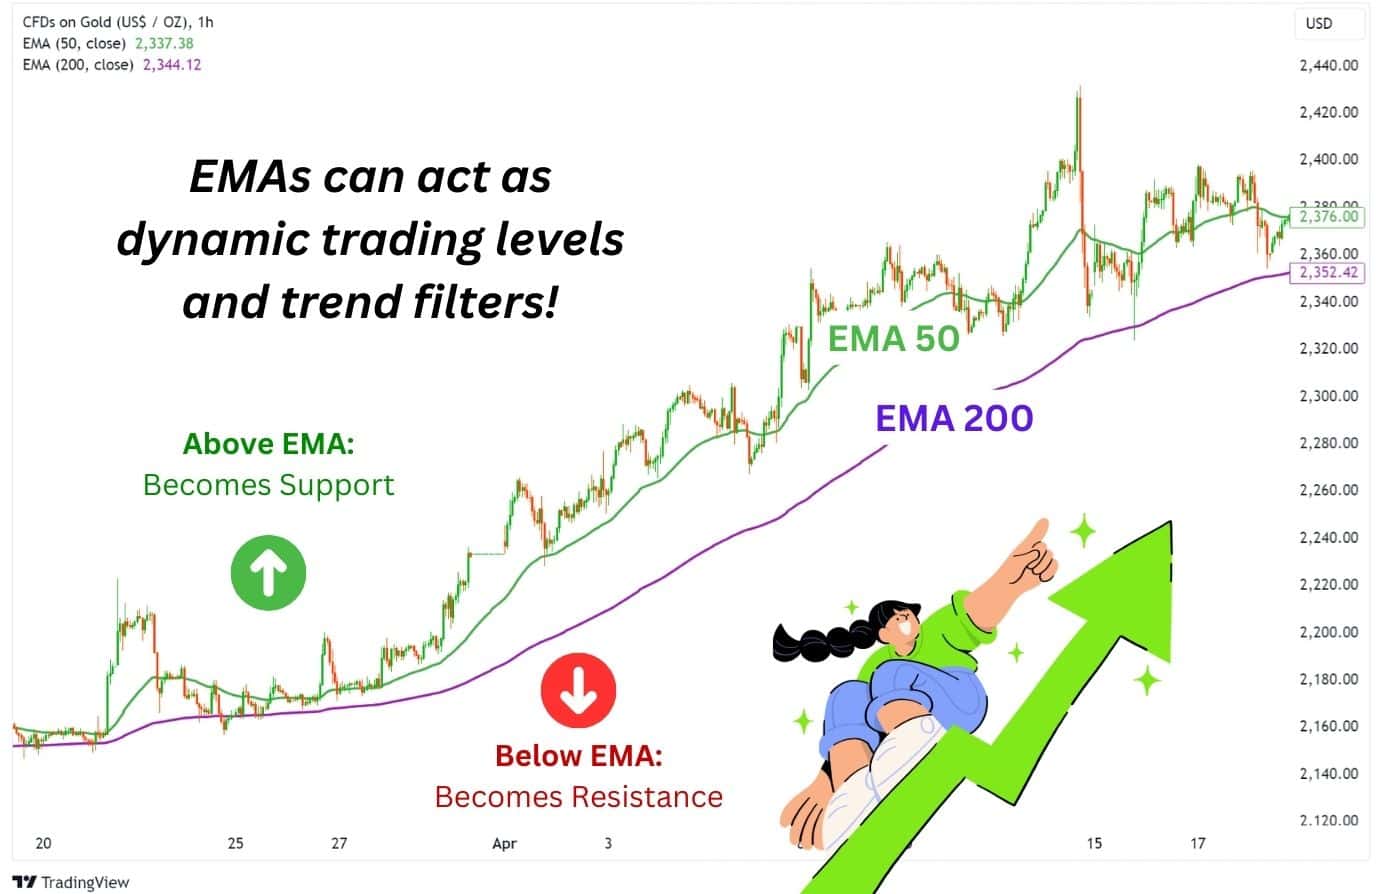
The EMA acts as a dynamic support and resistance line, which can cause the price of an asset to react. As such, many algorithms (trading bots) are coded to trade whenever the price reacts at an EMA.
Last but not least, the EMA acts as an integral part of many other indicator’s calculations. For example, the MACD calculates the difference between a slow and fast-moving EMA, which forms the MACD line.
Whether it’s by traders or algorithms, the EMA is widely recognised as a versatile and effective indicator.
Exponential Moving Average Example
Using EMAs in practice will require some nuance. It is not as simple as “Go long whenever the price is above the EMA”. If it were that simple, everyone would quit their jobs and become a trader.
Instead, the EMA needs to be used in conjunction with your understanding of market structures and price action. To illustrate how EMA works in practice, let’s consider this GBPUSD chart from 2020 – 2021.
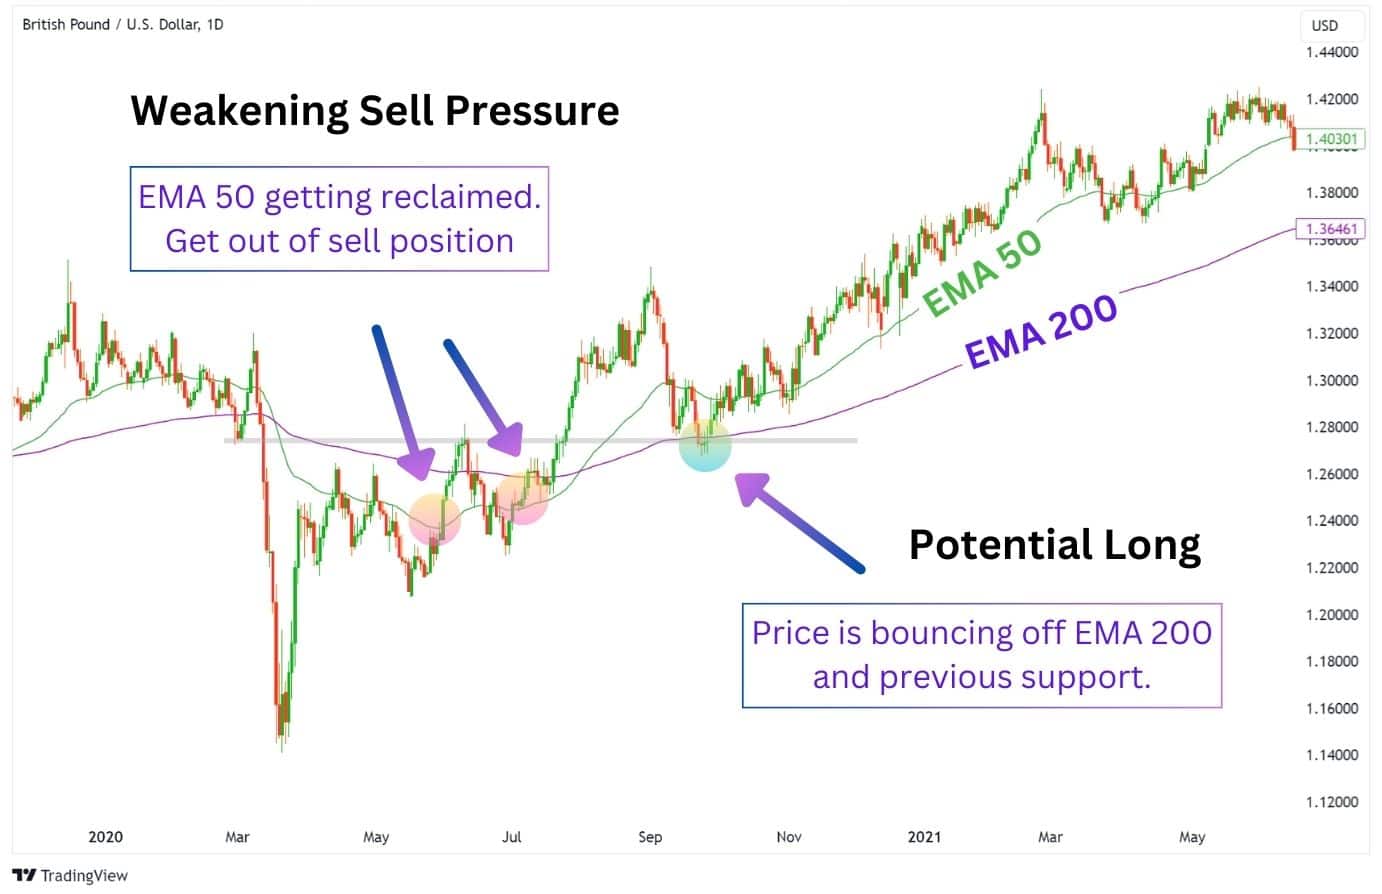
In March 2020, we see that GBPUSD has broken down from $1.32 to $1.15, breaking past the daily EMA 50 and EMA 200. This now suggests that GBPUSD is bearish, and the EMAs should start acting as dynamic resistances.
However, notice how the price repeatedly attacks the daily EMA 50 and does not see a sign of major rejection. This is our first clue that the selling pressure may be weakening. Next, the price begins to chop above and below the daily EMA 50 and daily EMA 200, creating a moment of indecision in the market. This is our second clue that the market could potentially be reversing, as the EMAs are not being respected as support or resistance levels.
Eventually, we see the daily EMA 50 reclaimed and held as support. This is another clue that selling pressure is waning. The price finally breaks out and provides us with a potential long opportunity on its retrace to the multi confluence zone, where the daily EMA 200 and previous pivot high are overlapped.
From here, we can see GBPUSD grind up to new highs, transitioning over to using the daily EMA 50 as a dynamic support level.
Strategies with the Exponential Moving Average

Once you’ve grasped the concept of EMA and its role in identifying market trends, it’s time to delve into how it can be incorporated into effective trading strategies.
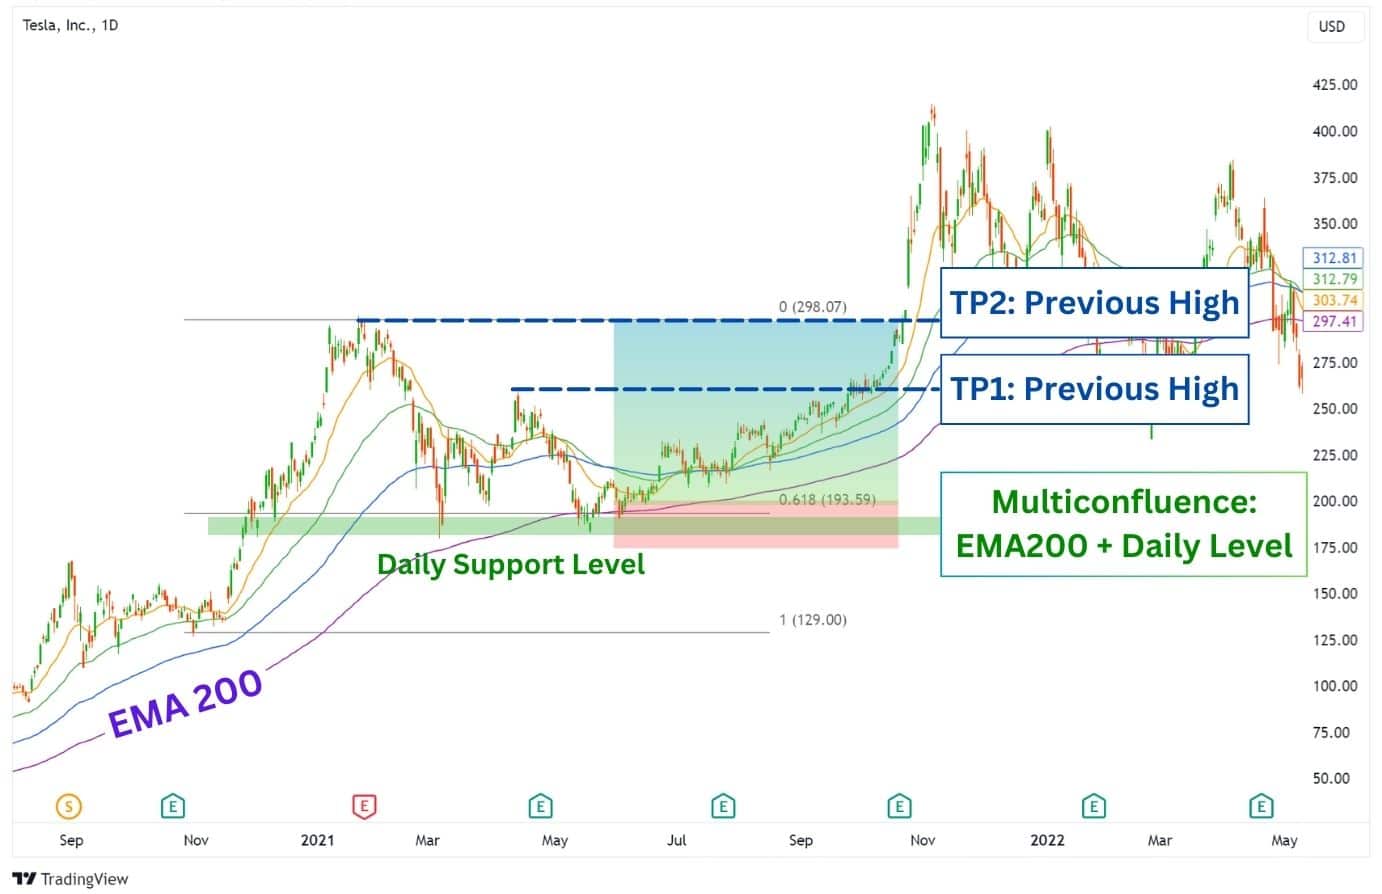
Reversal Trade Strategy: Finding Multi Confluence Zones with EMAs
This strategy aims to identify areas in the price chart with a high likelihood for a reversal, which usually has a group of support or resistance factors concentrated together. These areas provide a higher likelihood for a price reaction, making it a valuable zone to observe for a reversal trade opportunity.
While this strategy may not be as precise in capturing the exact turning point of the price, it offers a clear guideline for where traders should consider taking an entry.
Here’s how it works:
- Turn on EMA 20, EMA 50, EMA 100, and EMA 200.
- Look for a multi confluence zone, where the EMA lines up with the horizontal support and resistance levels.
- Optional: Add other confluence factors such as a Fibonacci retracement. If the asset is in an uptrend, draw from the lows to the highs and pay attention to the 0.382, 0.5, 0.618, 0.768 levels. Draw from the highs to the lows if the price is in a downtrend.
- Enter a long or short trade if a favoured candle close is observed at these levels.
- At support, look for a bullish candle close.
- At resistance, look for a bearish candle close.
- Note that if the price loses the EMA in an uptrend, but manages to close above with a wick, this would also be a valid signal for a long entry.
For your stop loss (SL), you’d want to place it below the multi confluence zone with a little bit of room. For your take profit (TP) target, set it at the next few horizontal resistance levels. This can be layered to ensure that your trade is profitable, even if further targets are not reached.
Alternatively, you can set the stop loss and take profit with the Average True Range indicator.
The effectiveness of this strategy will depend on whether the asset you’re trading tends to respect the EMAs you’re using.
Trend Chasing Strategy: Long the EMA in an Uptrend, Short in a Downtrend
If you missed out on a reversal trade, you can enter a less optimal position using a trend-chasing strategy. In some cases, this strategy can even help you enter a position that wasn’t initially obvious.
Here’s how it works:
- Turn on EMA 20, EMA 50, EMA 100, and EMA 200 on your chart.
- Find an asset in a trending environment.
- Uptrend: Price is forming higher highs and higher lows.
- Downtrend: Price is forming lower lows and lower highs.
- The EMAs are expanding and separating from each other indicating that the trend is gaining momentum.
- When the price retests the EMA, you may enter a buy/sell position. The longer the EMA length, the stronger the bounce or rejection may be.
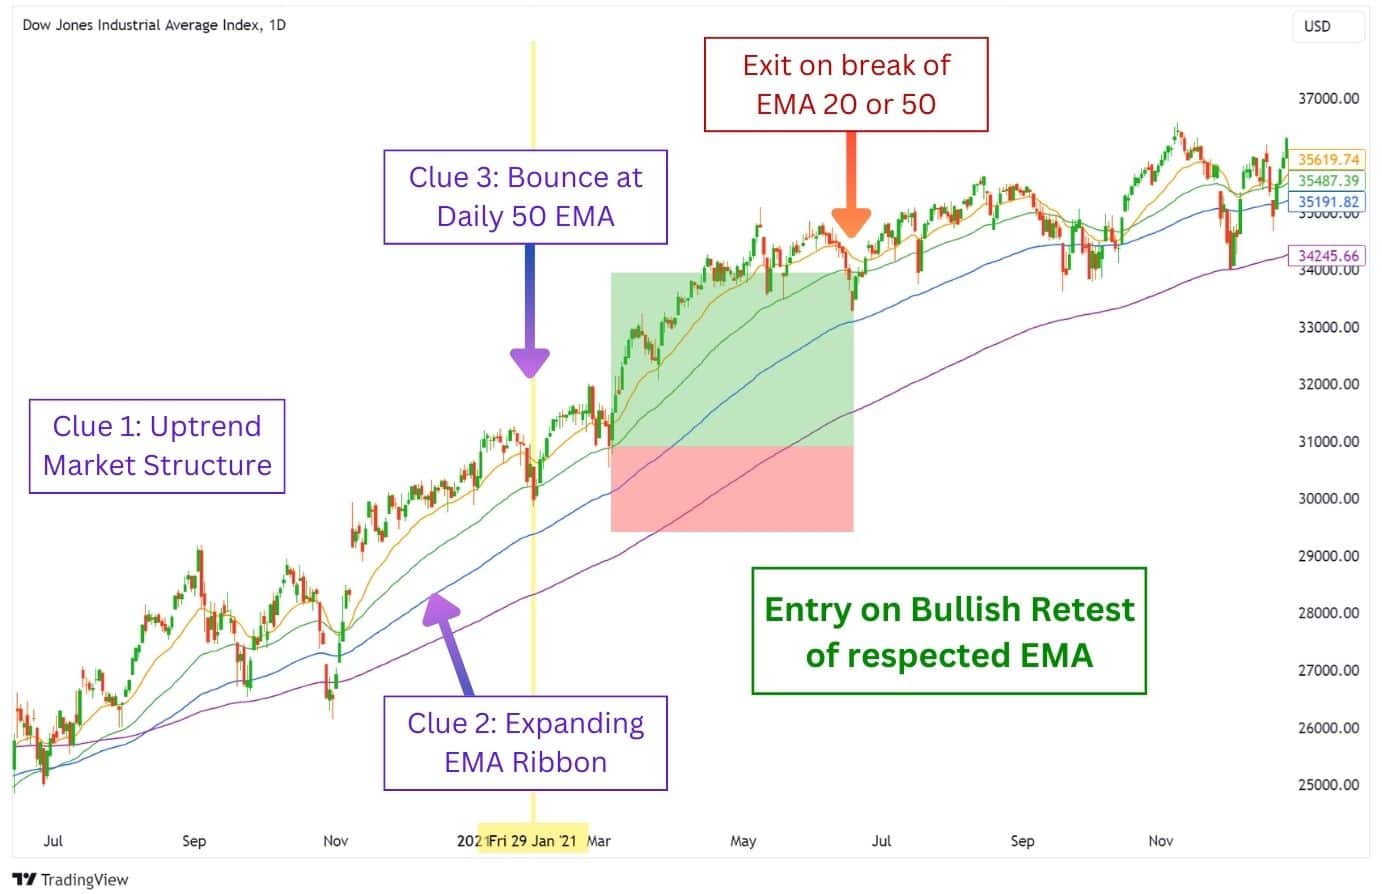
In the Dow Jones example, the price is grinding up in an uptrend. As the EMAs expand and distance themselves from each other, we get an indication that the uptrend’s momentum is picking up. Then, as the final clue, we see the price bounce off the daily EMA 50, giving us a clear indication that the asset will respect this particular EMA.
At the next successful retest of the daily EMA 50, we can enter a long trade. Using the EMAs as a guide for the trend’s strength, we can take profit when the price breaks the EMA 20, or EMA 50.
For the stop loss, place it below the next longer EMA. Alternatively, you can set a trailing stop loss with the Chandelier Exit indicator.
Optimise Your Strategy: Combining Divergences with Your Entries
To make the two strategies above more optimal, we recommend using an indicator that can show divergences. Divergences can indicate an incoming reversal, which can help with capturing the end of a downtrend or uptrend.
Here’s an example on Nasdaq 100 Futures (NQ1), alternatively USTEC on Alchemy Markets.
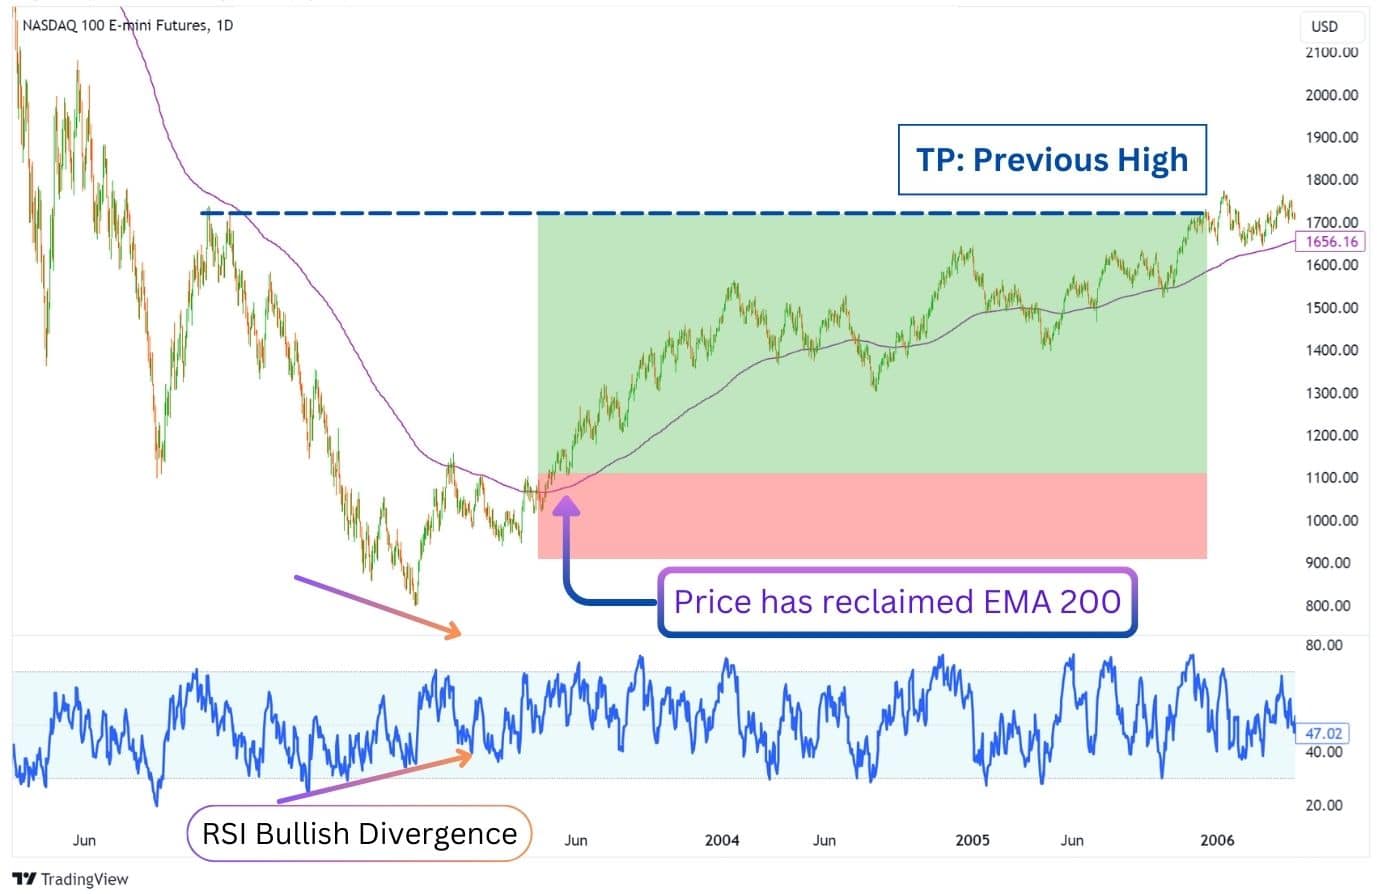
As observed, we enter a long trade on the reclaim of the EMA 200. This idea is assisted by a bullish RSI divergence formed earlier, which can be seen when price forms a lower low, and the relative strength index (RSI) indicator forms a higher low.
Divergences signal a reversal, and with the EMA acting as our guide, the trade has a higher possibility of playing out. You can find divergences through “Oscillator” type indicators such as the RSI, Stochastics, MFI, and MACD.
Not That Great: Trading EMA Crosses
A common trading strategy you’ll see many people share online is the EMA Cross strategy. However, this is not the most effective strategy to use.
In this strategy, you use at least two EMAs and look for moments where they’ll cross. This ‘cross’ serves as a buy/sell signal.
- Golden Cross: When the shorter EMA crosses above the longer EMA, markets have shifted bullish and we can enter a long trade.
- Death Cross: When the shorter EMA crosses below the longer EMA, enter a short trade, markets have shifted and we can enter a short trade.
The problem with this strategy is that the signals are lagged. The markets are likely to have already moved significantly before the cross signal, which means you’d be late to the party.
Here’s an example of the EMA cross in action:
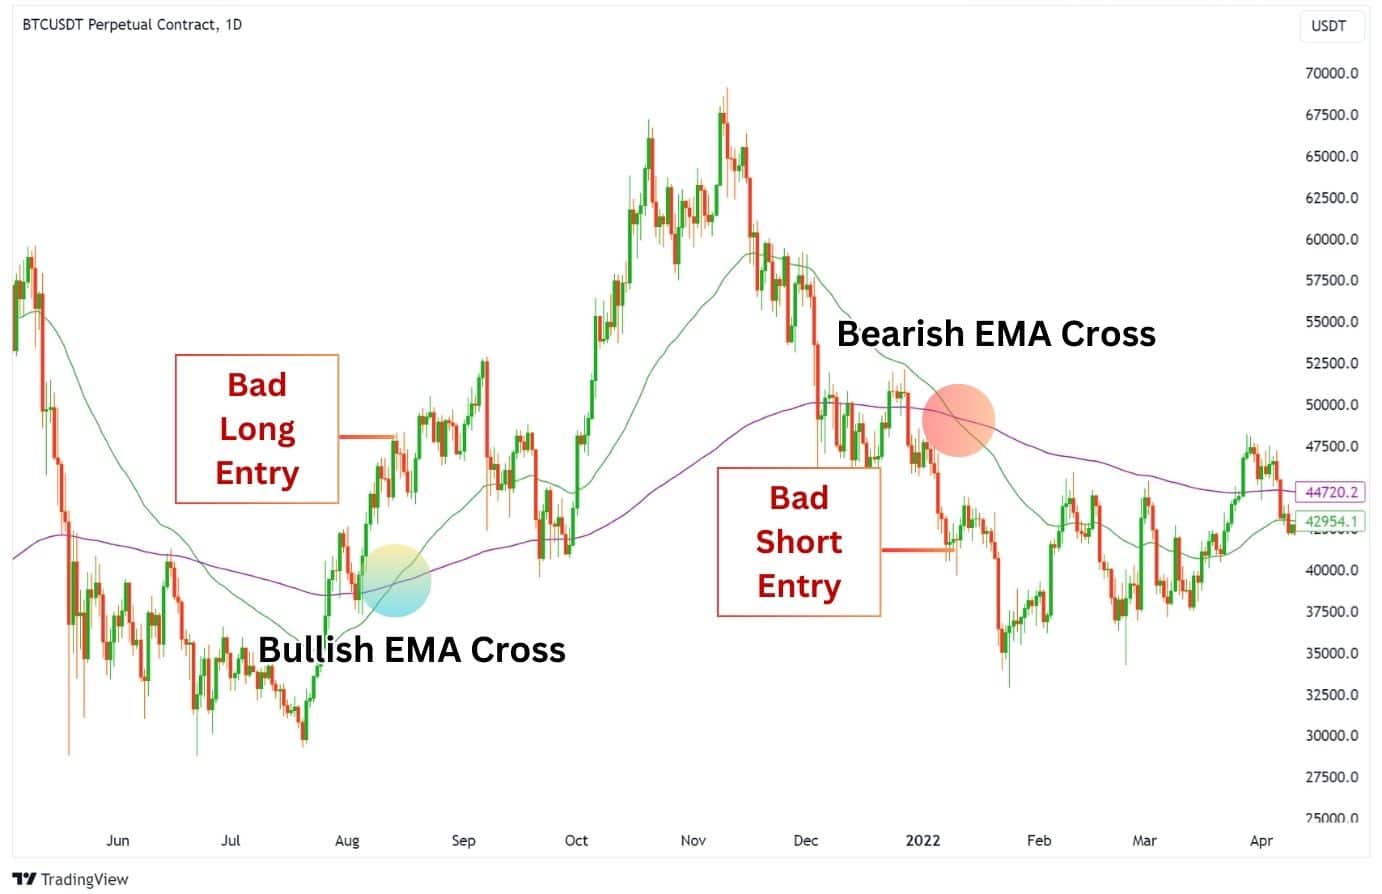
As you can see, the EMA cross produces a lagged signal, giving you a poor entry. Furthermore, they may trick you into believing that markets are going to reverse for sure now, leading you into a trap.
Therefore, it’s less accurate than simply using an understanding of the market structure. The moving average crossover strategy would work best when the market is an very strong directional trend for a long time.
If that were the case, a trader with knowledge of market structure could more easily and timely determine the market’s trend and not need the moving average crossover. For example, when the price is forming higher highs and higher lows or when the price is forming a pattern, that structural analysis will offer more timely analysis and signals of the market’s trend than a moving average cross.
Using the EMA: Moving Average Ribbons
While using individual EMAs can provide valuable insights, imagine the power of using multiple EMAs simultaneously. By plotting at least 4 EMAs onto a price chart, traders can easily visualise the short, medium, and long trends.
Additionally, whenever the ribbons are contracted, this implies that the prices are in a range and consolidating. Conversely, when the EA ribbon expands, it means that momentum is increasing. The bigger the expansion, the more powerful the trend is.
Anatomy of Moving Average Ribbons
A moving average ribbon involves plotting several moving averages of different lengths on a chart.
The shorter length moving averages represent a shorter-term trend. Because of this, the shorter EMAs will appear closer to the actual market prices, almost sort of hugging the price as it rises or falls. Meanwhile, the longer EMA will usually have a bit of room from the current price, indicating the longer-term trend.
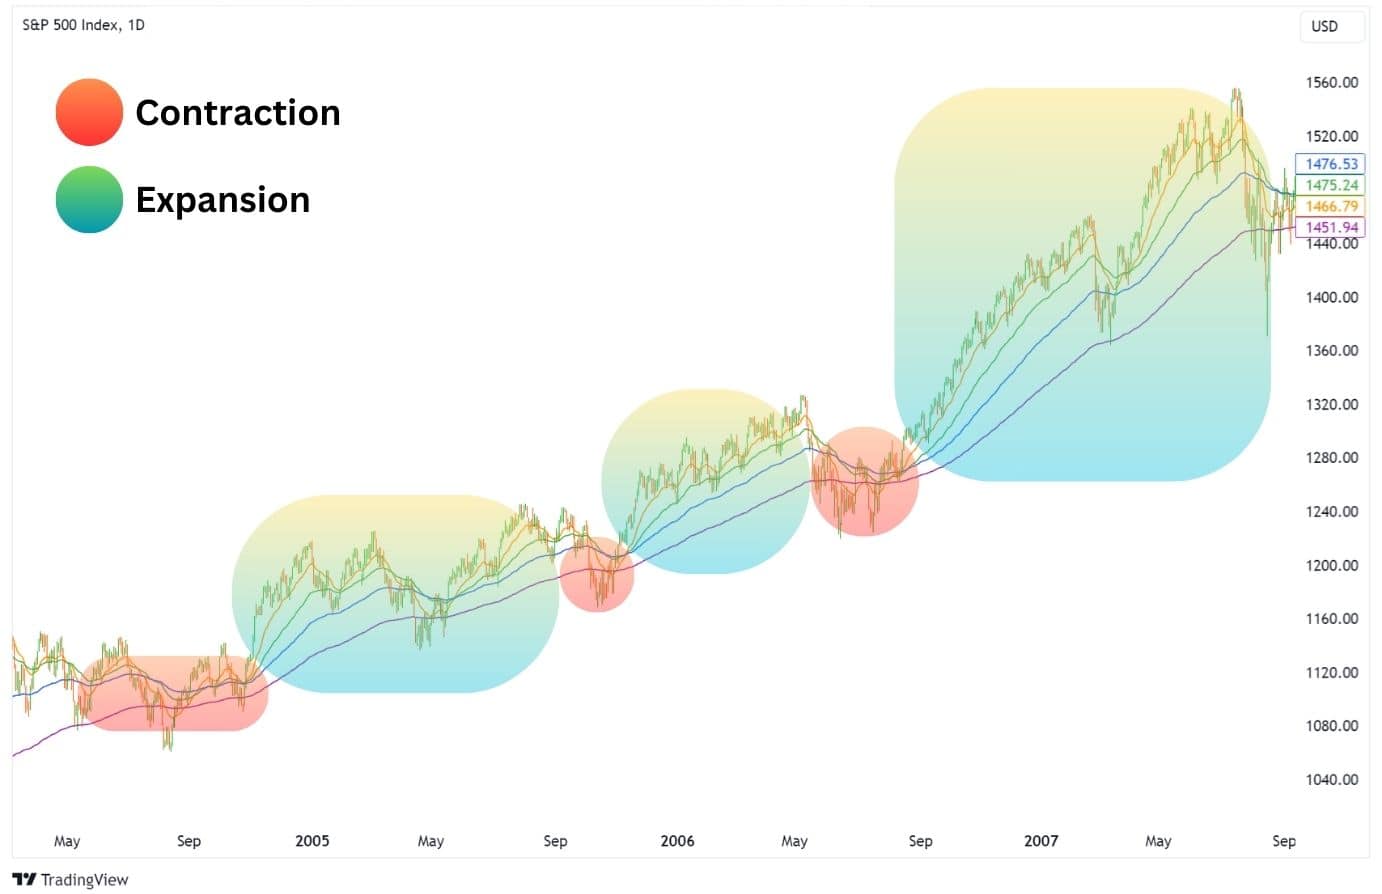
When the ribbon folds and the EMAs converge into one close point, the trend strength is weakening and possibly reversing. If the ribbon is fanning out and the distance between the moving averages are expanding, then the trend strength is likely increasing.
As a result, a contraction of distance between the moving averages is considered a weakening trend while and expansion of the distance is considered a strengthening trend. Therefore, this ribbon gives traders a visual representation of the market’s mood, helping them make more informed decisions.
How Do You Identify a Trend Using Exponential Moving Averages?
When the EMA is rising (sloped upwards), it suggests an uptrend. Conversely, when it’s falling (sloped downwards), it indicates a downtrend. You can also judge the market trend by the price’s location about the EMA. When the price is above an EMA, the asset is bullish. When it’s below, it’s bearish.
It’s important to take the EMA lengths into account as a price can be simultaneously bullish in the short term (above the short EMA), and bearish in the longer term (below the long EMA).
How Do You Read A Double Moving Average Crossover?
Reading a double-moving average crossover is simpler than it sounds. It’s similar to an EMA cross and occurs when two moving averages of different lengths—like SMAs or EMAs—intersect. A bullish signal is issued when the shorter moving average crosses above the longer one; a bearish signal when it crosses below.
However, caution is advised as moving averages are delayed indicators and can produce misleading signals.
Consider a scenario where the price sharply drops below the EMAs, suggesting a bearish trend. Nevertheless, the signal could be easily reversed, as seen in this example below.
Therefore, it might be better to simply use the market structure as your guide for identifying trends and trading opportunities. Remember, the moving average can be used as a method of finding multi confluence zones, or chasing a trend if it is strong (as seen in the “Good Long Entry” above).
How Do You Interpret Price Crossing a Moving Average?

Interpreting the crossing of price over a moving average is another way to utilise moving averages – whether it’s a simple moving average or exponential moving average.
When the asset price crosses above the moving average, it suggests a potential uptrend is getting started and is generally interpreted as a bullish signal. On the flip side, if the asset price crosses below the moving average, it’s seen as a bearish signal and may indicate the beginning of a potential downtrend.
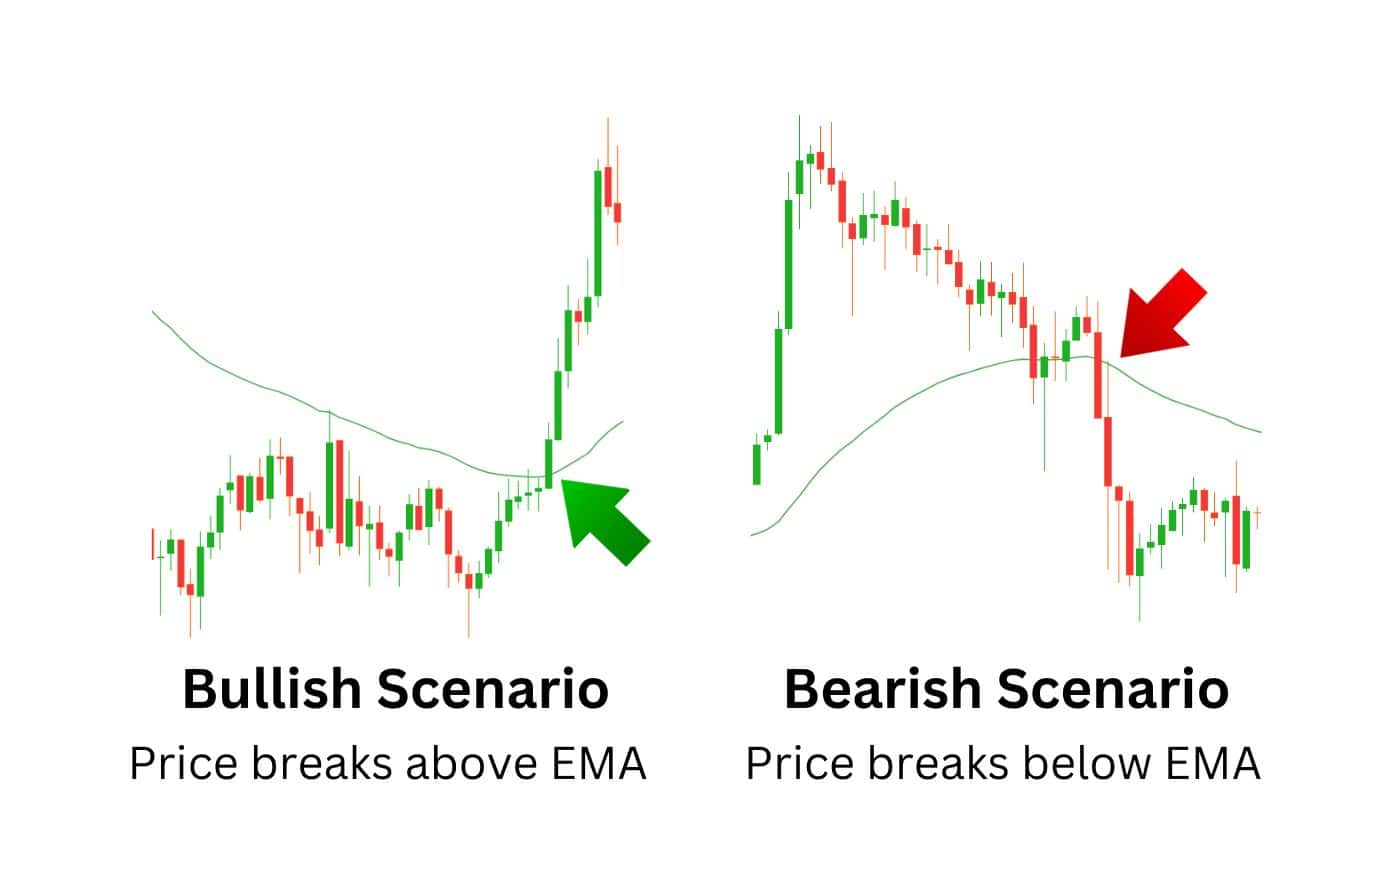
Traders often employ specific lengths for the moving average, such as a 20-day or 50-day average, to determine these crossover points on a chart.
How Do You Use the EMA to Identify Support and Resistance?
Moving averages are seen as a value zone and are viewed as many traders as a support and resistance indicator. In an uptrend, the exponential moving average often serves as a support level where if the price falls down to the moving average, then the price might find a floor and rally.
In a downtrend, the exponential moving average can act as a resistance level, creating a ceiling that can lead to price rejections or pullbacks.
EMA Timeframes and Their Applications
The choice of EMA time frame depends on a trader’s strategy and the market’s volatility. For instance, short-term traders might prioritise responsiveness and use shorter EMAs, such as:
- 5 days
- 10 days
- 12 days
- 20 days
On the other hand, long-term traders might prefer slower, more stable EMAs, such as:
- 50 days
- 100 days
- 200 days
- 300 days
Changing the time frame during heightened volatility can help capture recent price movements more accurately.
Short-Term EMA Timeframes
Short-term EMA timeframes are like speedboats – they’re nimble and quick to respond. They’re preferred for short-term trading due to their quick responsiveness to immediate price movements.
The EMA’s emphasis on recent price movements makes it preferable over the SMA for intraday trading, offering traders increased sensitivity to price fluctuations and aiding in more timely decision-making.
Long-Term EMA Timeframes
Long-term EMA timeframes, on the other hand, are steady and consistent. These time frames provide a broader perspective of market trends and are best used for swing trade positions.
However, the limitation of using EMA for long-term trading is that it’s less frequent in triggering entries and exits on short term charts – simply because the EMAs are far away from the current price.
Nevertheless, the insights provided by these recent data points within various time frames can be invaluable for long-term investors seeking to understand the broader market trends.
Combining EMA with Other Technical Indicators
It can be said the EMA acts as the cornerstone of many other technical indicators, making it a vital part of technical analysis. Let’s explore some of these combinations in the following subsections.
EMA and Moving Average Convergence Divergence (MACD)
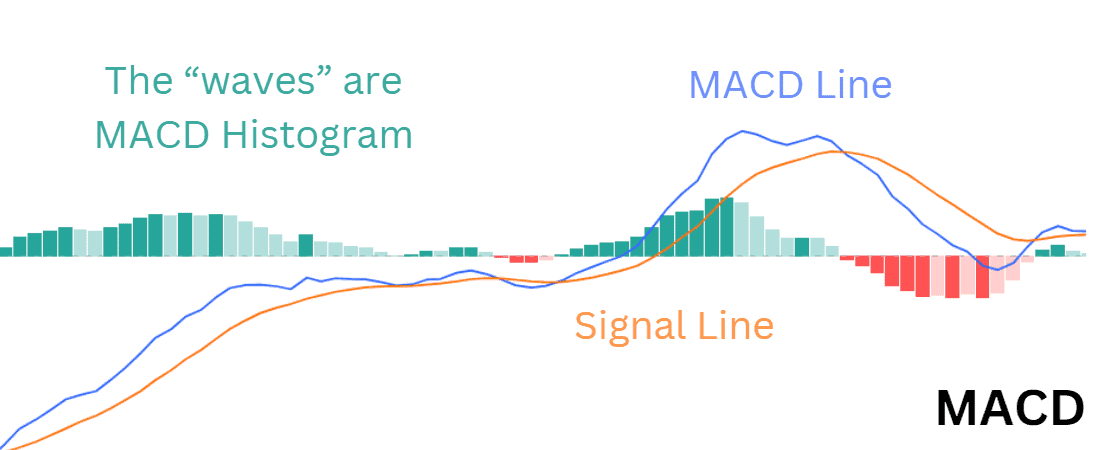
The Moving Average Convergence Divergence (MACD) uses two EMAs to calculate the MACD line, which helps provide buy/sell signals when paired with the signal line.
The difference between the MACD line and signal line is then used to visualise the MACD histogram, which plays an integral role in interpreting the momentum of the asset.
How Do You Use the EMA with Bollinger Bands®?
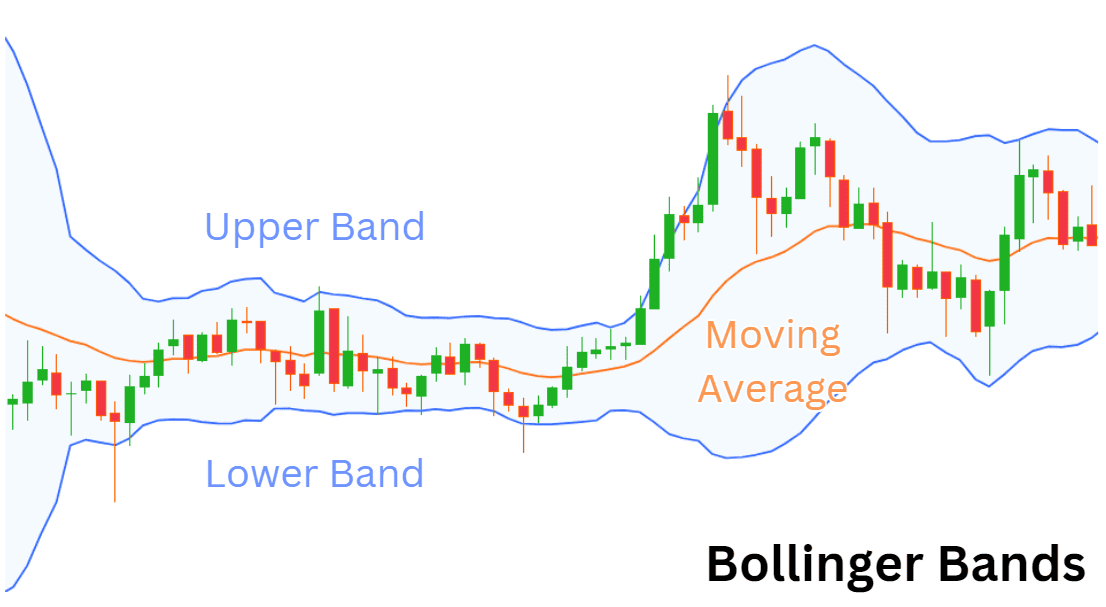
The Bollinger Bands is an indicator that displays a moving average with an upper and lower band, predicting where the price is likely to pause/react from.
While Bollinger Bands are typically set to use the simple moving average by default, changing toan exponential moving average (EMA) will speed up the sensitivity of the bands, making them more responsive to recent price changes.
How Do You Use the EMA with the McClellan Oscillator?
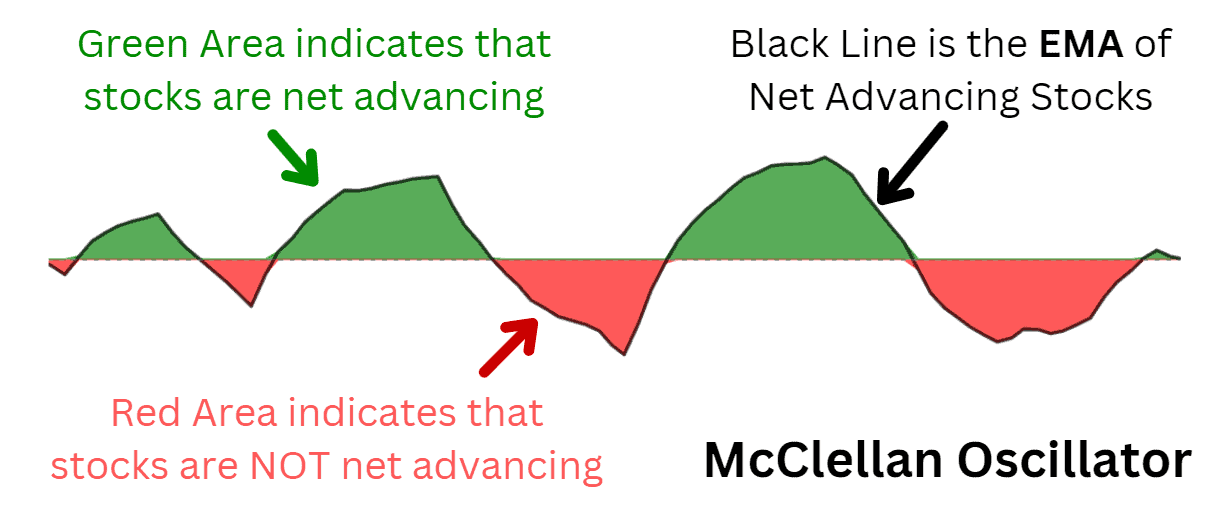
The McClellan Oscillator is a market breadth indicator that measures the number of advancing stocks relative to the declining stocks on the NYSE or NASDAQ.
The calculation for the McClellan Oscillator uses the 19-day and 39-day EMA to smooth out the net advances of stocks, which is then used to calculate the difference, creating the indicator’s calculations.
Using the McClellan Oscillator, traders can identify divergences that may signal potential trend reversals. If a stock is climbing despite most other stocks falling, it may be appropriate to anticipate the stock to follow the general market trend sooner rather than later.
How Do You Use the EMA with Relative Strength Index (RSI)
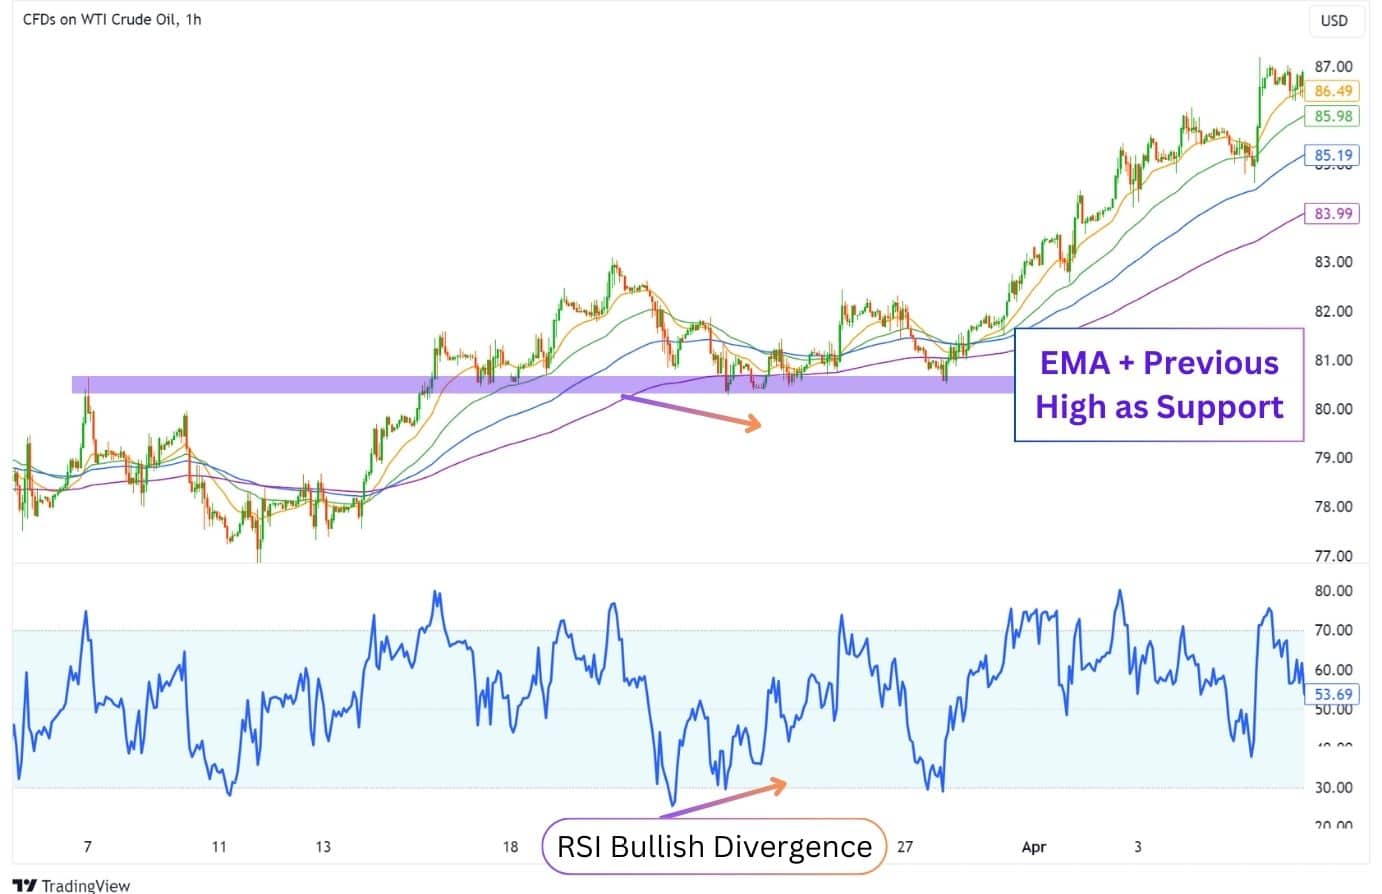
Traders often use the RSI in tandem with the EMA to identify overbought or oversold market conditions. This can assist in finding trades using the EMA and other confluences, such as a horizontal support level or Fibonacci retracement.
The RSI is also great at indicating divergences, which can tell us whether an EMA is likely to act as a support/resistance or not.
How Do You Use the EMA with P&F Charts?
A moving average applied to a candlestick or bar chart is applying the average to a time based chart. For example, each bar is the price action for a specific set of time like 5 minutes, 1 hour, or 1 day. Point & Figure and Renko charts, on the other hand, are price based and are not bound by a time component. Each new block for P&F or renko charts are added when the price has moved a certain distance, regardless of how much time was needed for the last price movement to travel.
Applying a moving average to a P&F chart is a little different than when applied to a time based chart, like a candlestick chart. Each column of x’s or o’s has a range of prices. The data point used is the midpoint of that range.
If the column of x’s has a range from $40-$50, the midpoint of $45 would be used in the moving average calculation. Therefore, if you are applying an exponential moving average, then the midpoints of the most recent columns will be the most recent data points used.
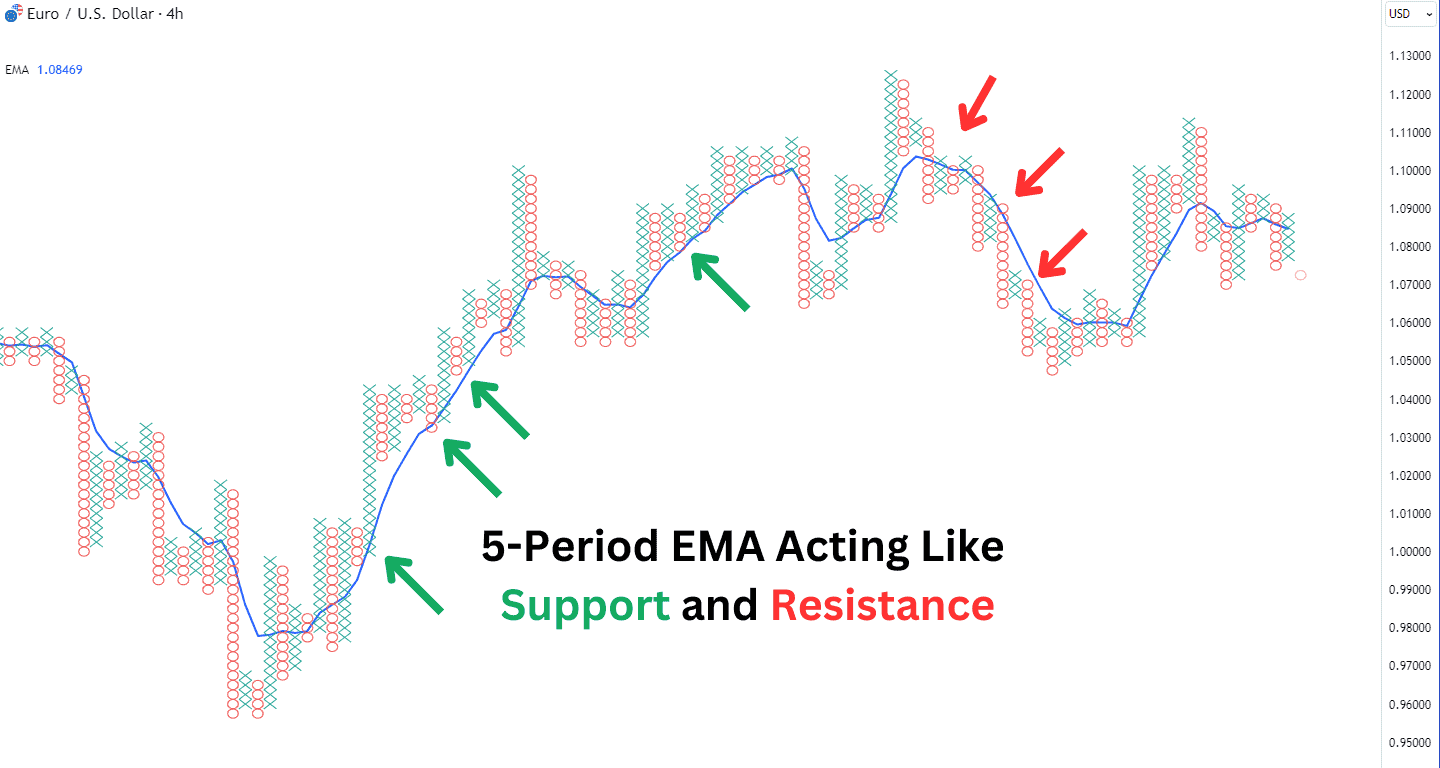
Similar strategies can be used with simple moving averages and P&F charts as you’d find with a typical candlestick or bar chart. The moving average can be seen as a level of support or resistance as is shown in the chart above.
Using the EMA with Point and Figure (P&F) charts is like having a bird’s eye view of the market. This is because the P&F chart by nature is already a simplified view of the market, filtering out minor movements and noise. When applied with the EMA, the reflected EMA price line is a reflection of simplified price action, which provides a clearer picture of the market trend.
Advantages of Using Exponential Moving Average
Exponential Moving Averages (EMAs) offer distinct advantages for traders when approaching the markets. Here’s a quick overview of the advantages:
- More sensitive than SMA:
EMAs prioritise recent price actions, enhancing sensitivity to market shifts and spotlighting daily trading opportunities. - Trend Identification:
By analysing the position of the price relative to the EMA—above for bullish trends, and below for bearish—EMAs streamline decision-making on which side of the trade to favor. - Dynamic Trade Levels:
EMAs double as fluid support and resistance zones, especially potent when they coincide with other key levels, creating areas of multi-confluence for strategic trades.
Disadvantages of Using Exponential Moving Average
Despite its advantages, the EMA also has certain limitations. These include:
- Lagging Indicator:
EMAs are based on past data, reflecting current trends but not predicting future prices. This can result in delayed signals, potentially causing traders to miss optimal trading opportunities. - Vulnerability to Volatility:
The sensitivity of EMAs to recent price fluctuations can lead to false signals in volatile markets, risking premature trades or whipsaws that could diminish trading capital. - EMA Crosses are Ineffective:
EMA crosses tend to provide signals after a trend has already started, due to their reliance on past price data.
Therefore, in light of these weaknesses, traders should use EMA in conjunction with other technical indicators for more accurate trading signals.
EMA vs SMA
Choosing between the Exponential Moving Average (EMA) and the Simple Moving Average (SMA) depends largely on your trading strategy, asset, and objectives.
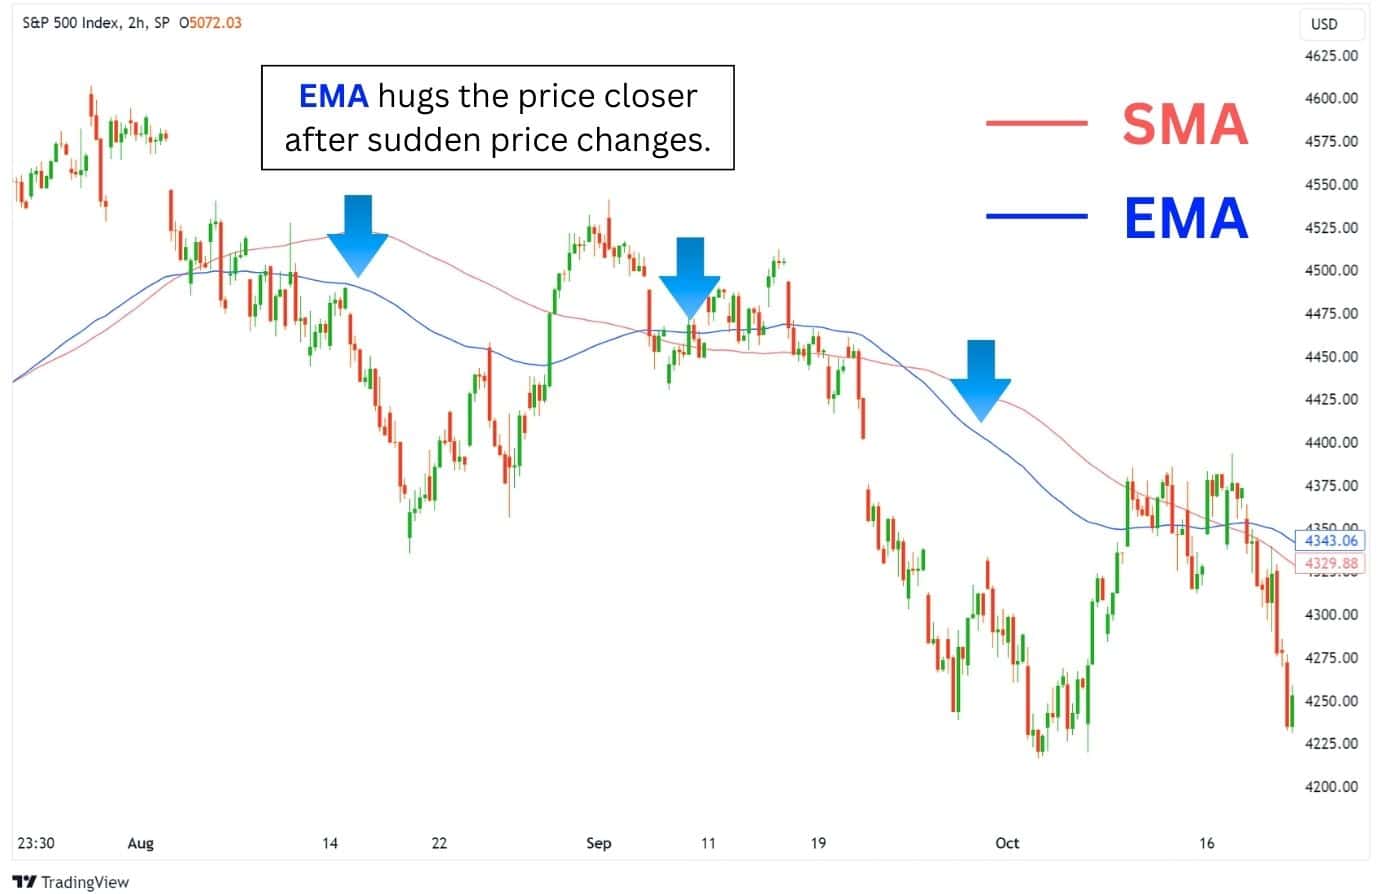
The EMA is quick to react to recent price changes because it gives more weight to the latest data, making it potentially more accurate in reflecting zones where prices could reverse from. The weight of the most recent data point can be
On the other hand, the SMA provides a more consistent view over time, averaging prices equally and offering a clearer picture of longer-term market trends. In the chart above, notice how the exponential moving average hugs closer to the simple moving average? This is due to more weight being placed on the recent price data.
In fact, comparing a 50-EMA to a 50-SMA, the 50-EMA will have an exponential smoothing factor of 3.9% for the most recent candle. (The exponential smoothing factor is computed as 2/(N+1) or 2/(50+1).
On the other hand, the weight of the most recent data point on the 50-SMA is simply 1/50 or 2%. As a result, the EMA via the exponential smoothing factor, produces almost twice as much weight on the recent data forcing the EMA line to hug the recent data points more closely.
Ultimately however, choosing between the EMA and SMA would depend on which is more effective in your strategy backtests.
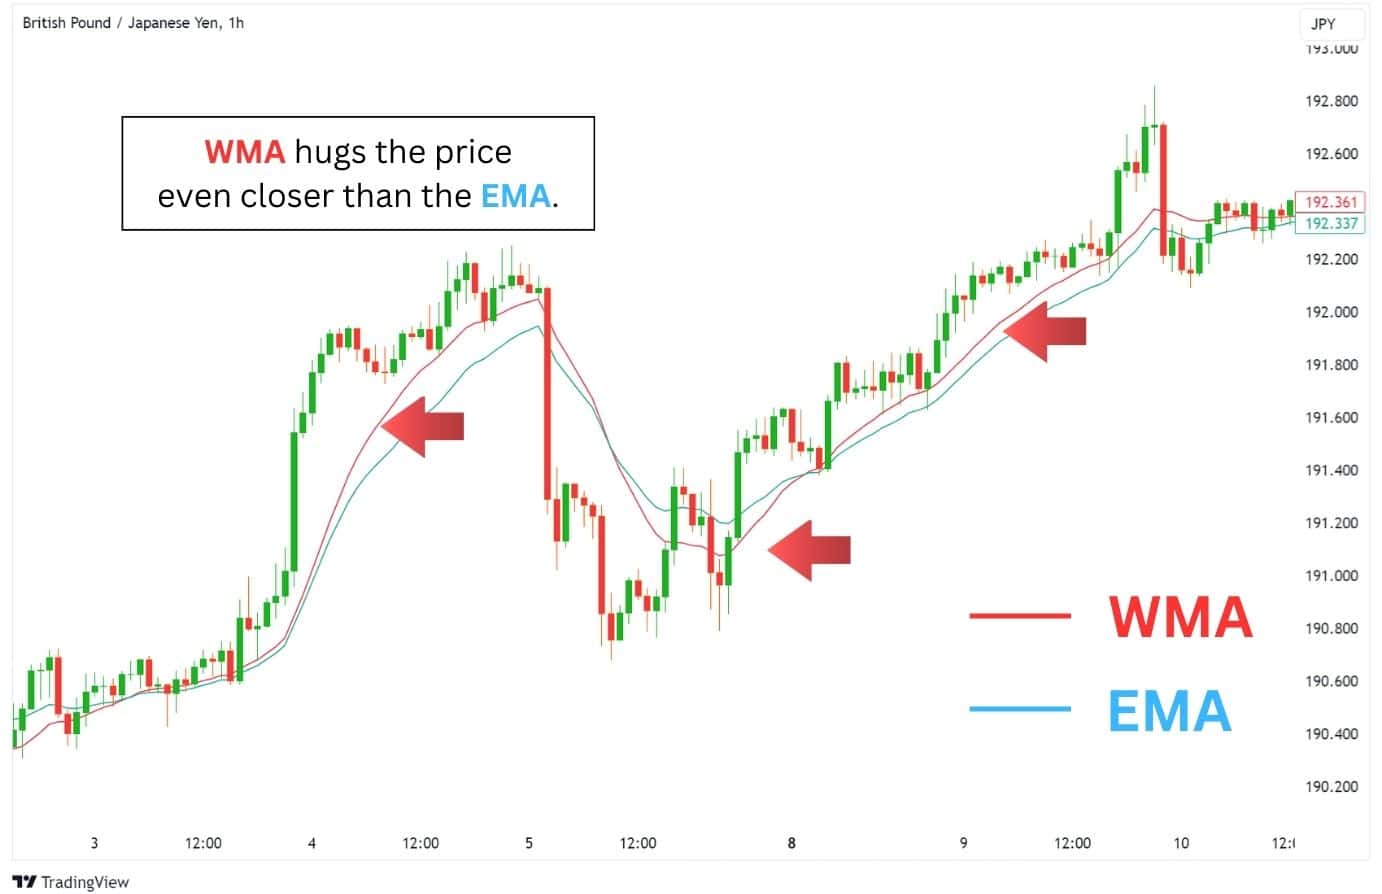
EMA vs WMA
By contrast, the Weighted Moving Average (WMA) reacts even more sensitively to current price movements. This can make the WMA better for intraday trading.
When you apply the WMA to the same chart above and compare it to the EMA, you’ll see that the WMA hugs the price even closer than the EMA.
50-Day vs 100-Day vs 200-Day Exponential Moving Average
The choice between the 50-Day, 100-Day, and 200-Day Exponential Moving Averages can be likened to choosing the right gear for different terrains in a race. Here’s a breakdown of each moving average:
- The 50-day moving average, perfect for short-term market trends, is like a lightweight racing bike, quick and nimble for fast course changes.
- The 100-day moving average provides a medium-term view of market trends, much like a sturdy mountain bike for rocky trails.
- Lastly, the 200-day moving average offers a long-term perspective of market trends, akin to a heavy-duty cruiser for long, steady rides.
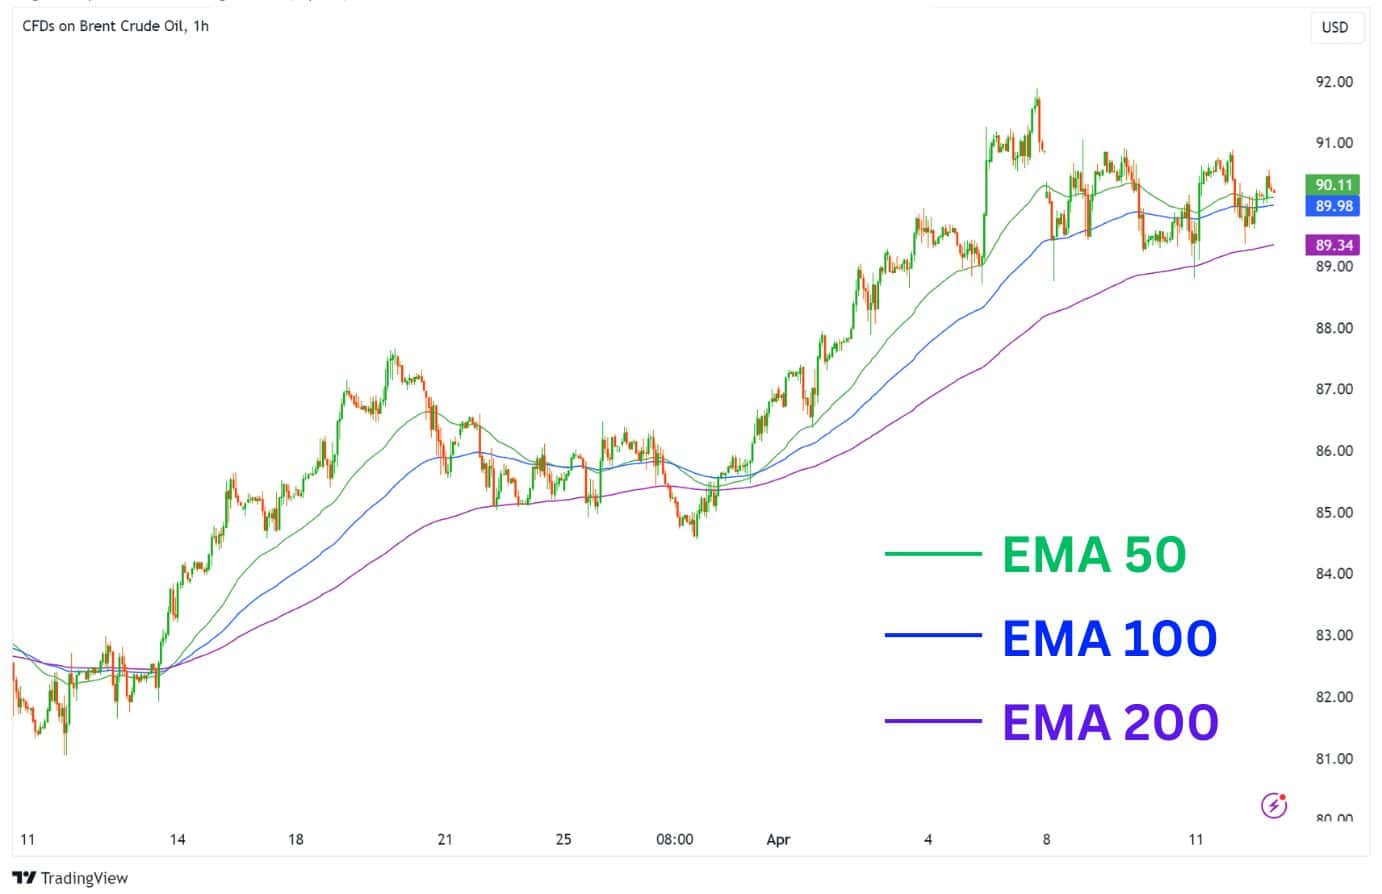
The choice of EMA depends on the trader’s strategy and the market’s volatility.
Frequently Asked Questions
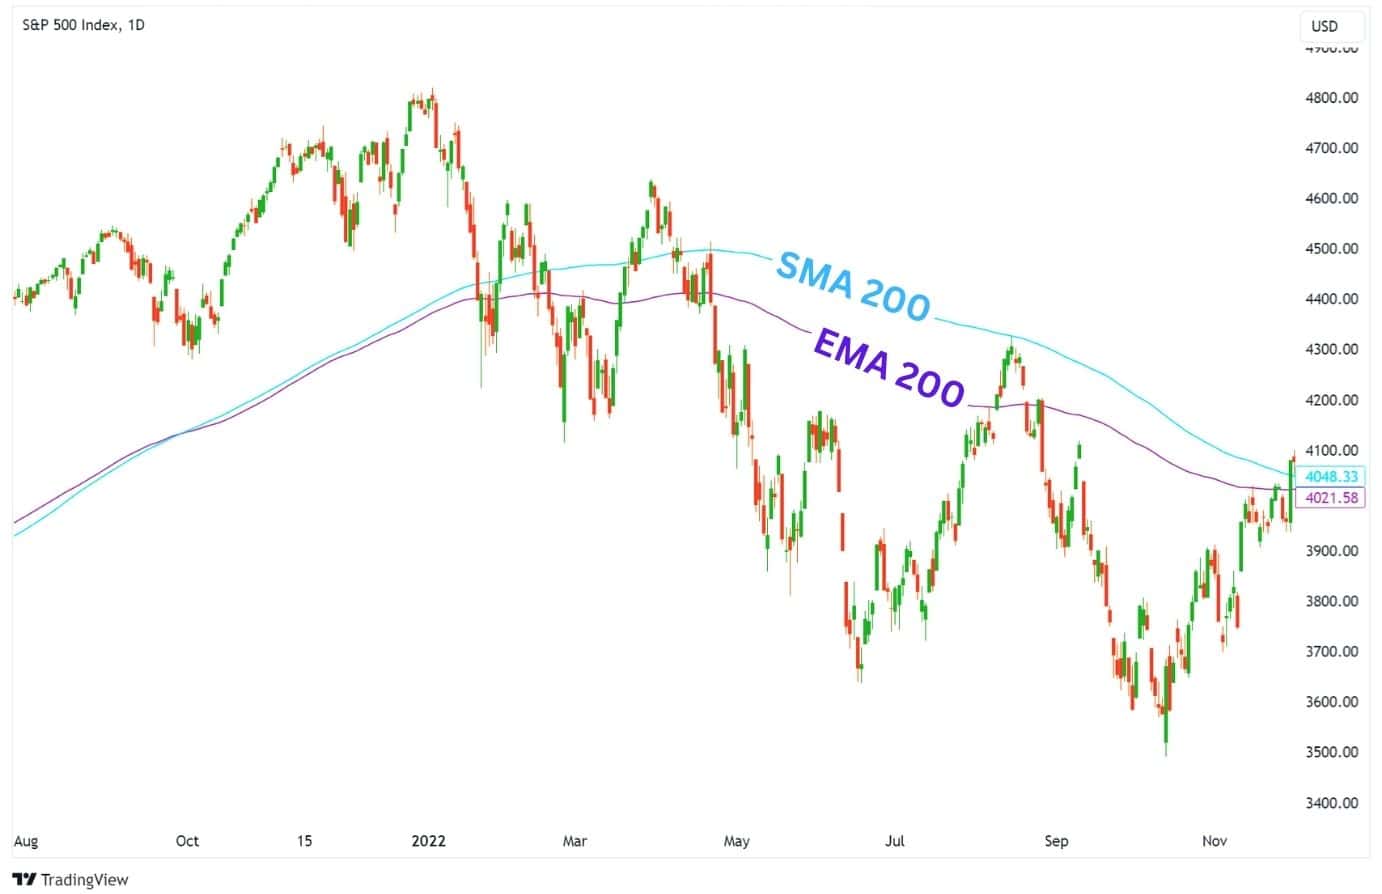
Is Exponential Moving Average Better Than Simple Moving Average?
The EMA adjusts more quickly to price changes, making it a preferred tool for short-term traders. Meanwhile, the SMA provides a smoother overview of longer price trends, and can sometimes act as a clearer support or resistance line.
For example, the daily 200-period simple moving average on the S&P500 acts as a better resistance than the daily 200-period exponential moving average.
This is thanks to the smoother averaging method of the SMA, whereas EMA places more weight on the recent price action.
Is EMA Leading or Lagging?
As a lagging indicator, the EMA reflects what has already happened in the market but can’t predict what will happen in the future. However, it provides a clear zone of value, and hints at a possible price reaction whenever the asset approaches an EMA.
How is the length of an EMA determined?
The length of an EMA determines how much of the previous data you can capture. For instance, if the EMA length is 5, and you’re viewing the asset on a daily timeframe, then the EMA is a 5-day EMA.
Short term traders prefer to use the 20 EMA or lower, while longer term traders go for 50 EMA and above.
How do traders adjust their EMA strategy based on market volatility?
One of the core strengths of the EMA indicator is its flexibility. This flexibility includes adjusting your EMA strategy in response to market volatility.
In volatile and trending markets, traders might rely on smaller EMAs such as the 5/12 EMA to use a trend-following strategy. In the environment where a large move has already occurred, traders might use larger EMAs such as the 200 EMA to look for a macrotrend reversal.
Can EMAs be used to predict future price movements?
While EMAs provide valuable insights into market trends, it’s important to remember that they can’t predict future price movements. EMAs are lagging indicators that reflect what has already happened in the market.
Is the EMA better than SMA for day trading?
When it comes to day trading, the EMA often outperforms the SMA. Thanks to its emphasis on recent prices, the EMA adjusts more quickly to price changes – often leading to more intraday signals as a support or resistance line.
Where the SMA shines, however, is in the longer term – such as the Daily, Weekly, or Monthly levels. The SMA’s smoothing allows it to better capture the overarching trend of the market, and also potentially catch the top or bottom of massive price swings.


