


Written by:

Reviewed by:


- July 15, 2024
- 17 min read
Average True Range (ATR) Explained
Let’s face it, no one likes getting their trades stopped out. Then, as if to rub salt in our wounds, the market reverses and moves in the direction of our trade.
It’s a frustrating experience we all know too well. So how can we avoid it?
This is where the ATR indicator comes in. It’s a beginner friendly, yet effective tool for setting a stop loss that avoids this scenario. In this tutorial, you’ll learn what the ATR indicator is, how it works, and how to use ATR to benefit your trading. So let’s get started!
What is the Average True Range Indicator
The Average True Range (ATR) is an indicator used by technical traders to measure volatility. The ATR does not signal a directional bias, but instead tells us how violently price has moved across a past duration. A high ATR value represents high volatility, whilst a low ATR value represents low volatility.
Originally designed for use in the commodities market, the ATR has since been applied to all types of securities, including the stock market, forex, and cryptocurrencies like Bitcoin.
Versatile in nature, the ATR can be applied to any asset and paired with most trading systems, making it a fantastic indicator to add to your trading system.
How Does the Average True Range (ATR) Indicator Work?
The ATR indicator operates by looking back on past candlesticks or bars, and then calculating the average of its true ranges. In very simplified terms, a true range is the greatest distance the price has moved over the calculation period. When the true ranges are large, the ATR is large. A rising ATR implies rising volatility, and vice versa.
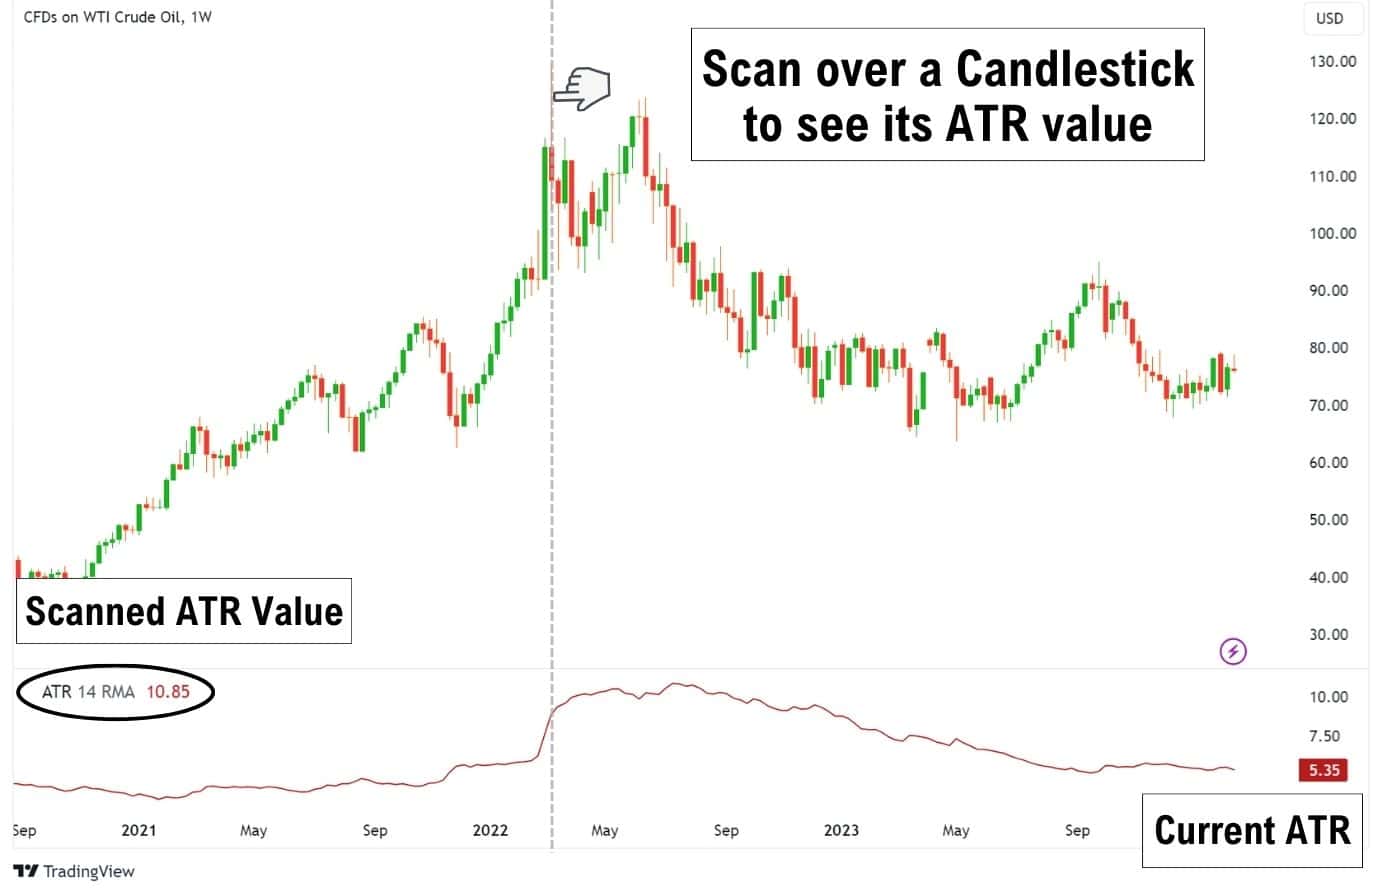
When you apply the ATR indicator to your chart, it will appear in a new window below the price chart. The indicator displays a smoothed line which represents how the volatility is changing.
The ATR provides a raw value which tells you how far the price has moved on average. For instance, if an asset is valued at approximately $100 and the ATR shows $1.50, this tells us that on average, the price has been moving up or down by a value of $1.50.
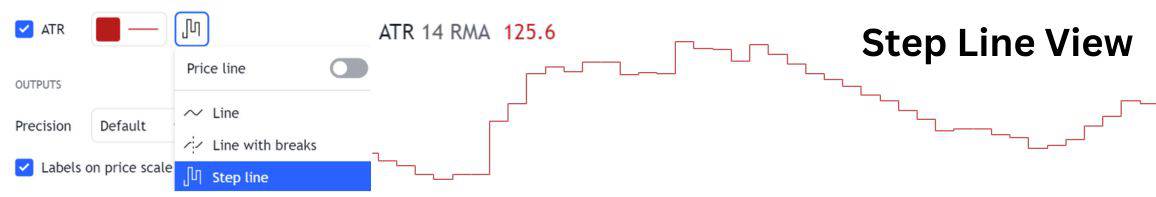
Alt image desc: changing ATR to step line in TradingView
Some charting packages offer different ways to display ATR. If the charting package offers a “step line” display, then it will offer a clearer view of exactly when the ATR has experienced a spike.
Importance of Average True Range Indicator
The Average True Range (ATR) is a valuable indicator for managing risk, offering traders more consistency in their results. It gauges volatility and tells you the typical price movement range of an asset.
By understanding the expected average movement, you can set a stop loss that’s less likely to be triggered by normal market activity.
The ATR is useful for:
- Measuring volatility
- Setting a stop loss or take-profit
- Detecting real breakouts from consolidations
An aspect of the ATR that doesn’t get enough love is its ability to keep our trading emotions in check. Following a structured system like the ATR allows us to stay objective with our stop-loss placement, and accept losses if they come.
So many traders make the mistake of moving their stops further whenever a trade goes into the red, only to eventually get stopped out at a greater loss. By following a clear system outlined with the ATR, we can sidestep this common pitfall, and view our trades with greater objectivity.

How To Calculate ATR
The ATR indicator takes the true ranges across a specified number of candlesticks or bars, then finds the average values, and applies a smoothing average.
True Range
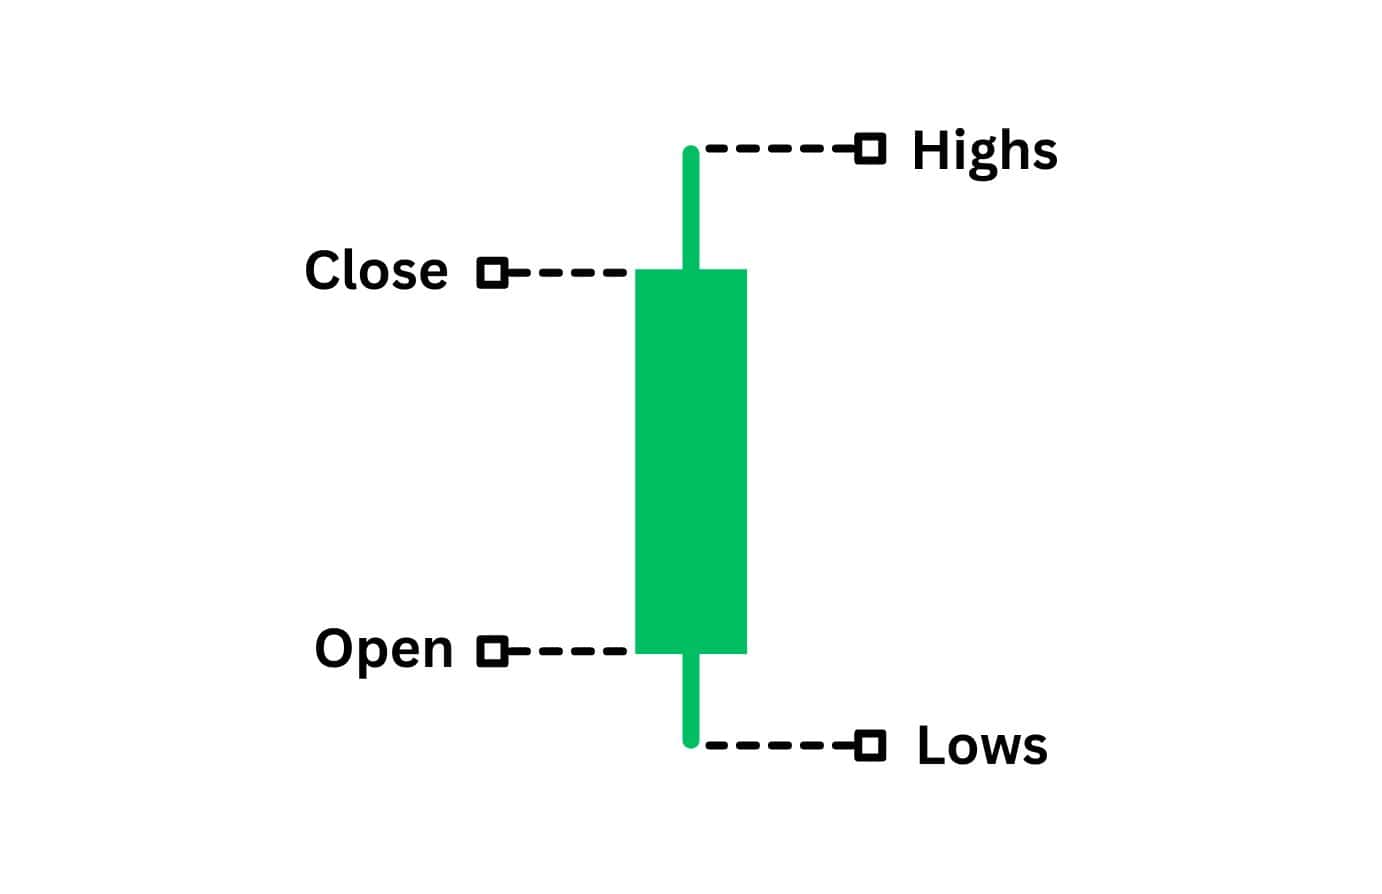
To understand ATR, you first need to know what a true range is. It’s the biggest distance between these three scenarios:
- The current high minus the current low
- The absolute value of the current high minus the previous close (triggers when price gaps higher)
- The absolute value of the current low minus the previous close (triggers when price gaps lower)
Mathematically, the true range calculation would be represented as such:
TR=max[(High−Low),∣High−Previous Close∣,∣Low−Previous Close∣]
If your ATR settings were set to 14, you would be looking back at the 14 most recent chart periods and finding the true ranges for each of them
ATR Formula
Here is the formula that is used to calculate the current ATR, with smoothing averages applied:
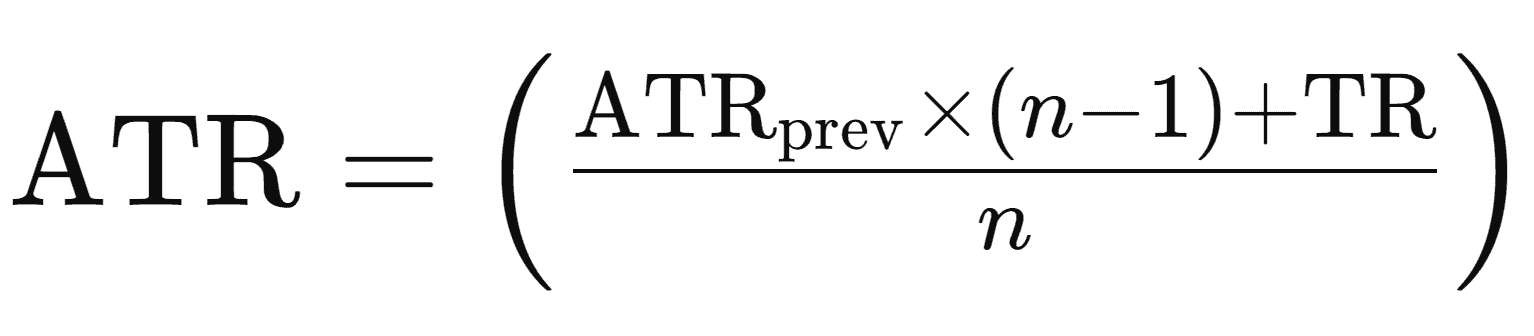
- ATRprev is the Previous ATR
- N is the period, or number of candlesticks
- TR is the current true range
When you do not have the ATRprev, you can substitute that value with an Absolute ATR calculation. This is a raw measure of volatility without smoothing averages applied.
Absolute ATR
The Absolute ATR is the calculated ATR value without any smoothing techniques applied. It provides a raw measure of volatility. It is calculated with the formula: ATR = ∑TR / n
ATR = ∑TR / n
- ATR is the Average True Range
- ∑TR is the sum of True Range values over the calculation period
- N is the calculation period, which usually is the 14 most recent candlesticks
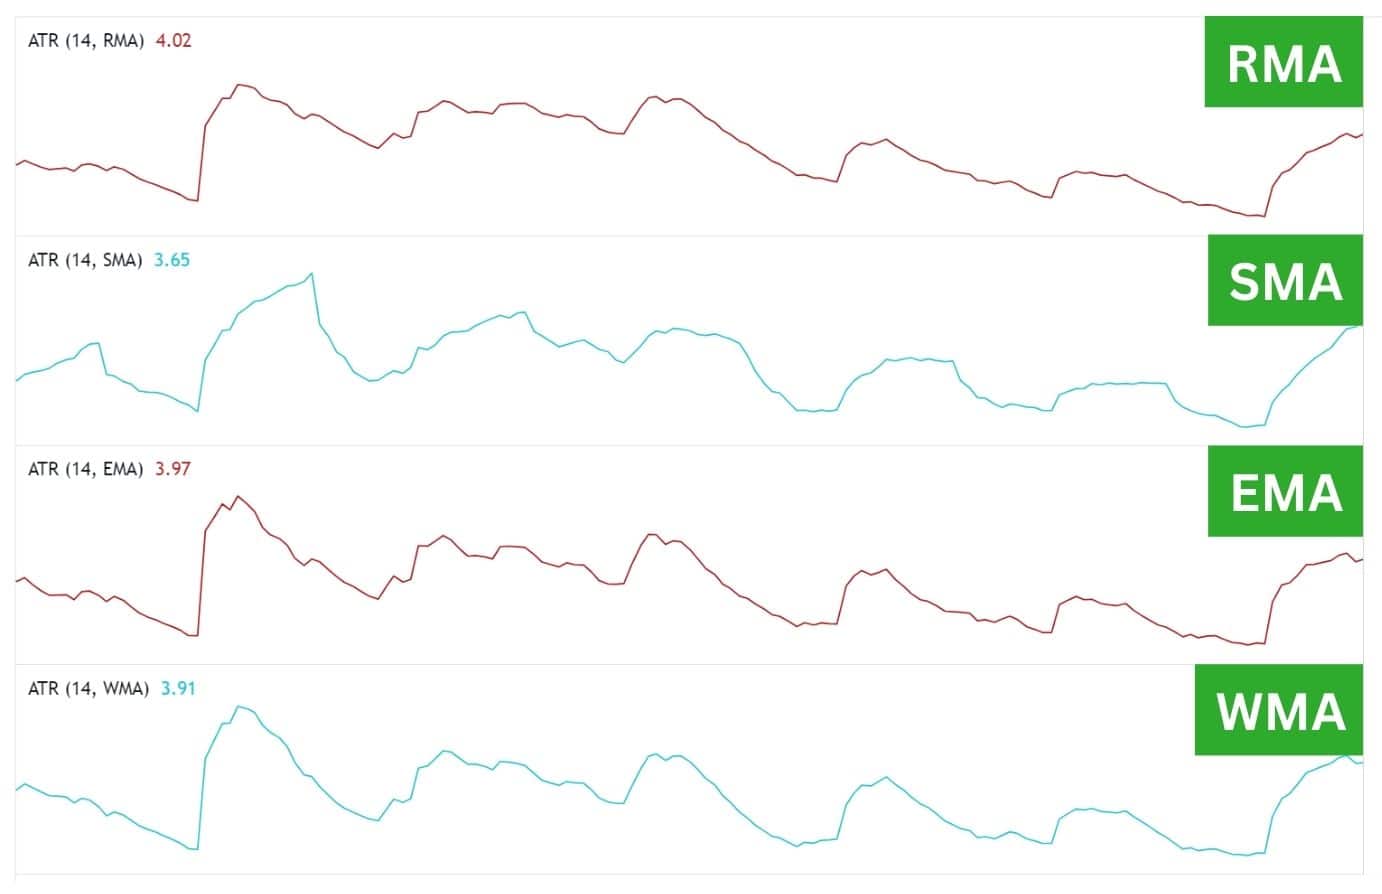
Smoothing Average
Remember, there’s a smoothing formula that comes into play here. This formula changes the appearance and placement of the ATR line. By default on TradingView, the ATR is smoothed with the RMA method.
Why Would A Trader Use a Different ATR Setting?
Today, the commonly used ATR setting is the 14-period, but traders may prefer using different ATR values for specific purposes. For example, the founder of the ATR – J. Welles Wilder Jr. preferred using the 7-period ATR for his trading. This setting makes the ATR indicator more sensitive to recent price swings, allowing traders to set more dynamic stop losses.
Other traders may set the ATR to 1-period to utilise specific strategies, such as Tony Crabel’s NR4 and NR7 strategies. This setting helps traders detect the smallest daily price range in the last 4 or last 7 days, which often leads to a breakout or reversal.
Average True Range Example
Let’s take a look at Bitcoin in May 2021 and November 2022, these were the two times when Bitcoin created an all-time high, and then came crashing down furiously, over 50% each time.
Notice how the ATR behaved differently across the two periods:
- From the First Peak, the ATR began to climb, whilst the price began to fall.
- From the Second Peak, the ATR was overall declining, whilst the price was falling.
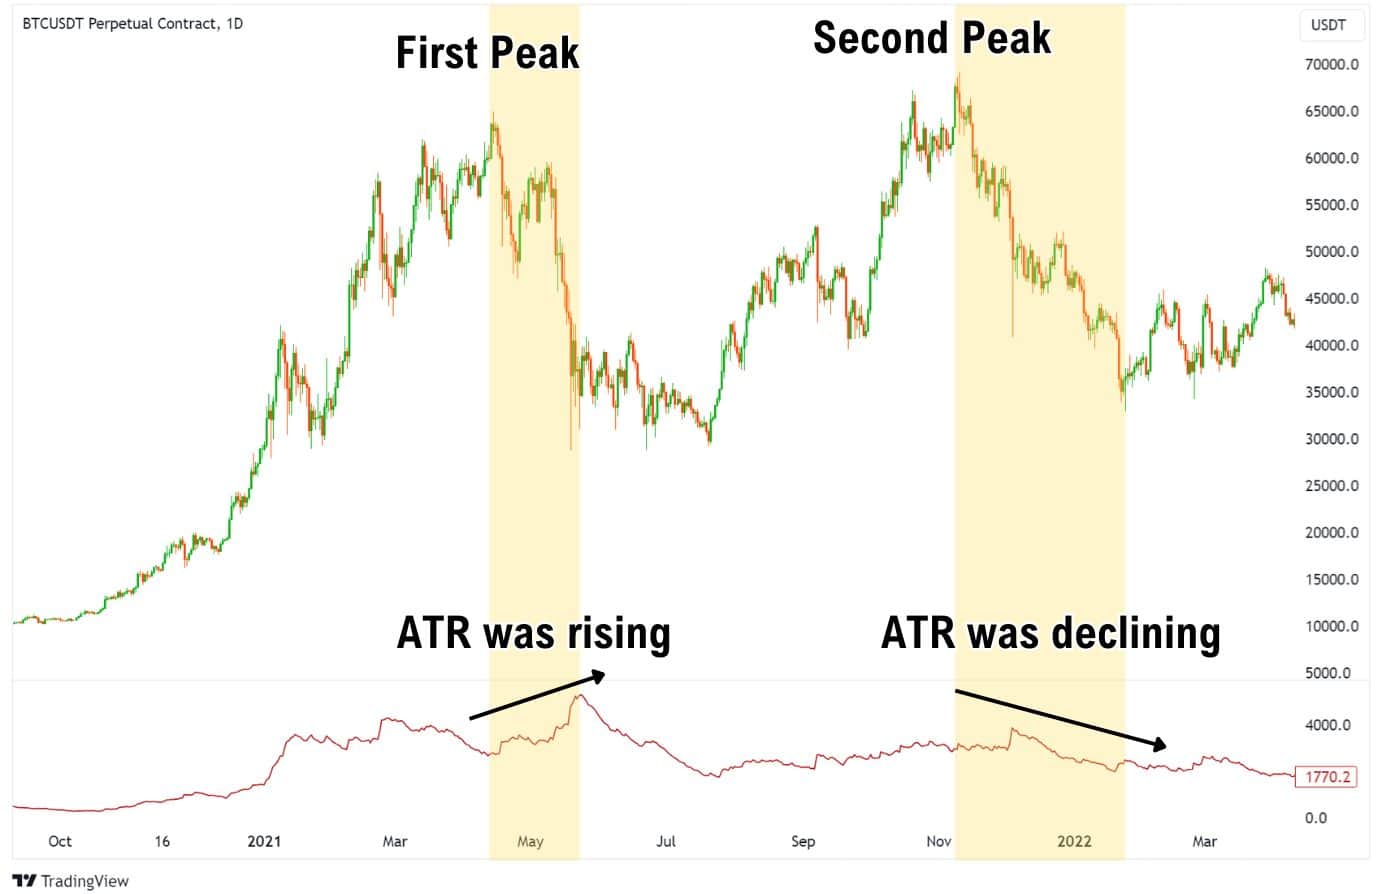
So why is the ATR behaving differently, even though Bitcoin was behaving similarly both times?
Here is how to interpret the data:
- First Peak with Rising ATR: This tells us that a sharp move is happening, and market participants are selling in a panic.
- Second Peak with Falling ATR: This tells us the market is experiencing a slow selloff and moving within a tighter, descending range.
This could imply a few scenarios:
- Market participants are in disbelief that the second peak was a significant top.
- Market participants could be less active, which would coincide with the timing of the selloff (started near Christmas, which typically has 50-70% less trading volume).
- Market participants are in disbelief that the second peak was a significant top.
It’s important to remember that the ATR does not offer trade signals. Rather, it’s a lagging indicator that measures past volatility. By itself, the ATR does not predict future price movements, and should only be used to provide extra context to understand market conditions.
Average True Range Trading Strategies
When using the ATR in trading, it’s important to remember that the ATR by itself does not provide entry signals. Instead, the ATR is used as a supporting tool to improve your trade, either by providing a clear stop loss and take profit level, or by providing extra confirmations for a breakout trade.
But before we go right into the strategies, let’s get you up to speed with our ATR settings:
| ATR Period | 14 |
| Smoothing Type | RMA |
| Stop Loss (SL) | ATR x 2 is Recommended |
| Take Profit (TP) | Between 1:1 to 1:2 risk-to-reward ratio OR – TP at the next swing / pivot high or low |
First, let’s take a look at how you can place a logical stop loss using the ATR.
ATR Strategy for Placing Your Stop Loss
A common strategy used by traders is to set their stop loss at twice the ATR value from the entry point. By placing your stop loss distance at 2 times the ATR value, we are positioned to avoid being stopped out by regular market movements.
Remember, the goal here isn’t to determine directional bias, but rather to set a stop loss that won’t be taken out.
Let’s look at an example of how this works:
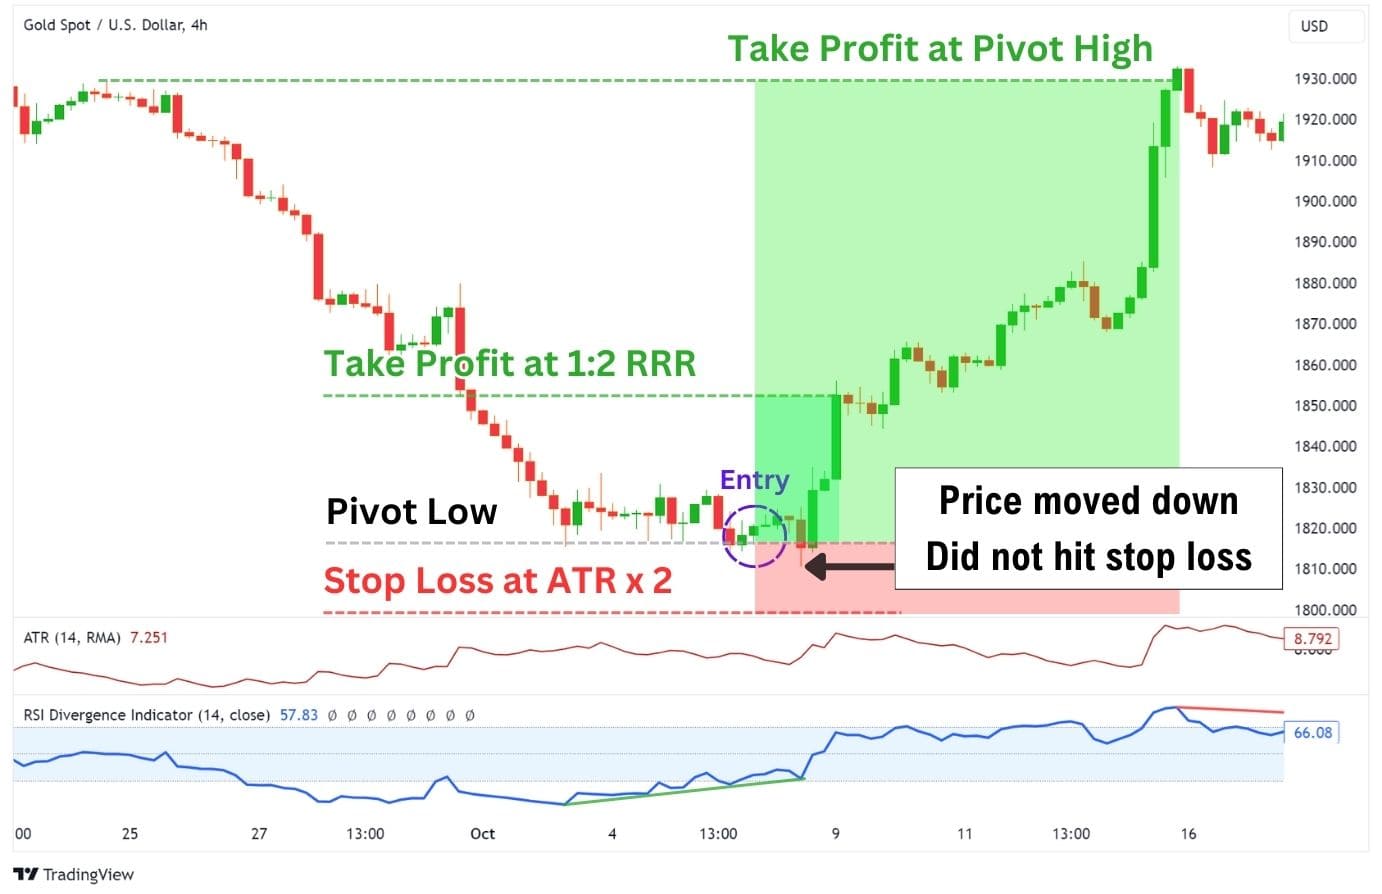
Let’s say on this XAUUSD (Gold) 4-hour chart, you’ve entered a trade based on several reversal indications – a pivot low bounce, a confirming candle, and a bullish RSI divergence.
This is how you can set a stop loss based on the ATR x 2 rule:
- Find the ATR at the time of entry, say 7.251
- Double it to 14.502.
- For a long position, subtract this from your entry price, 1820, setting the stop loss at 1805.498.
In this example, the price dips to 1810 but doesn’t reach our stop loss, preserving our position for a potential upward reversal.
Detecting Real Breakouts in Consolidation Patterns
The ATR indicator is a valuable tool for identifying genuine breakouts and filtering out false ones. It’s particularly useful for trading consolidation patterns such as ranges, triangles, wedges, and flags.
Consider this example on Bitcoin, where the price initially broke out of a triangle pattern, only for it to be a false breakout, and only truly breaking out later on.
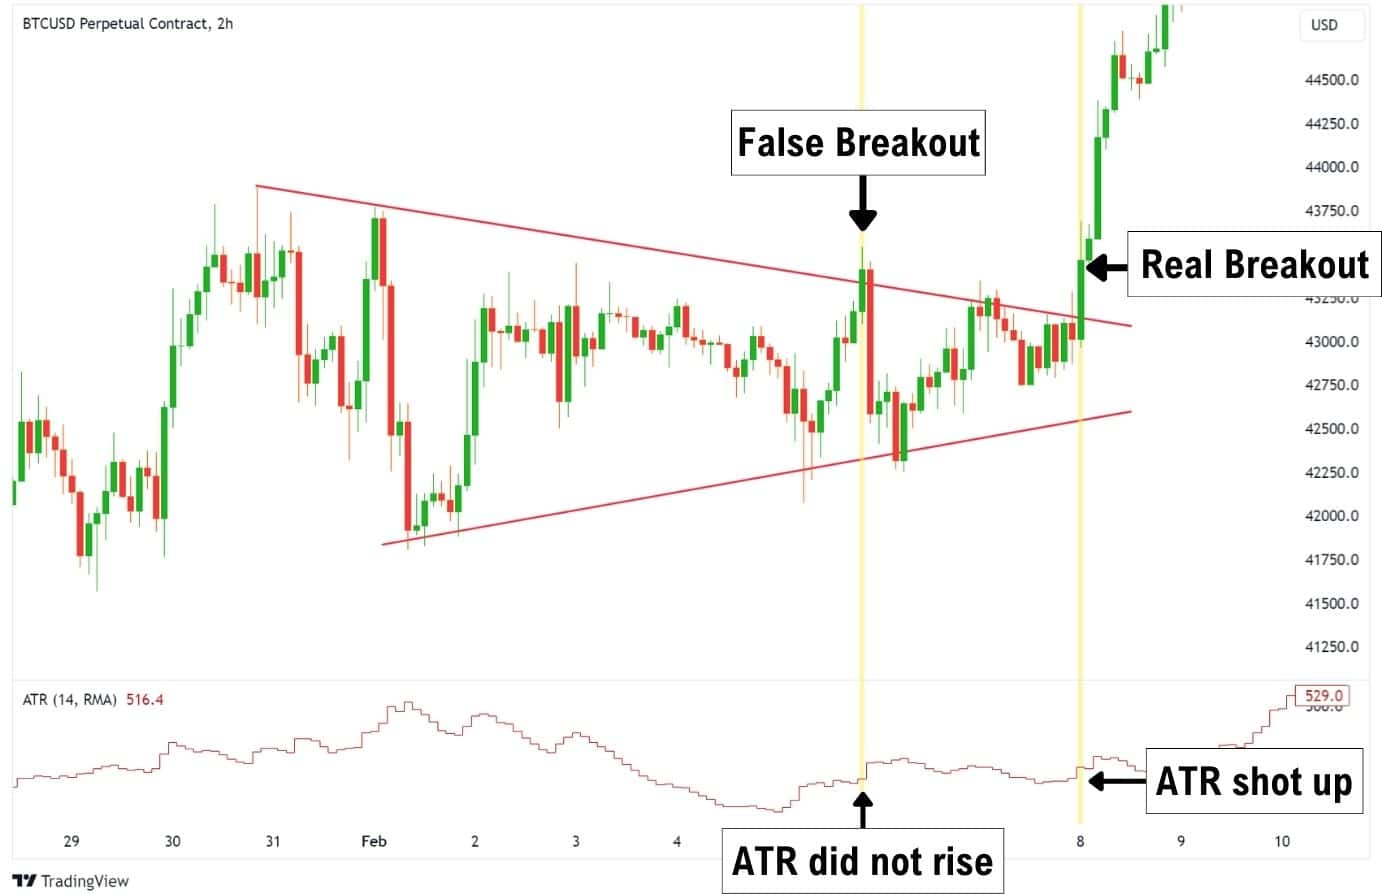
At the initial breakout, we see a successful candle close above the triangle pattern. Although this by itself gives us a clear entry signal, we can see how the price aggressively dumped back into the triangle pattern. The ATR on the other hand, would have provided clues that this was a false breakout, because the ATR remained flat.
On the other hand, when the price made another attempt later on, we saw a rise in the ATR alongside a green candle close above the triangle pattern. A rising ATR indicates the range of the 4-hour bars is expanding. This provides additional evidence that the market is turning directional and breaking out of the consolidation.
The ATR can help us find real breakouts while helping to avoid taking bad breakout trades. It’s a validation tool that can be applied with trading consolidation patterns, and improve your consistency.
Keep in mind however that the ATR indicator is only a validation tool, and does not provide entry signals by itself. However, there are advanced indicators such as the ADX, which incorporates the ATR, and has a built-in trading system that traders can apply.
Using Average True Range for a Trailing Stop-Loss
The Average True Range (ATR) is an excellent mechanism for managing trailing stop-losses. As your trade progresses favourably, the ATR can help lock in profits by setting a trailing stop that adjusts with the trade’s performance.
The trailing stop is a great way to stay in a trade for as long as the trend remains unbroken. Many trend traders prefer to use a trailing stop instead of a profit target to help them optimise their profits. As the markets trend up, the trailing stop follows closely behind.
By setting our trailing stop loss to an ATR value, we can ensure several things:
- Our stop loss isn’t as easily taken out by regular market movements.
- We are only exiting our trade positions due to powerful moves in the market breaking the trend.
Using ATR as a Chandelier Exit
A great way to start using an ATR trailing stop is by using the Chandelier Exit indicator. This indicator displays where your trailing stop loss would be, based on the ATR value times 3.
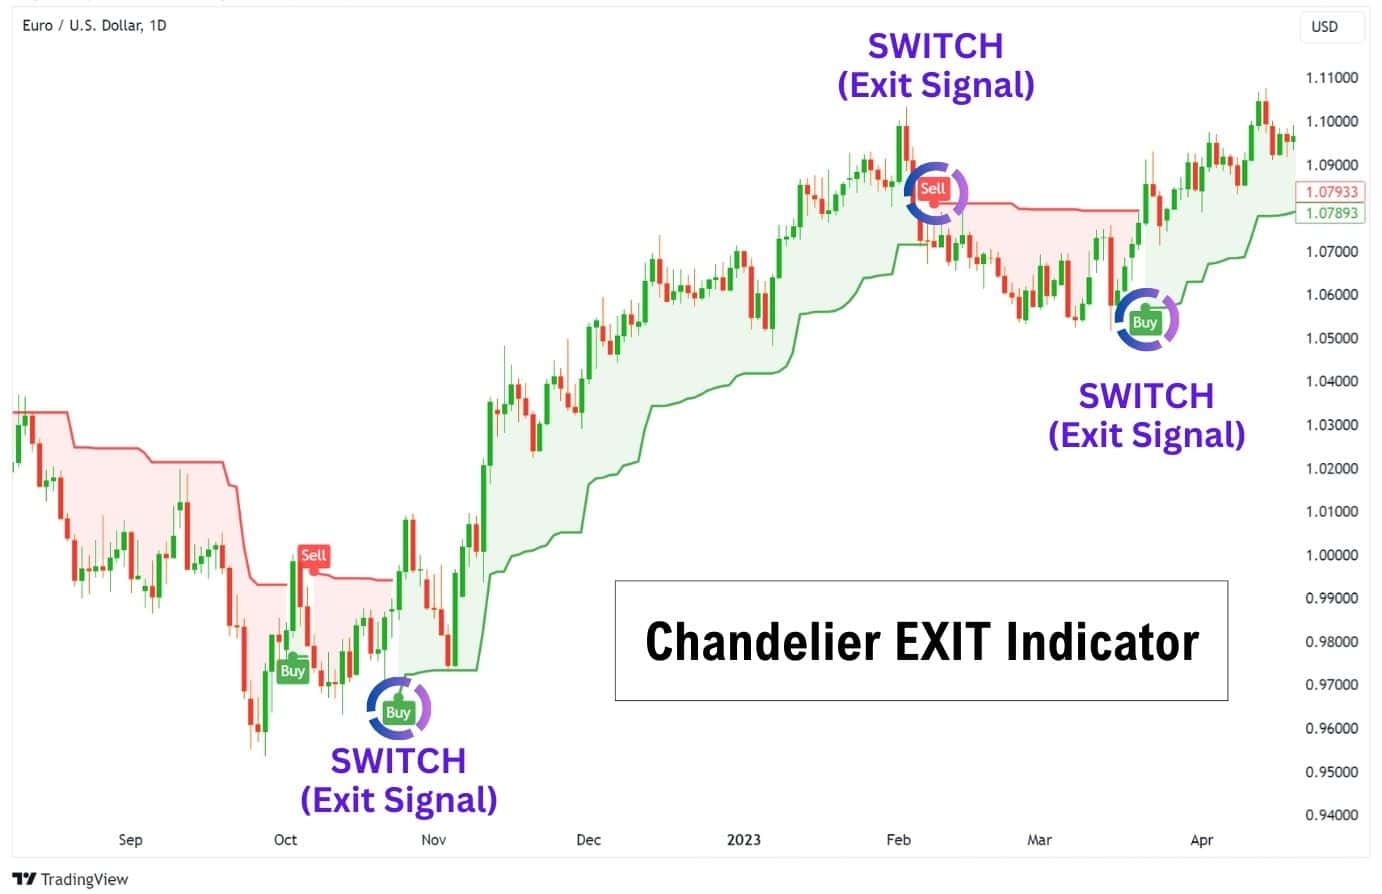
A key feature of the Chandelier Exit indicator is how it will dynamically switch between displaying a long and short stop loss based on market movement – much like the Parabolic SAR indicator. Whenever a switch occurs, it acts as an exit signal, telling traders to close their trade because the ATR x 3 trend has been broken.
It’s important to remember that the Chandelier Exit indicator, and the ATR for that matter, do not provide entry signals. These indicators are best used as exit signals, not as entry signals.
Using ATR for Day Trading
The ATR is a great tool for day traders as it provides a clear stop loss and take profit targets. Many traders refer to the ATR value to place their stop loss or take profit targets.
The most popular option is to set your stop loss and price target’s distance equal to the ATR value times two. However, some day traders opt for ATR x3 on smaller time frames, such as 1-hour or lower due to their smaller ATR values. By using a higher multiplier of the ATR, we can account for the small ATR values found on the lower timeframes, and better protect our trade positions.
Popular ATR multipliers for setting stop loss are ATR x2, ATR x3, and ATR x4.
What Indicators Work Best with ATR?
The ATR works best with indicators that provide a general trend direction, or even predict when the price is about to reverse. As the ATR itself is non-directional, using a trend indicator can help round out this weakness, and provide stronger clarity on where the market may be going.
Here are some indicator suggestions for you to use alongside the ATR:
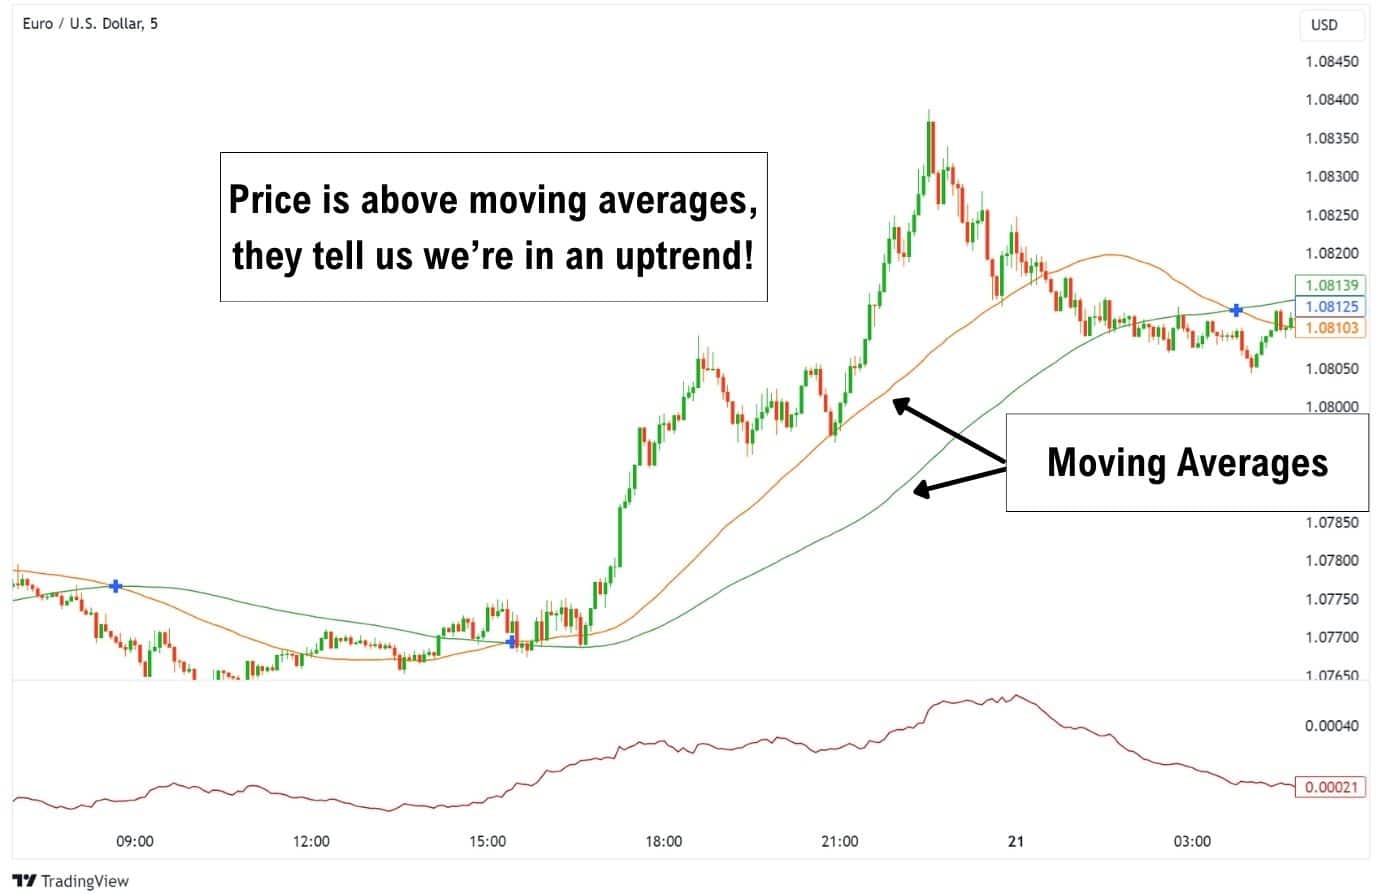
Moving Averages and ATR
Moving averages are indicators that calculate the average price across a past period of candlesticks. There are many versions of moving averages, such as the Simple Moving Average (SMA), Exponential Moving Average (EMA), Hull Moving Average (HMA), and Volume-Weighted Moving Average (VWMA).
- Moving averages can tell you the general trend’s direction, allowing you to filter out trades which are going against the trend.
- If the price is above the moving average, it’s in an uptrend, and vice versa.
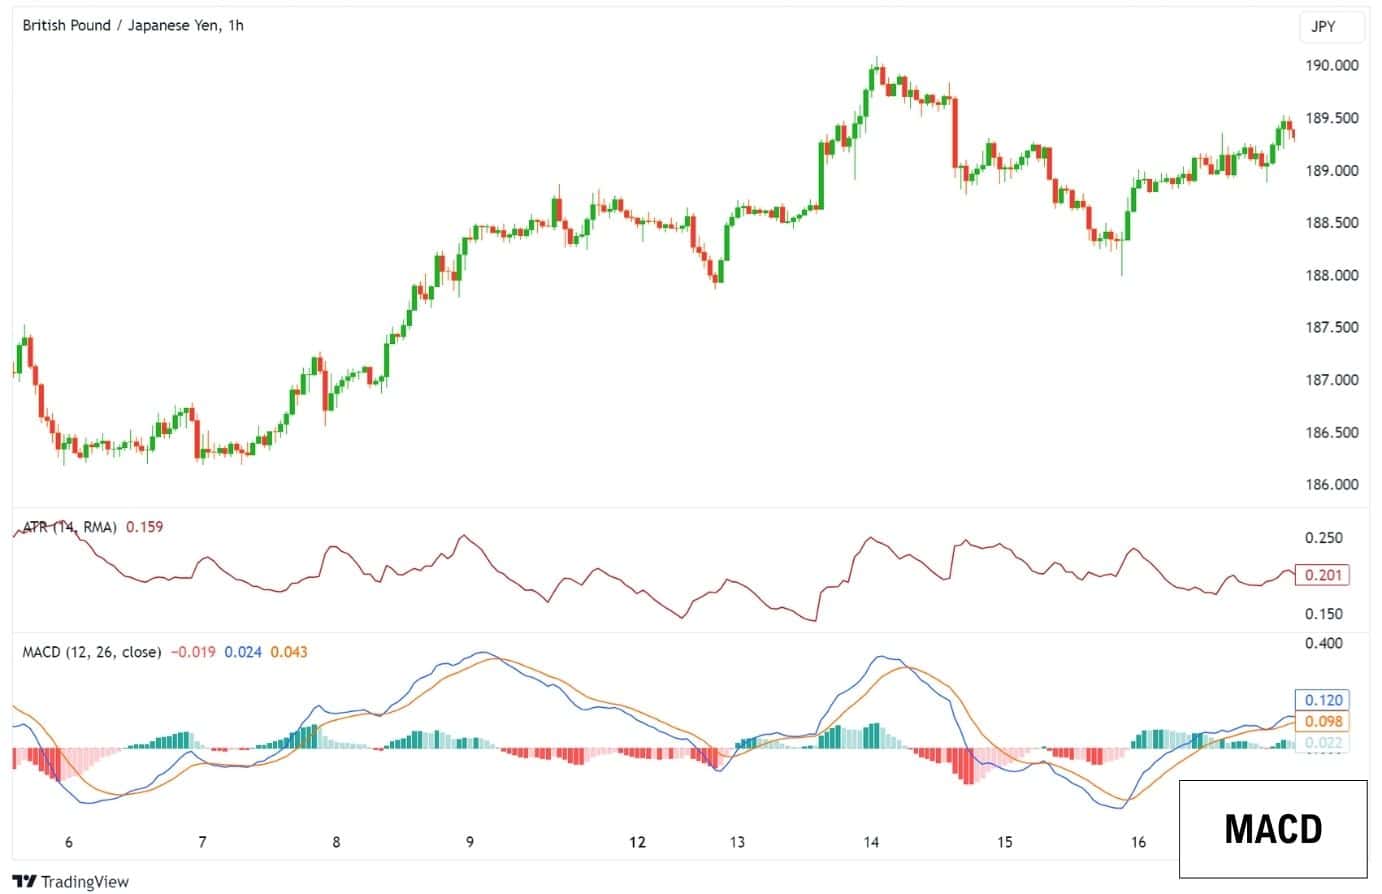
Moving Average Convergence Divergence (MACD) and ATR
The MACD is a versatile indicator that provides an overview of the trend direction, the momentum’s strength, and also provides trade signals with moving average crossovers. The ATR can complement the MACD in that traders can set a valid stop loss for the entry signals.
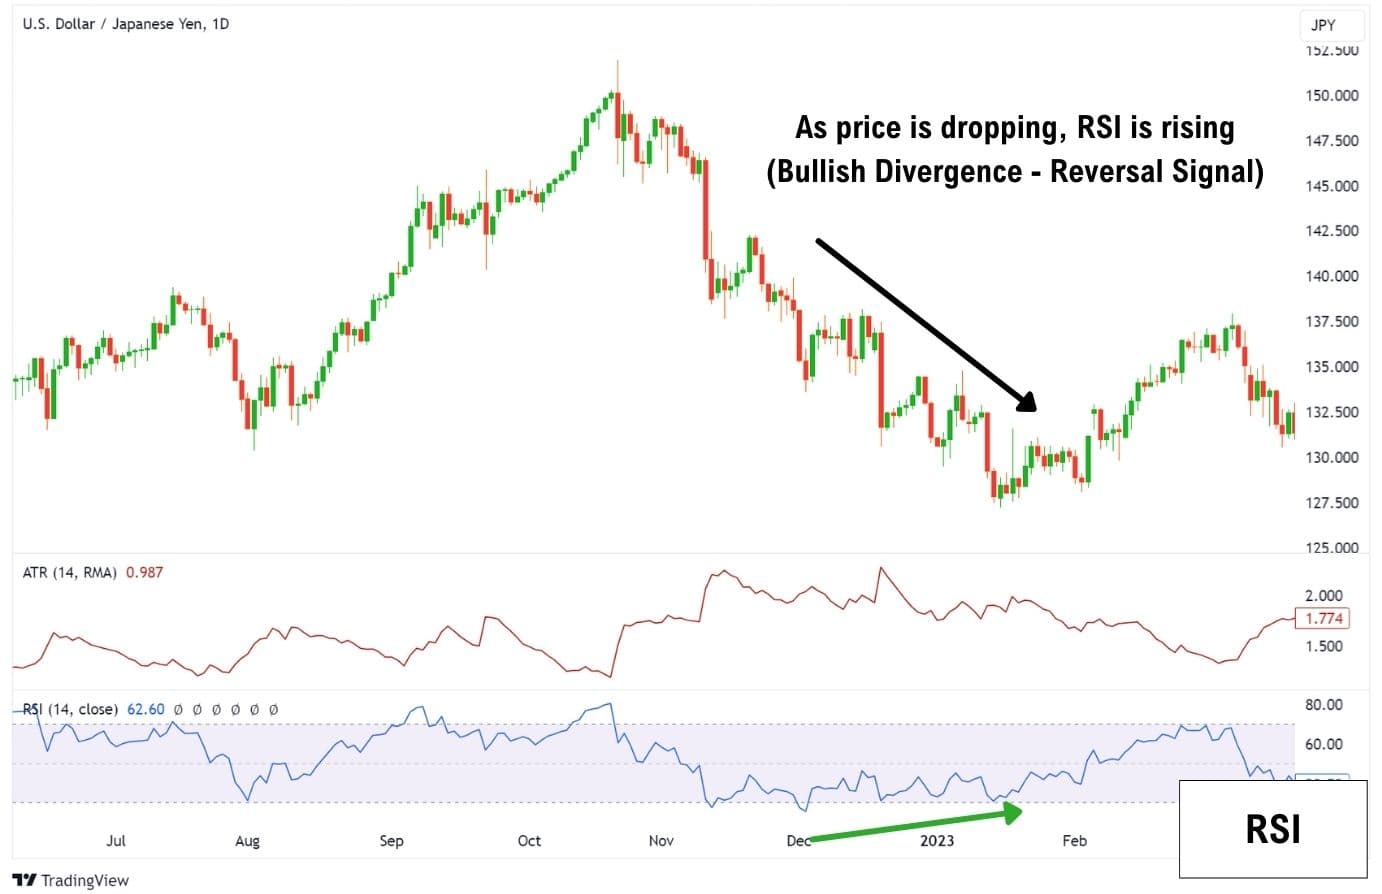
Relative Strength Index (RSI)
The relative strength index (RSI) is a momentum oscillator that quantifies the buying and selling momentum of an asset. It is most useful for finding soon-to-be price reversals. The key features of the RSI are that:
- Traders can use the RSI to find overbought or oversold market conditions for trading reversals.
- The RSI can form divergences, these are more powerful signals for a price reversal.
Due to the RSI’s lagged nature, it comes with the weakness of not being able to signal when the price has exactly bottomed out or topped out. Sometimes, despite a divergence being already formed, the price can keep going lower (or higher if you’re looking to short), which can take traders out of their positions. This is why using the ATR to set a wider stop loss can be so beneficial with the RSI indicator.
Using ATR to Weed Out High Volatility (ATRP)
Some traders do not like to trade highly volatile assets, as they are more unpredictable. This is where we can use the ATR to determine which assets are riskier, by calculating their ATRP.
ATRP stands for Average True Range Percentage, and is the percentage representation of ATR. In order words, the ATRP shows how much, in percentage, an asset is likely to move from its current price in either direction.
Here’s how the formula looks:
ATRP = (ATR / Price) x 100
So, if an asset is currently priced at $300, and yet the ATR says $50, that means the ATRP is currently at 16% – and price may move 16.6% up or down from its current value.
By weeding out assets with extreme volatility, we can avoid trading unpredictable or risky assets. Conversely, there will be traders who use the ATRP to find high-volatility assets to trade. So this is a great tool to either weed out unpredictable/risky assets or actively seek them out to trade.
Advantages of The ATR
Here are some benefits the ATR provides to a trader:
- Improves Risk Management: Using the ATR can be extremely helpful in setting stop losses which have a reduced likelihood of being taken out. The ATR can also be used to set take-profit targets.
- Identifying Market Volatility: The ATR can inform traders of highly volatile market environments, and warn them to stay out if they are not confident in trading them.
- Adaptable to Many Trading Systems: While the ATR does not provide entry signals, it can be adapted to many trading systems as an advisor on where to place a stop loss / take profit.
Disadvantages of The ATR
Here are some drawbacks the ATR has as an indicator:
- Can be a hassle to use: While the ATR indicator is simple to read, you still need to manually calculate where exactly to place a stop loss or take profit.
- Lagging, non-directional indicator: The ATR is a lagging indicator that cannot provide predictions of where the price will go next, or how volatile it may become in the future.
- Need to optimise for best results: While the ATR is fantastic for setting a stop loss, especially when using the ATR x 2 method, it is not optimised for all assets and timeframes.
ATR vs Bollinger Bands: Different Ways to Measure Volatility
The ATR and Bollinger bands are often compared as indicators that measure volatility. They are quite different in their use-case, and how it’s displayed on your price charts.
In short:
- The ATR provides an average measurement of volatility and is primarily used to set exit signals.
- The Bollinger bands visually show zones where the price is likely to reverse if reached.

The ATR is calculated by finding the true ranges across a set number of candlesticks. This is in contrast to the Bollinger bands, which help find potential reversal zones by mathematically calculating standard deviations based on the 20 SMA.
In practice, the ATR is mostly used to provide exit signals in the form of a stop loss or take profit. By itself, the ATR does not provide trade signals.
In contrast, the Bollinger bands can provide both entry and exit signals. For example, traders can enter a long trade at the lower band, targeting the 20SMA and upper band. Vice versa, a short position can be entered at the upper band, targeting the 20SMA and lower band.
Both indicators are lagging, and therefore will share a similar weakness in that a sharp powerful move can disrupt their accuracy. However, they are still invaluable tools traders can add to their technical analysis, and get a better read on the markets.
FAQ
What are the best ATR settings?
By default, the ATR is smoothed using the RMA, and set to calculate across 14 candlestick periods. Most traders utilise these settings for assistance in setting a stop loss and take-profit price level.
However, the best ATR settings will depend on your strategy, the time frame you are using, and the asset you are trading. The founder of the ATR, J. Welles Wilder Jr. preferred using the 7 period himself.
How reliable is ATR?
The ATR is extremely reliable as a measure of detecting existing volatility. But keep in mind that you cannot use it as a reliable predictor of future volatility, or price action.
As an indicator to determine your stop loss and take profit, the ATR is generally very effective especially when you give your trade room to withstand the market’s normal inhaling and exhaling. However, for the most optimal results, you may want to adjust the ATR to find which works best for the asset, time frame, and strategy you are trading.
Is ATR leading or lagging?
ATR is lagging, as it draws data from historical data, and does not offer additional insights such as divergences. A good example of this would be RSI divergence, which provides clues to traders on when a reversal is about to take place.


