Bullish
- December 31, 2024
- 24 min read
Piercing Line Pattern – A Comprehensive Guide for Traders
What is the Piercing Line Pattern?

A piercing line is a bullish reversal pattern marking the possible end to the prevailing downtrend as bullish momentum builds up. The pattern is composed of a long bearish (red) candlestick followed by a bullish (green) candle that closes above the midpoint of the first candle’s body. At its core, the bullish piercing pattern formation reflects an unexpected shift in market sentiment, where the first candle—a long bearish candle—and the gap-down opening of the second candle initially signify a continuation of the bearish trend. However, a swift and decisive buying pressure pushes the second candle to regain much of the previous day’s losses within a single trading period.
How to Identify the Piercing Line Pattern?
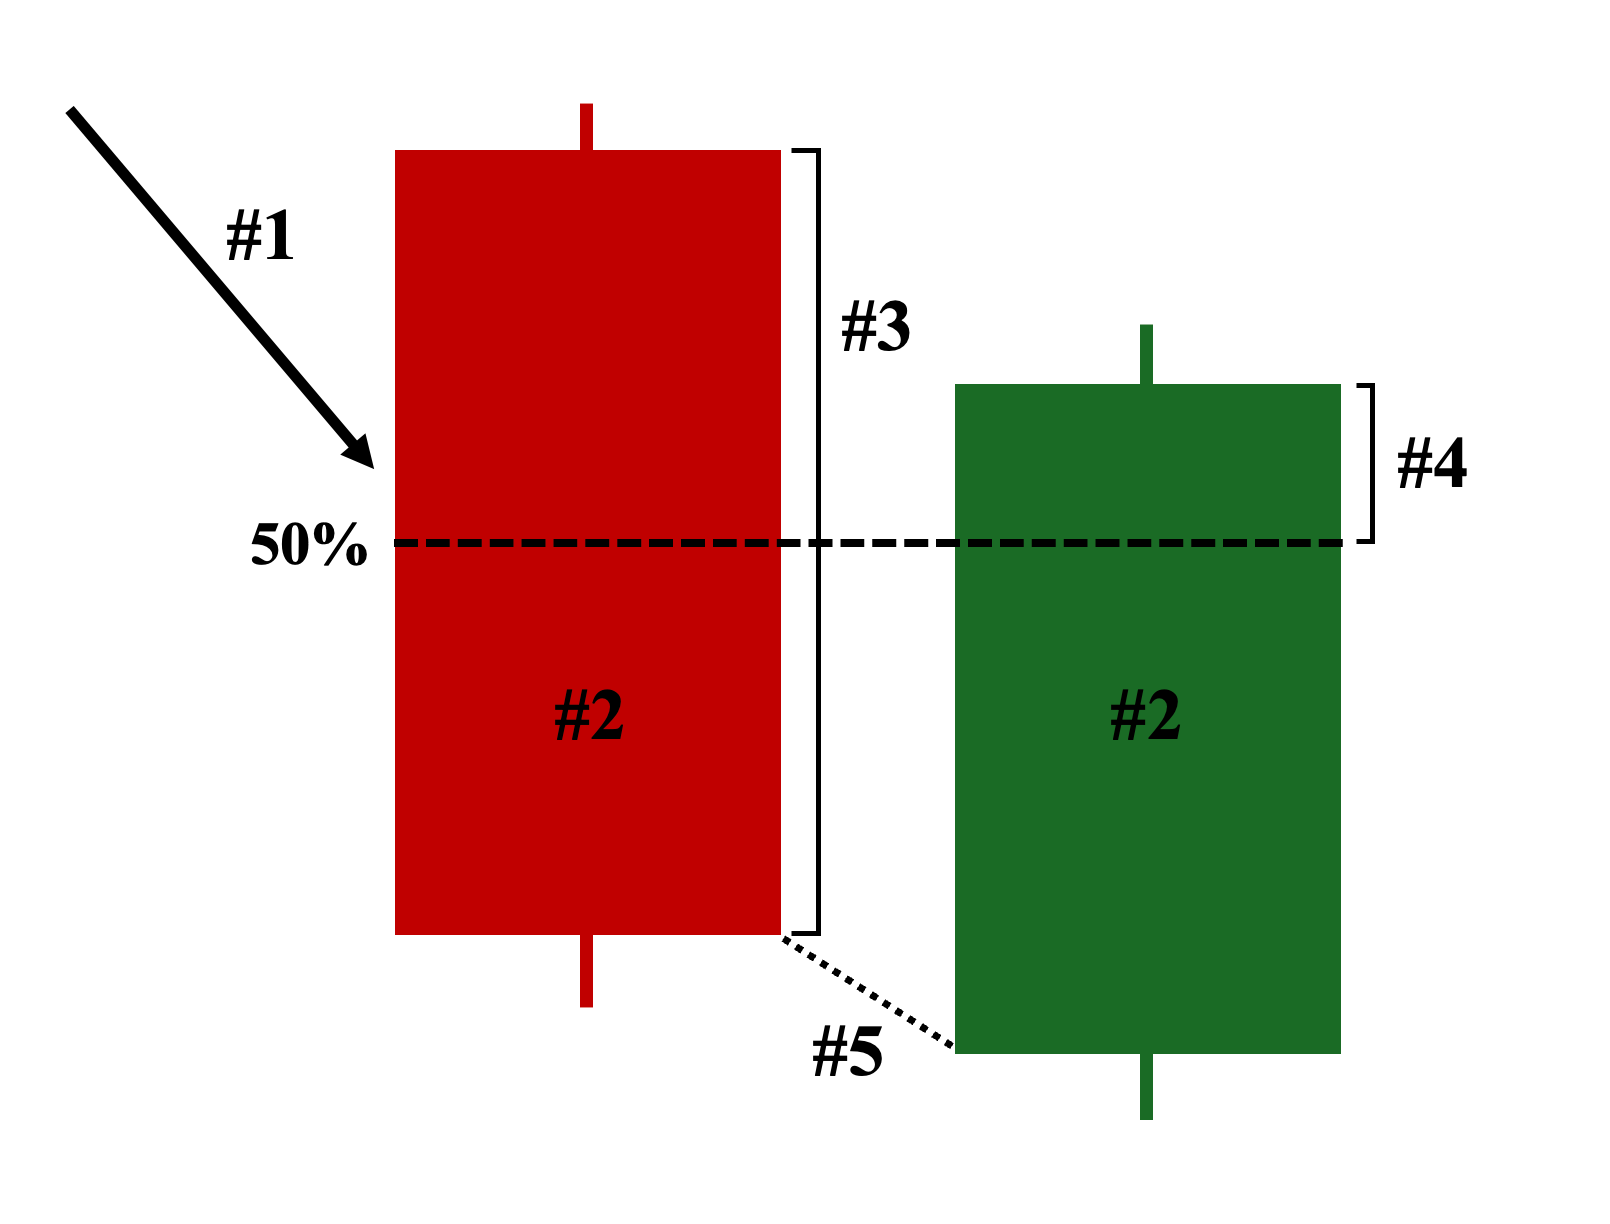
Here are the five key characteristics of a valid piercing line candlestick pattern on a price chart:
- Position on the Chart – The two candlesticks must appear at the bottom of a prevailing downtrend.
- Color: Depending on your chart settings, the first candle must be red or black, and the second candle must be green or white.
- First Candle: A bearish (red) candlestick with a relatively large body, preferably with short or no shadows.
- Second Candle: A bullish (green) candle that closes above the midpoint (50%) of the first candle’s body.
- Gap Up: The second candle’s opening price must be lower than the closing price of the first candle, creating a noticeable gap, which initially suggests a continuation of the ongoing bearish trend, only to be overwhelmed by bullish momentum and fail by closing above the midpoint of the first candle.
Piercing Candlestick Pattern Examples
Below are three unique trading scenarios illustrating the piercing line candlestick pattern on a price chart:
Example 1: Successful Trend Reversal Scenario (Downtrend to Uptrend)
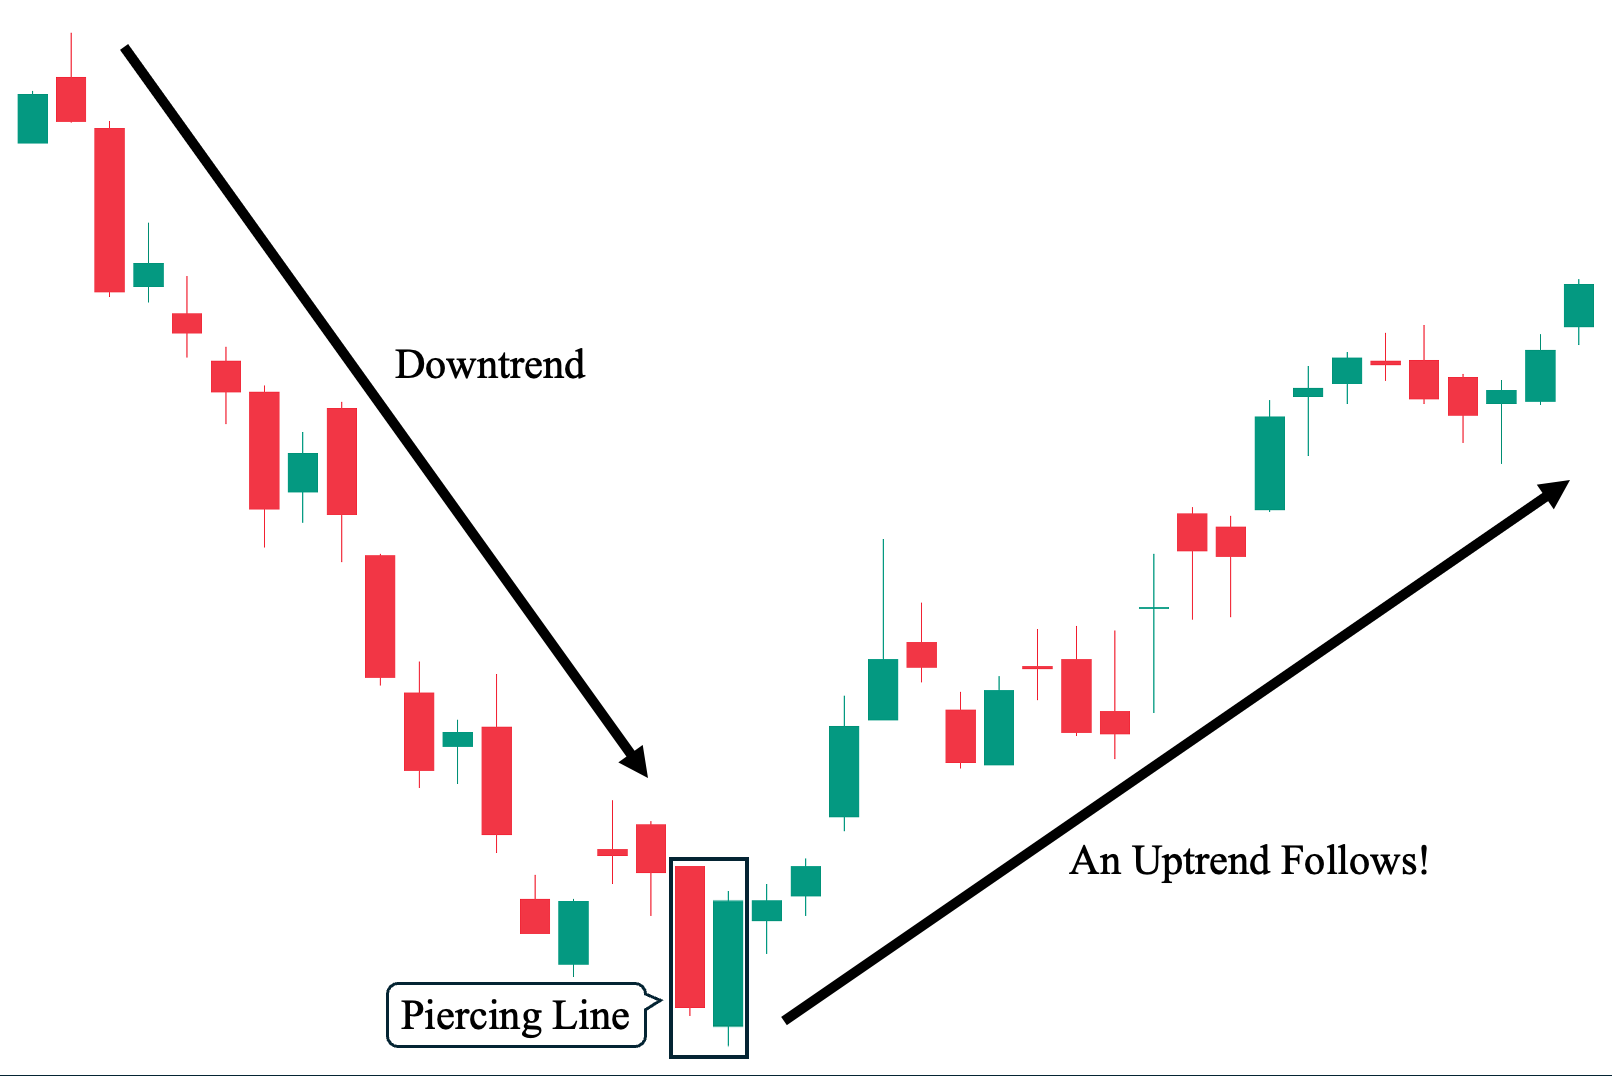
This first example demonstrates the most ideal scenario when trading the piercing line pattern. As shown, there was a steep downward trend, illustrating the strong selling pressure due to the overwhelming bearish sentiment. At the bottom, we can see the pattern emerges when a long bearish candlestick made a new low but was immediately followed by a long green candle closing above the midpoint of the preceding candle. This marks an unexpected shift in market sentiment, especially considering that the pattern’s second candle has a bearish opening price (opening lower than the previous candle’s low, creating a gap down and initially suggesting a continuation of the downtrend). Ultimately, the piercing line successfully served as a trend reversal candlestick signal as an upward trend soon developed.
Example 2: Failed Trend Reversal Scenario (Downtrend Continues)
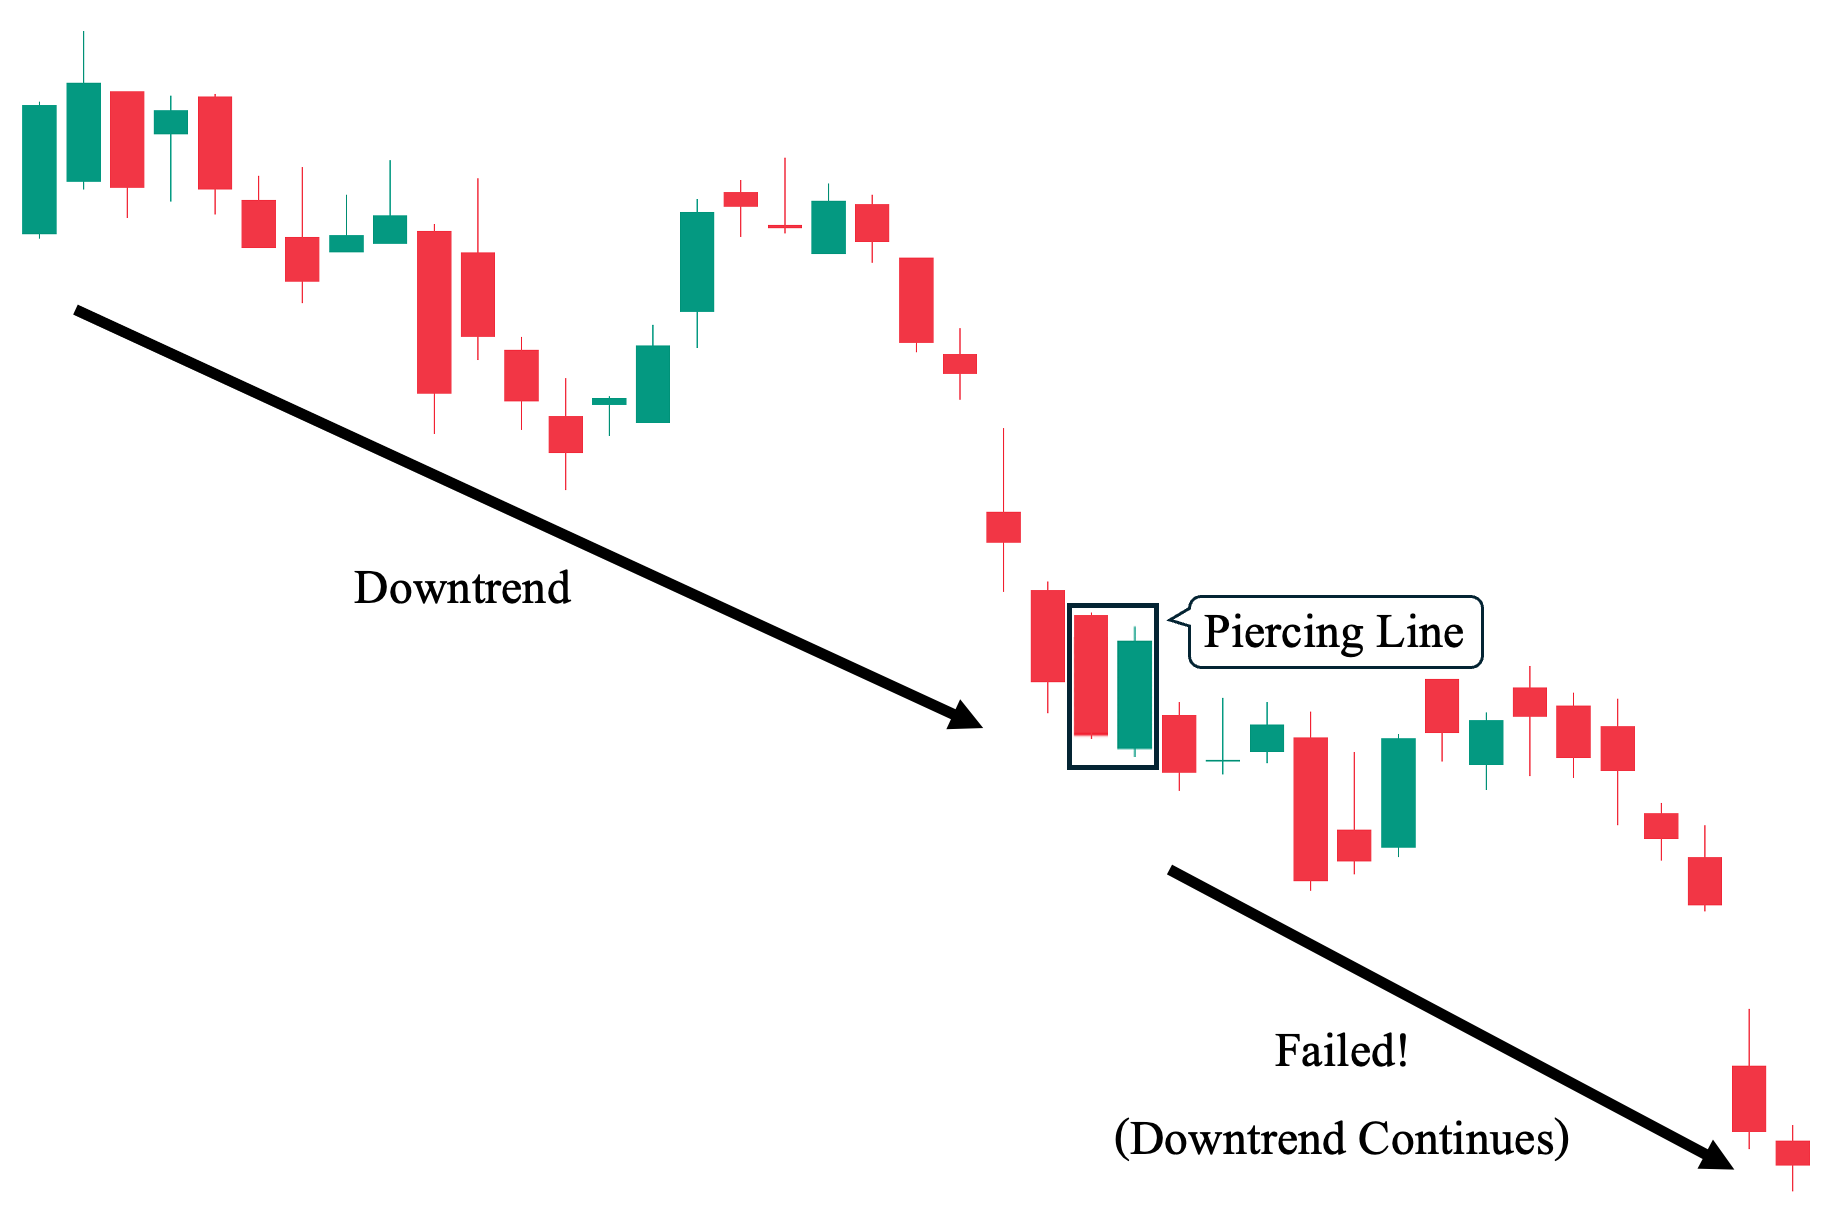
In contrast to our first example, this second scenario shows how the piercing line pattern—like any other candlestick pattern—can also fail to lead to a successful trend reversal. Just like our first example, we can see a downward trend displaying the strong selling pressure before the piercing pattern emerges (where a long bearish candlestick is followed by a long green candle opening lower but ultimately closing above the midpoint of the preceding candle). However, while this setup could have marked a shift in market sentiment—potentially leading to an upward trend, just like in the first example—it failed to materialize and the downward trend continued.
Example 3: Indecisive Outcome Scenario (Shifts to Non-Trending)
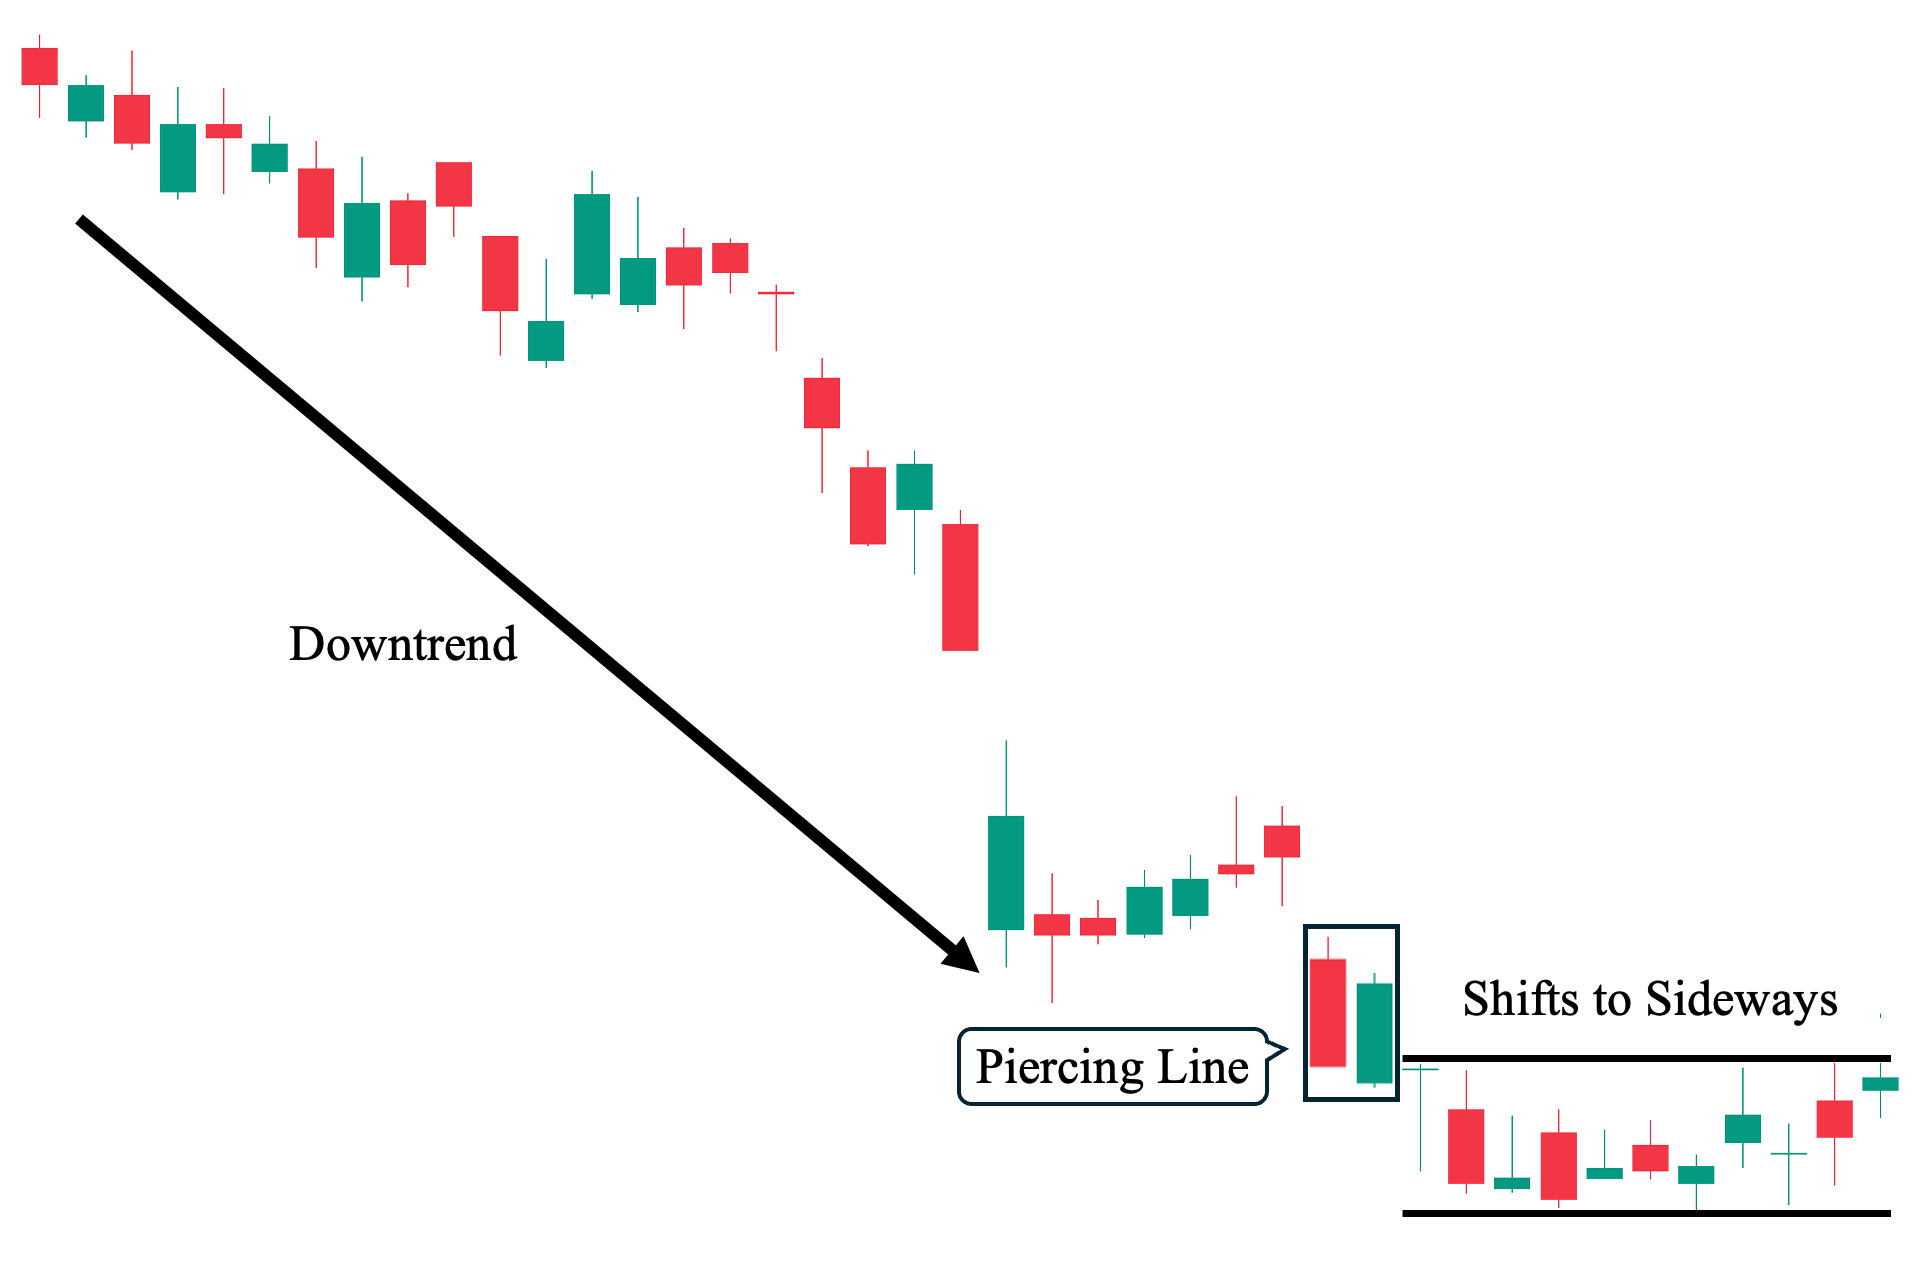
Lastly, this third scenario demonstrates how the piercing line pattern can also lead to a non-trending market movement. As shown, similar to our first two examples, we observe a clear downward trend, illustrating strong selling pressure and an overall bearish market sentiment. Yet, when the pattern emerges, it neither leads to a successful reversal (i.e., towards an upward trend) nor continues with the previous downward price trajectory. Instead, a series of relatively small, sideways-moving candles followed the pattern. This scenario suggests either dwindling market interest or a possible “pause” before a decisive move in either direction.
Piercing Pattern Trading Strategies
The following are various ways you can incorporate the bullish piercing pattern with the following technical analysis tools to make more informed trading decisions:
Piercing Pattern as a Bullish Reversal Signal on Naked Chart
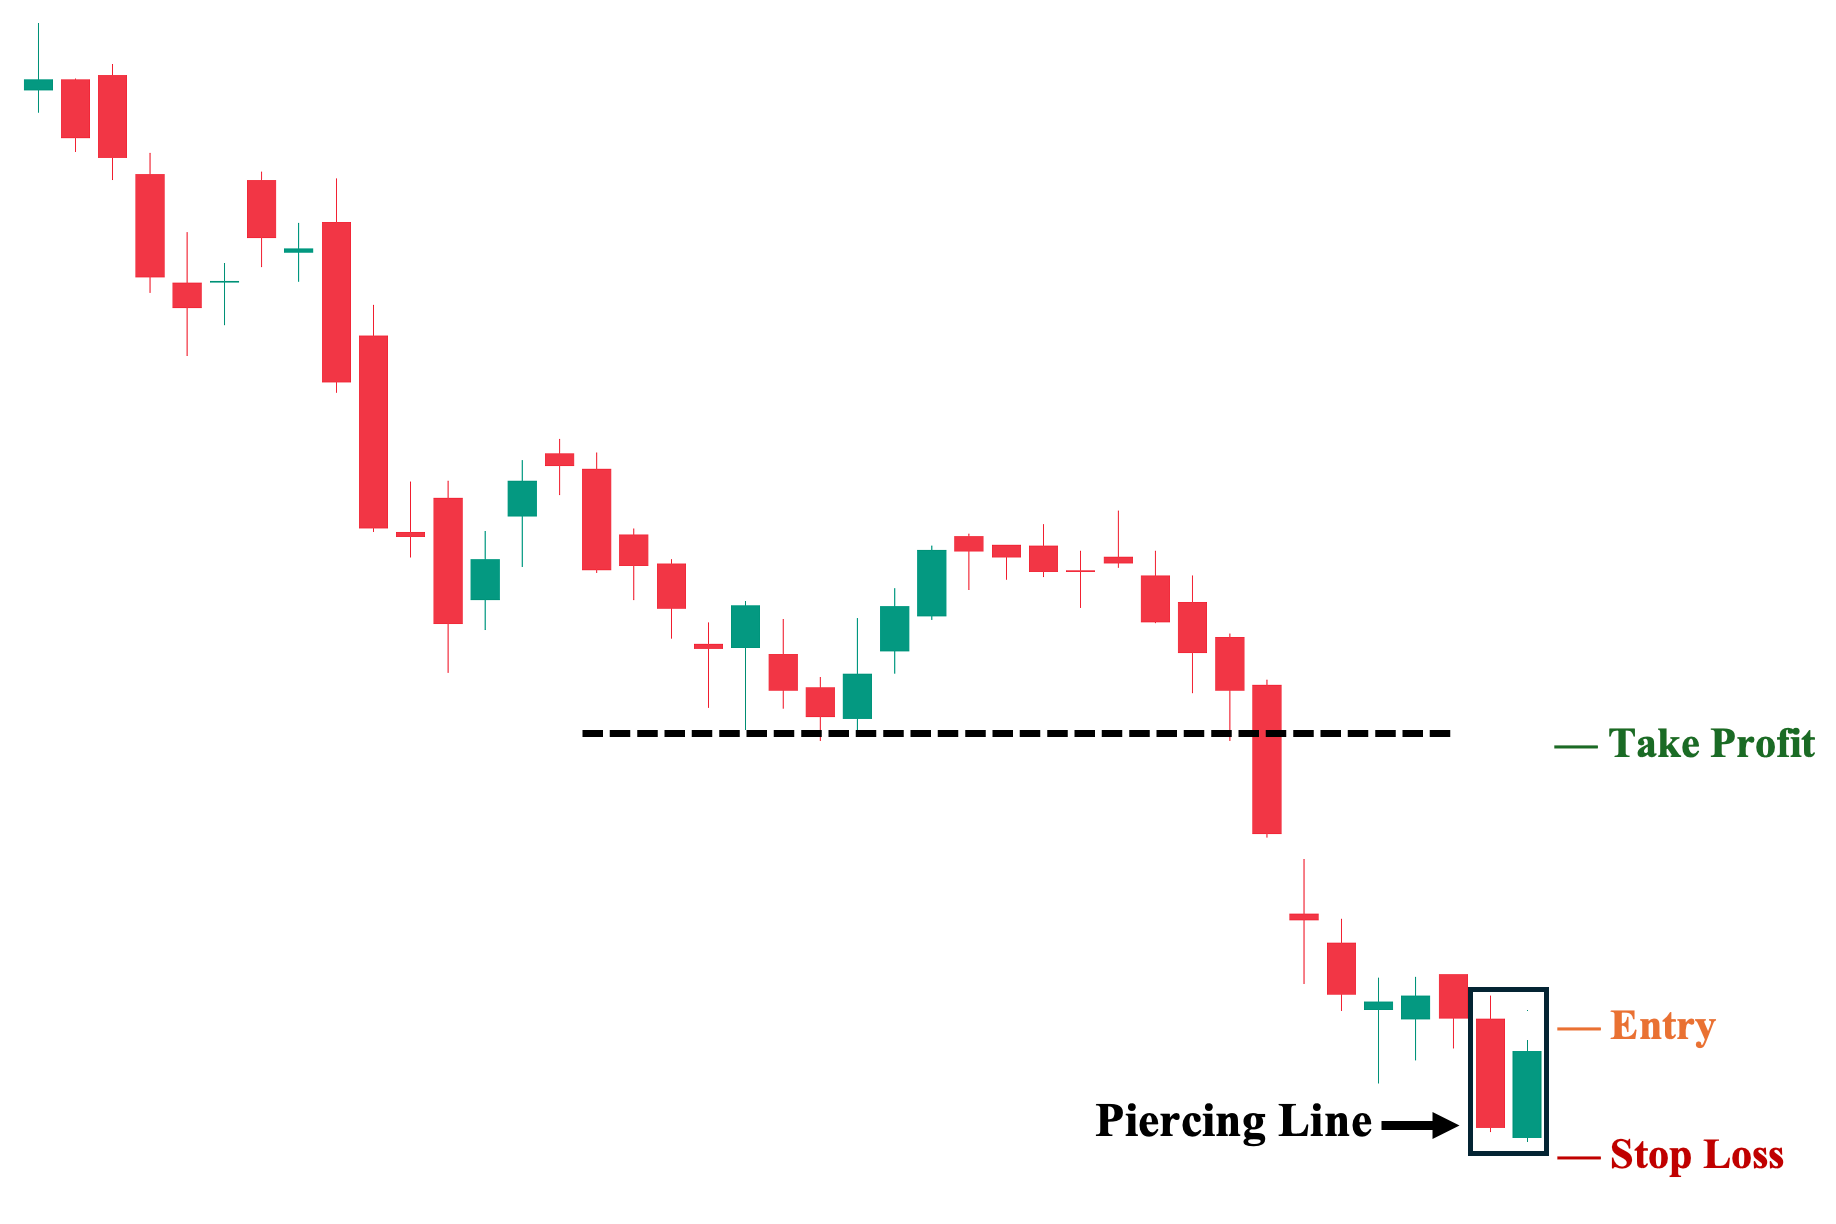
Firstly, we can use the bullish piercing line pattern on a naked chart, free of any additional technical analysis tools (i.e., technical indicators). This approach represents one of the most basic trading strategies, as it relies solely on the pattern itself for our trading decisions, unlike strategies that incorporate supplemental technical analysis tools or other technical indicators to confirm or validate the piercing pattern formation.
To illustrate, we observe the bullish piercing line pattern forming at the bottom of an established downtrend (bearish trend), where a long bearish candlestick is followed by a long bullish candle that initially opens below the low of the first candle but ultimately closes above its midpoint. Since this setup meets all five characteristics discussed in the “How to Identify the Piercing Line Pattern” section, we could consider taking this trade.
1. Entry: A few ticks above the high of the pattern’s second (bullish) candlestick.
2. Stop Loss Point: Set your stop loss a few ticks below the low of the pattern’s second candle.
3. Take Profit (TP) Level: Set your TP a few ticks just below the nearest key structural level. In this case, the downtrend’s previous support level (which now serves as a potential key resistance area if the piercing pattern materializes).
4. Risk-Reward Ratio: The risk/reward ratio must be at least 1:1. We do not recommend taking trades with a ratio below this in any trading situation. The higher the potential reward relative to the risk, the better. Nevertheless, ensure you use an objective approach when setting your TP and SL levels rather than inflating them artificially.
Piercing Pattern with Key Structural Price Levels (Support & Resistance)
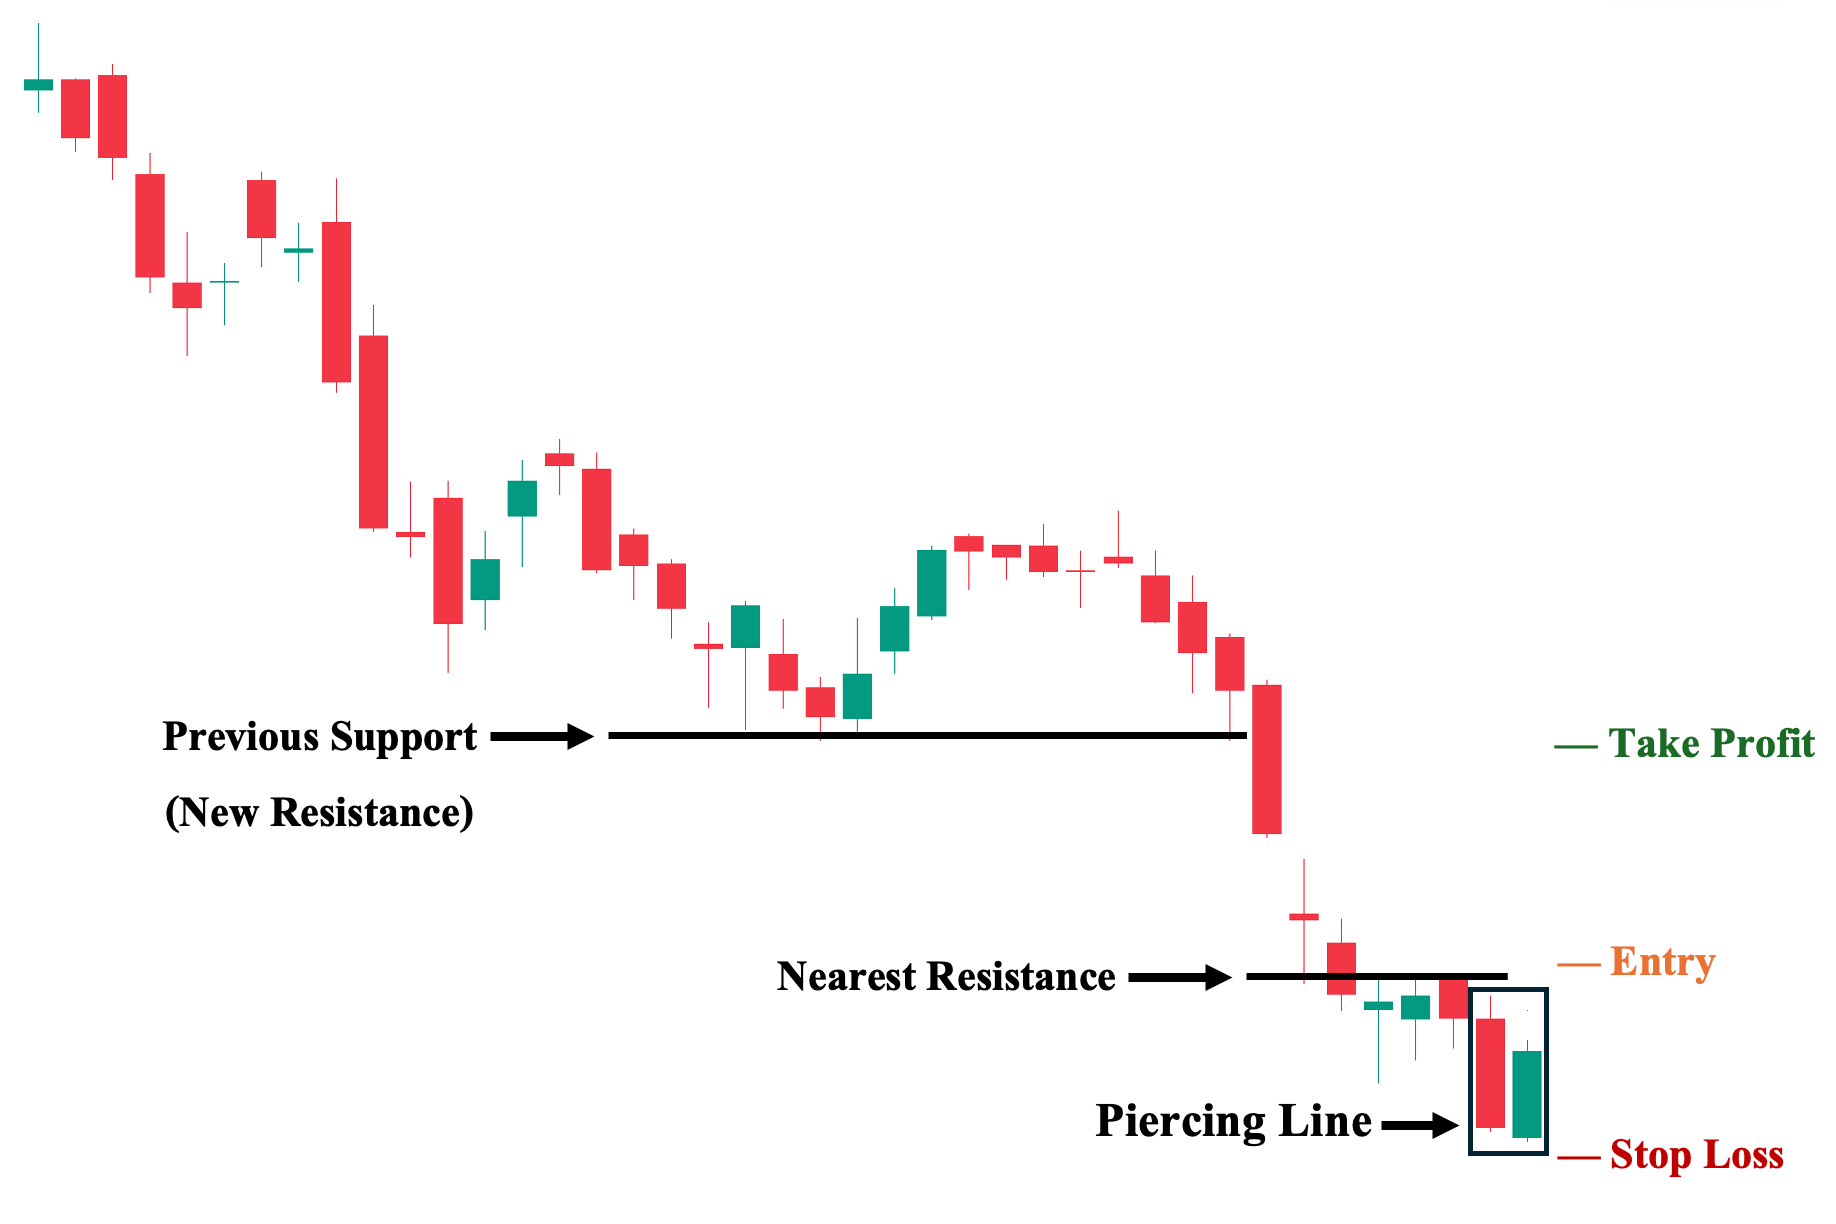
Second, building on our initial approach of considering only the piercing line pattern for trade decisions, a more nuanced method would involve analyzing the overall market structure (i.e., key structural price levels) where the candlestick pattern formed. In technical analysis, these key price levels are known as Support (a price level where buyers may start to come in to stop the price from falling further) and Resistance (a price level where sellers prevent the asset from moving up further). Other technical indicators, as we will explore in the following trading strategies, can also generate these levels automatically.
To illustrate, let’s examine the same price chart from our first approach, this time with an emphasis on key structural levels where price may react. As shown, there is a potential resistance level near the bullish piercing line pattern. If unbroken, this level could prevent further upward movement of the pattern. This is because the overall market structure generally holds more influence over price action than any single candlestick pattern, including the piercing line. Hence, for a more conservative entry, we can place a buy order only after this level has been broken.
1. Entry Point: A few ticks above the nearest resistance level (price must first close above this level to confirm the bullish reversal).
2. Stop Loss Point: Set your stop loss a few ticks below the pattern’s second (bullish) candle.
3. Take Profit (TP) Level: Set your TP a few ticks below the nearest key structural support level. In this case, the downtrend’s previous major support level (which serves as a potential key resistance area if the subsequent price action following the bullish piercing pattern breaks the nearest resistance level, as shown above).
4. Risk-Reward Ratio: The risk/reward ratio must be at least 1:1. We do not recommend taking trades with a ratio below this in any trading situation.
Piercing Pattern with Moving Averages (MAs)
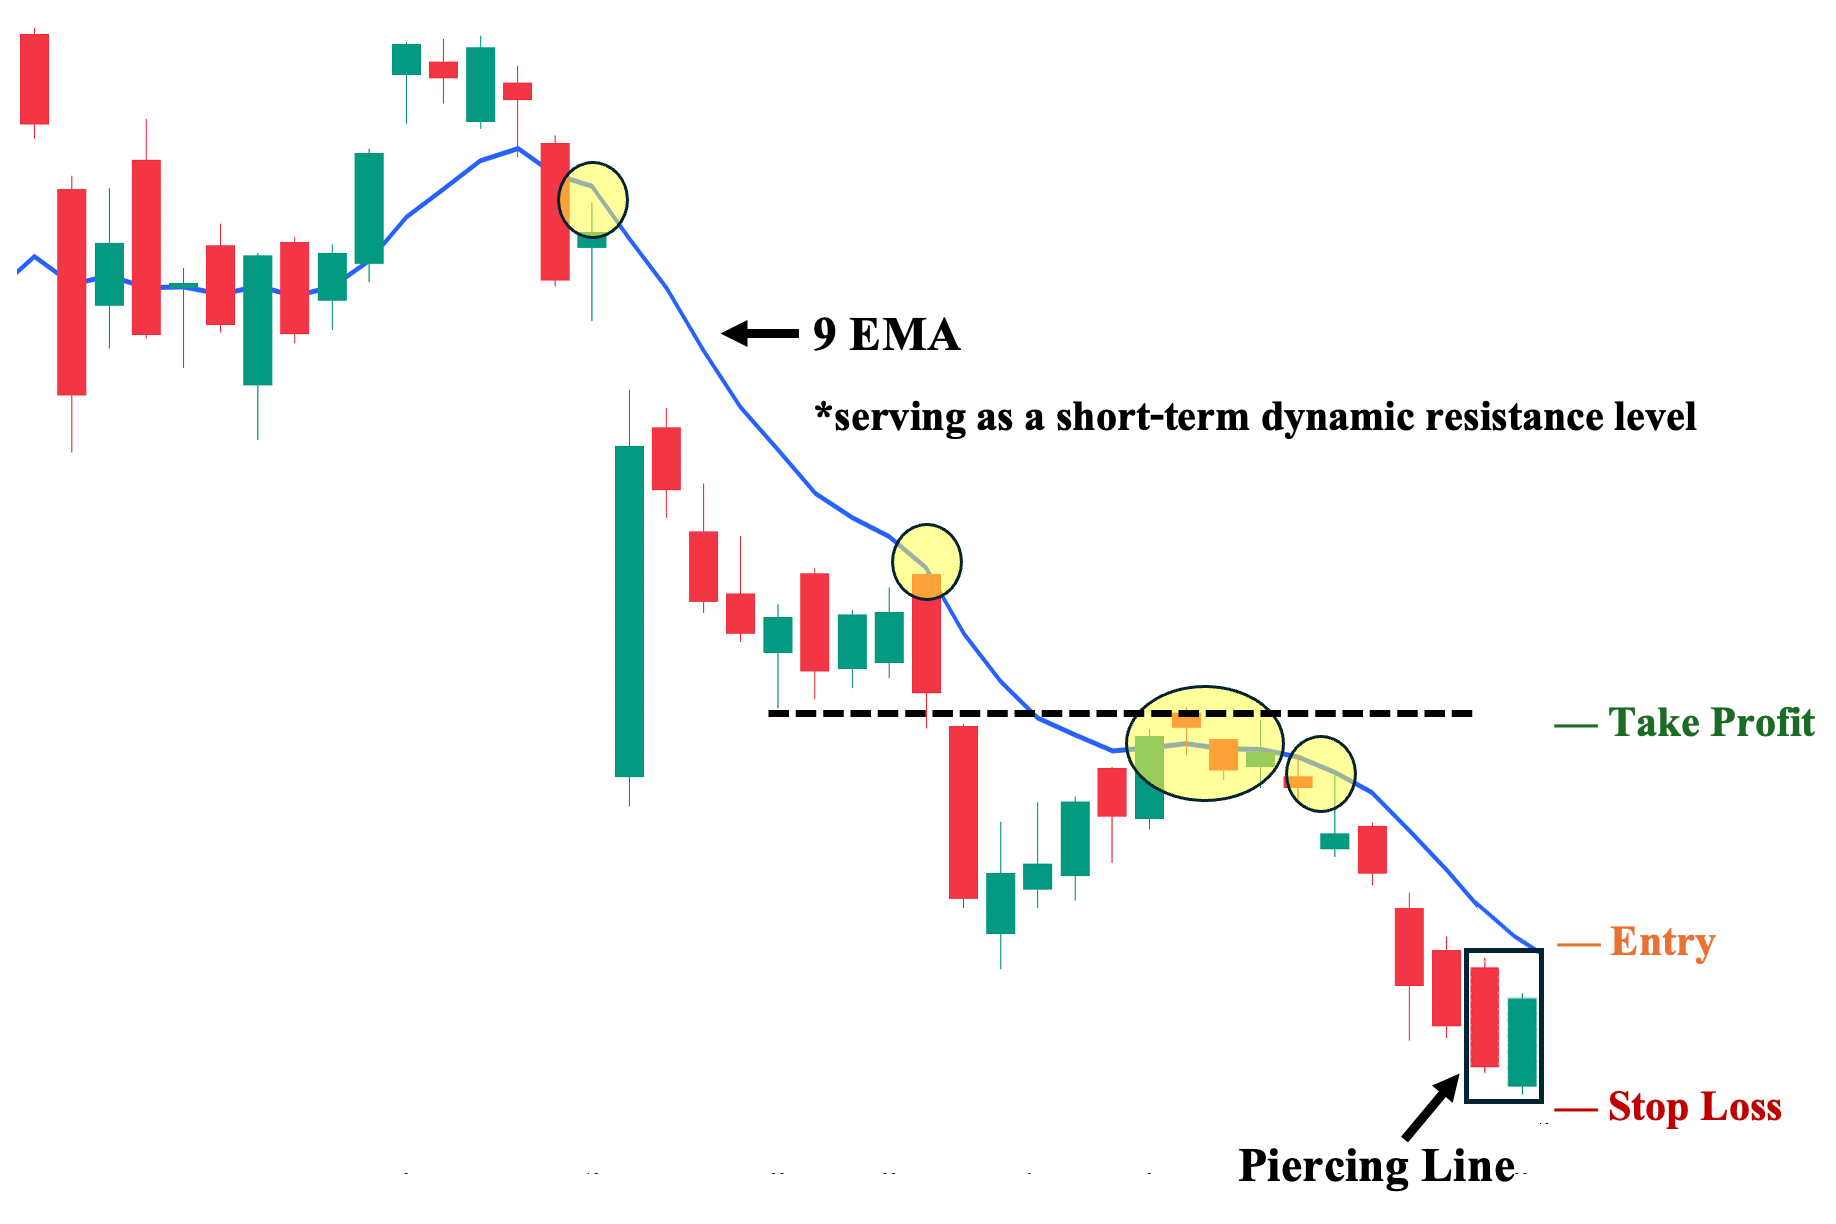
Third, as one of the most widely used tools in technical analysis and a foundation for other technical indicators (e.g., MACD, Bollinger Bands), Moving Averages (MAs)—especially appropriately tuned ones—can be an effective confirmation tool to validate and support the potential reversal signal from the piercing line pattern. It is essential, however, to ensure that the MA you select aligns with the specific trade setup. Generally, longer time frame MAs (e.g., 50 & 100 SMA, 50 & 100 EMA) are ideal for longer-term trade setups, while shorter MAs (e.g., 9 & 20 SMA, 9 & 20 EMA) work better for shorter-term setups, and can enhance the reliability of candlestick formations, such as the piercing line.
To illustrate, let us use the 9-period exponential moving average (EMA) to serve as a short-term dynamic resistance level. We can validate if this is an appropriate MA by observing how the price reacts near or at its level. As shown, the 9 EMA successfully acted as resistance during the ongoing downtrend (bearish trend), preventing prices from rallying above it. Therefore, we can use it as a confirmation tool for the validity of the piercing line pattern. If the price breaks above the 9 EMA after the pattern emerges, this suggests even more bullish sentiment, increasing the likelihood that the pattern will lead to a successful trend reversal.
1. Entry Point: A few ticks above the 9 EMA (the price must close above this dynamic resistance level first).
2. Stop Loss Point: Set your stop loss a few ticks below the low of the pattern’s second (bullish) candle.
3. Take Profit (TP) Level: Set your TP a few ticks below the nearest key structural level.
4. Trailing Stop: Once in the trade, sell if the price closes below the 9 EMA before reaching your TP, as this signifies a likely renewed bearish momentum.
5. Risk-Reward Ratio: The risk/reward ratio must be at least 1:1. We do not recommend taking trades with a ratio below this in any trading situation.
Piercing Pattern with Relative Strength Index (RSI) Divergence
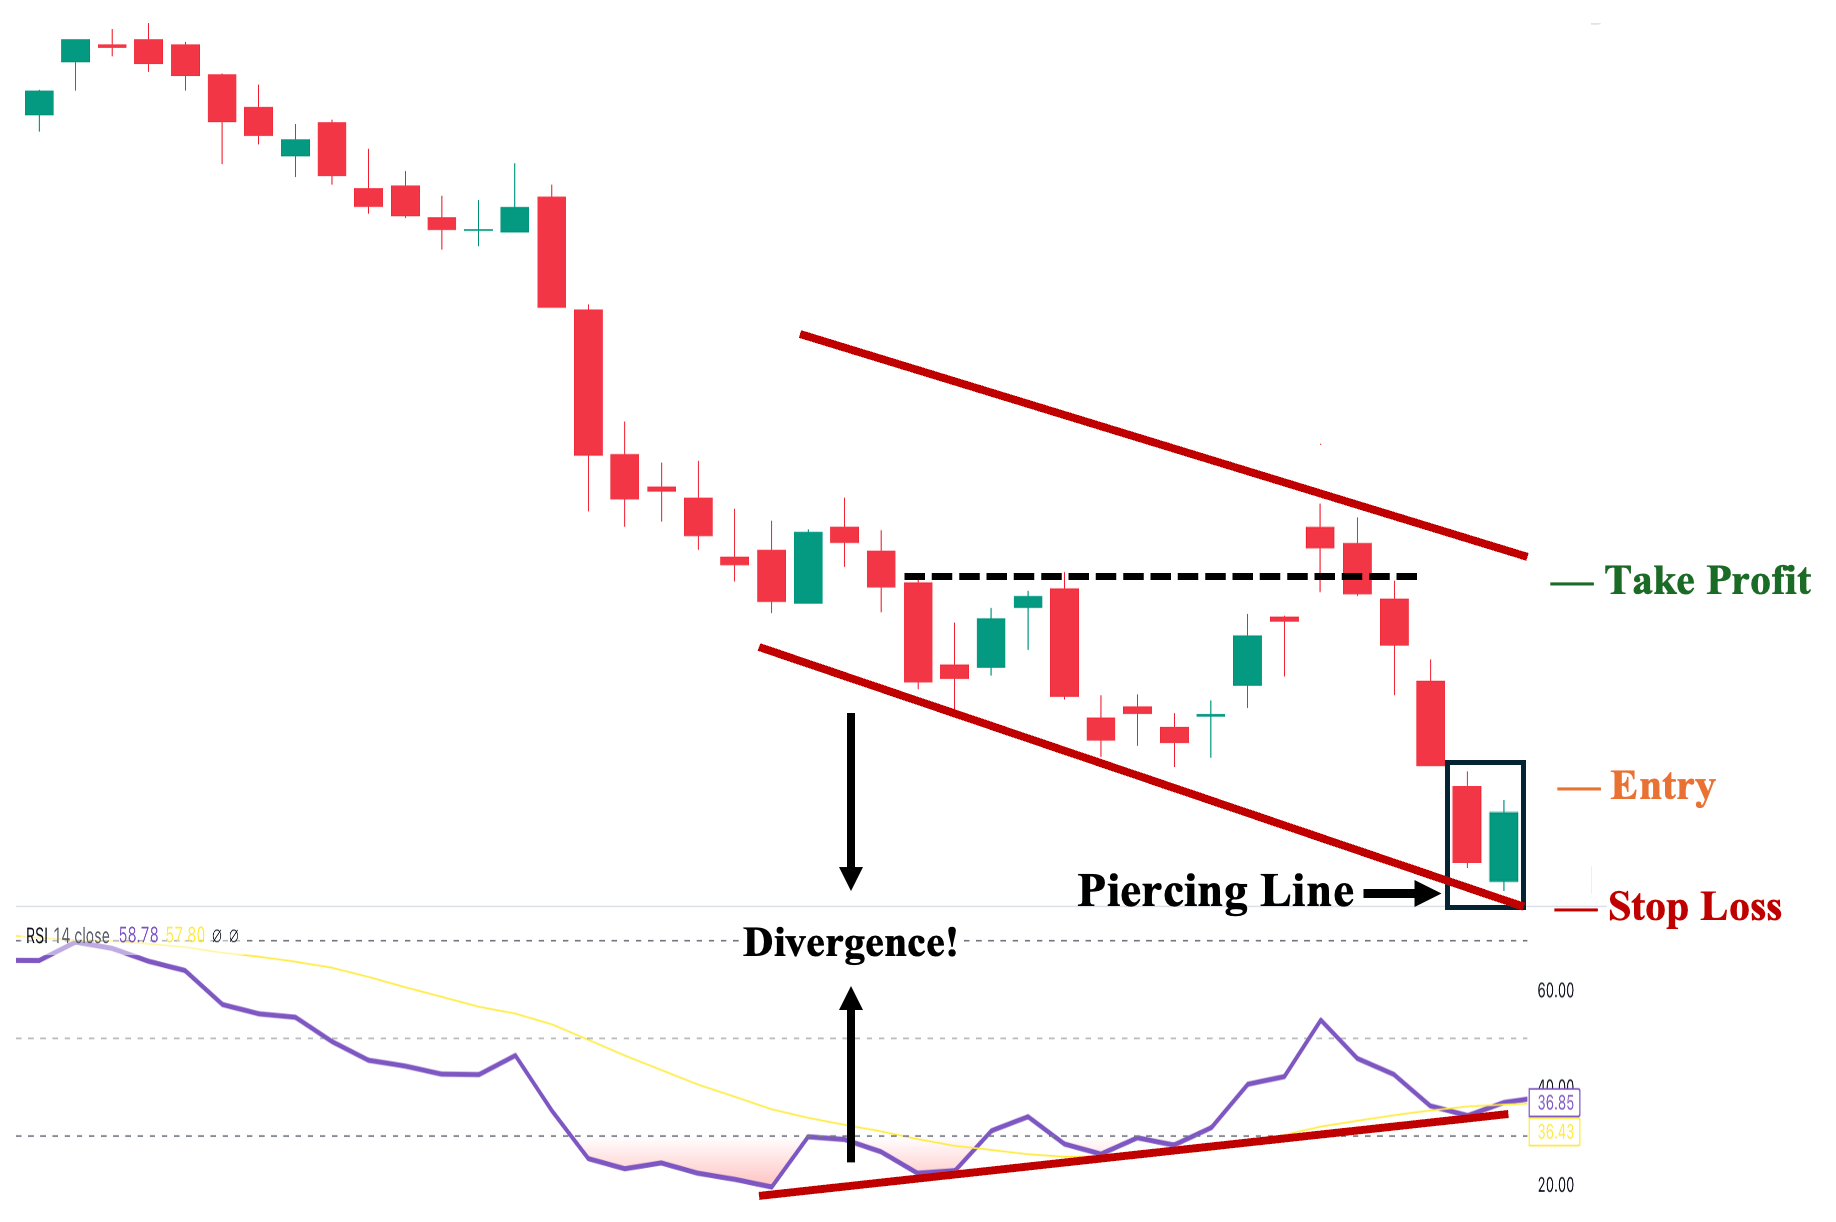
Fourth, the Relative Strength Index (RSI) is one of the most widely used oscillator indicators, signaling the strength of momentum in a price move. On top of its primary function as an oscillator, it can also act as a “leading” indicator of a potential reversal by providing a “divergence” signal. Simply put, divergence happens when the price and RSI move in opposite directions. In technical analysis, this often indicates that the price will likely follow the RSI’s direction, which is why it is considered “leading.” In addition, RSI divergence is regarded as one of the most reliable confirmation tools, generating significantly fewer false signals compared to other technical indicators.
To illustrate, we can observe above a strong downtrend before the appearance of the piercing line pattern. However, looking at the RSI reveals a divergence between it and price. This is because while the price forms lower highs and lower lows (as evidenced by the downward-sloping channel lines), RSI forms higher highs and higher lows. Hence, these opposing trend lines indicate a clear divergence. That said, the emergence of a piercing line pattern in this context serves as a confirmation of the strong reversal signal indicated by the divergence and represents a potential starting point toward an eventual uptrend. Overall, the divergence and piercing pattern points to an even more bullish sentiment for the reversal to happen.
1. Entry Point: A few ticks above the high of the pattern’s second candle.
2. Stop Loss Point: Set your stop loss a few ticks below the low of the pattern’s second (bullish) candle.
3. Take Profit (TP) Level: Set your TP a few ticks below the nearest key structural level.
4. Trailing Stop: Sell if the price and RSI diverge once again (the piercing line successfully materializes as a bullish reversal pattern, with the price moving upward when the RSI begins to point downward—a bearish signal).
5. Risk-Reward Ratio: The risk/reward ratio must be at least 1:1. We do not recommend taking trades with a ratio below this in any trading situation.
Piercing Pattern with Moving Average Convergence Divergence (MACD)
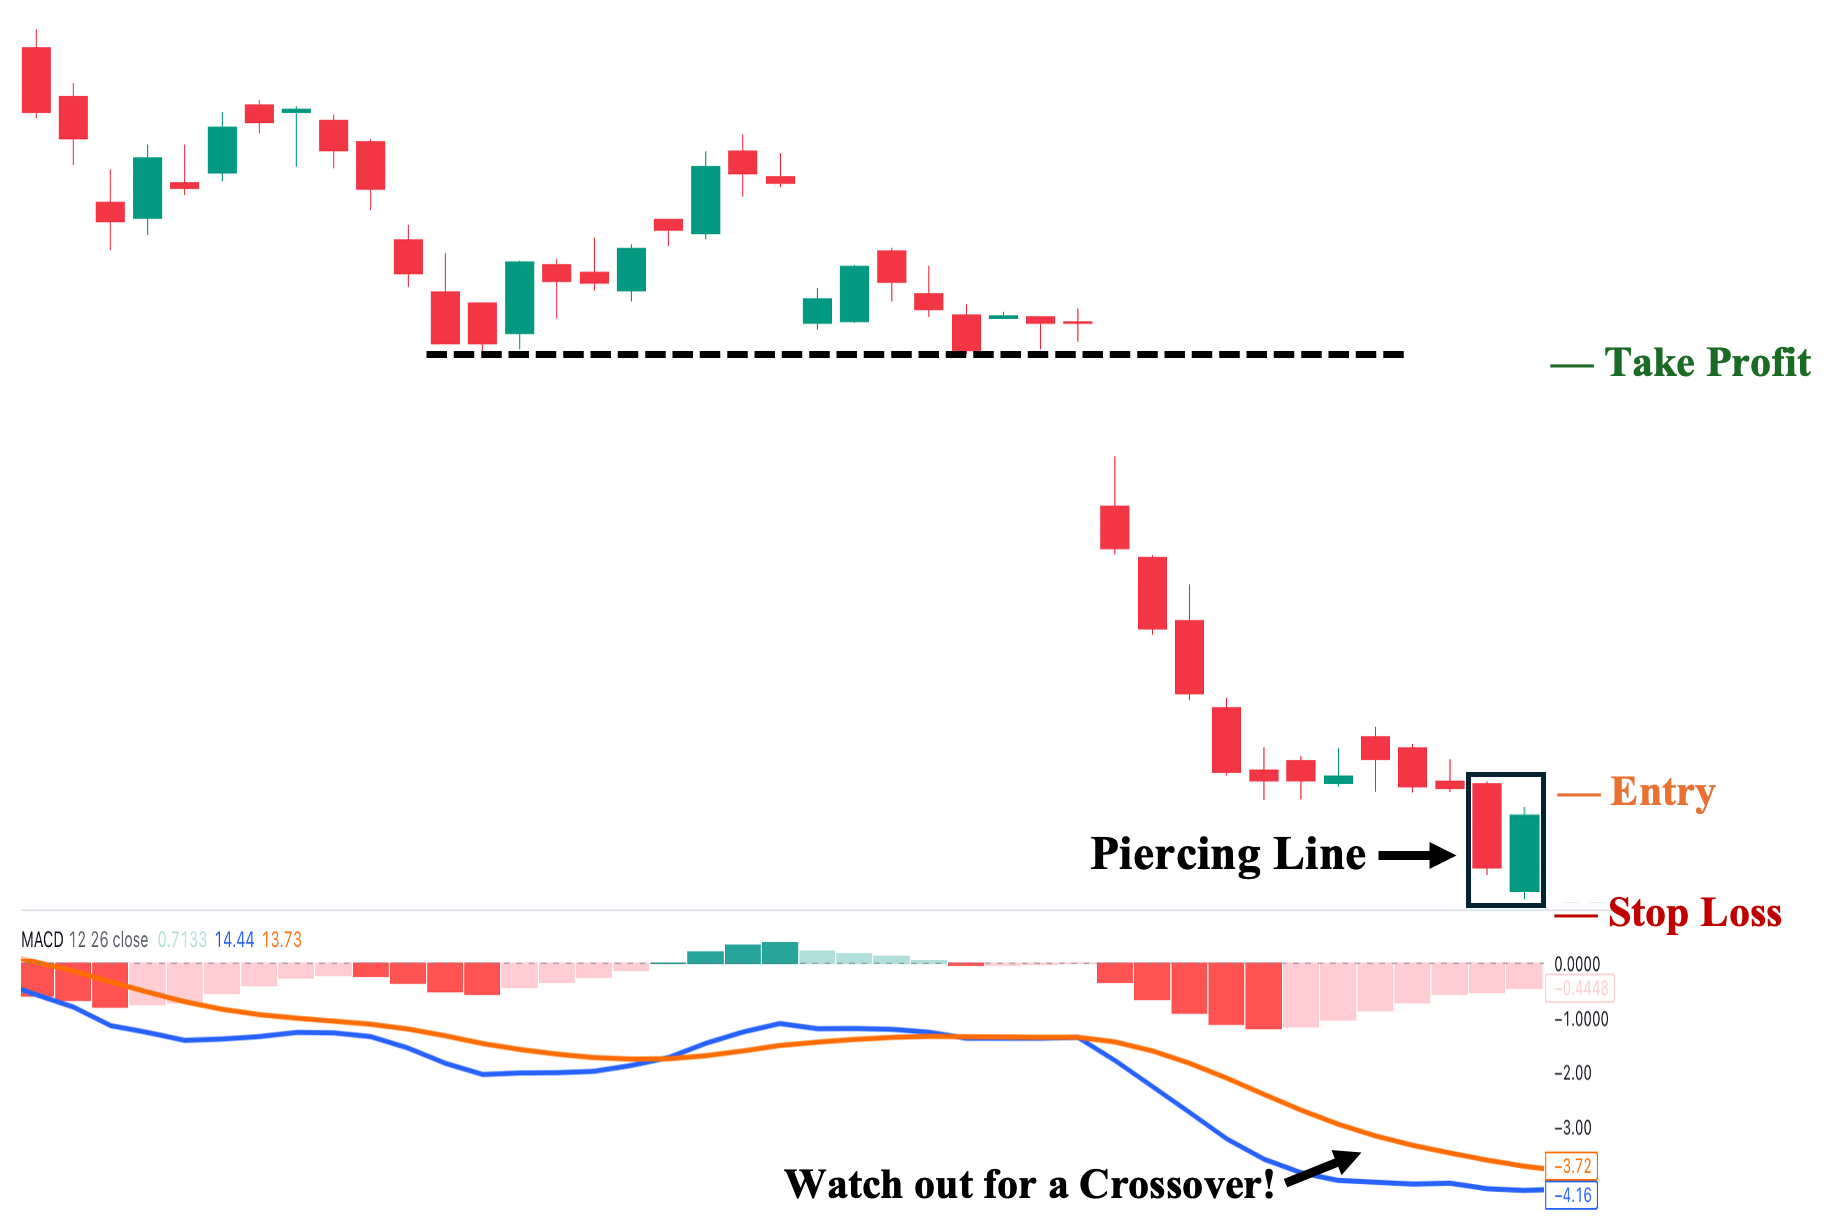
Fifth, the MACD is one of the most popular indicators derived from Moving Averages. Compared to other technical indicators, it primarily serves as a confirmation tool to validate the potential reversal signal of candlestick formations, like the piercing line pattern. In the case of a bullish reversal, we can use the MACD to watch for a “bullish crossover” after the appearance of the piercing line pattern. This crossover happens when the MACD (blue) line moves or crosses above the Signal (orange) line.
To illustrate, we observe a prevailing downtrend prior to the appearance of a piercing line pattern. When the pattern forms at the bottom of this downward trend, we can look at MACD for confirmation. Generally, we want the two lines (blue and orange) to at least begin to move closer when the pattern emerges. Then, for a conservative entry, we can wait for the MACD (blue) line to crossover above the Signal (orange) line before taking a long position. Nonetheless, as you can imagine, this will result in an inherent delay. In fact, in some cases, by the time the bullish crossover finally happens, the price may have already moved significantly, leaving you with a less-than-ideal entry point.
1. Entry Point: A few ticks above the low of the pattern’s second candle.
2. Stop Loss Point: Set your stop loss a few ticks below the low of the pattern’s second (bullish) candle.
3. Take Profit (TP) Level: Set your TP a few ticks below the nearest potential key structural level.
4. Trailing Stop: Sell if the orange line crosses above the blue line before hitting your TP (signaling a renewal of bearish momentum).
5. Risk-Reward Ratio: The risk/reward ratio must be at least 1:1. We do not recommend taking trades with a ratio below this in any trading situation.
Piercing Pattern with Fibonacci Retracement (Fib) Levels
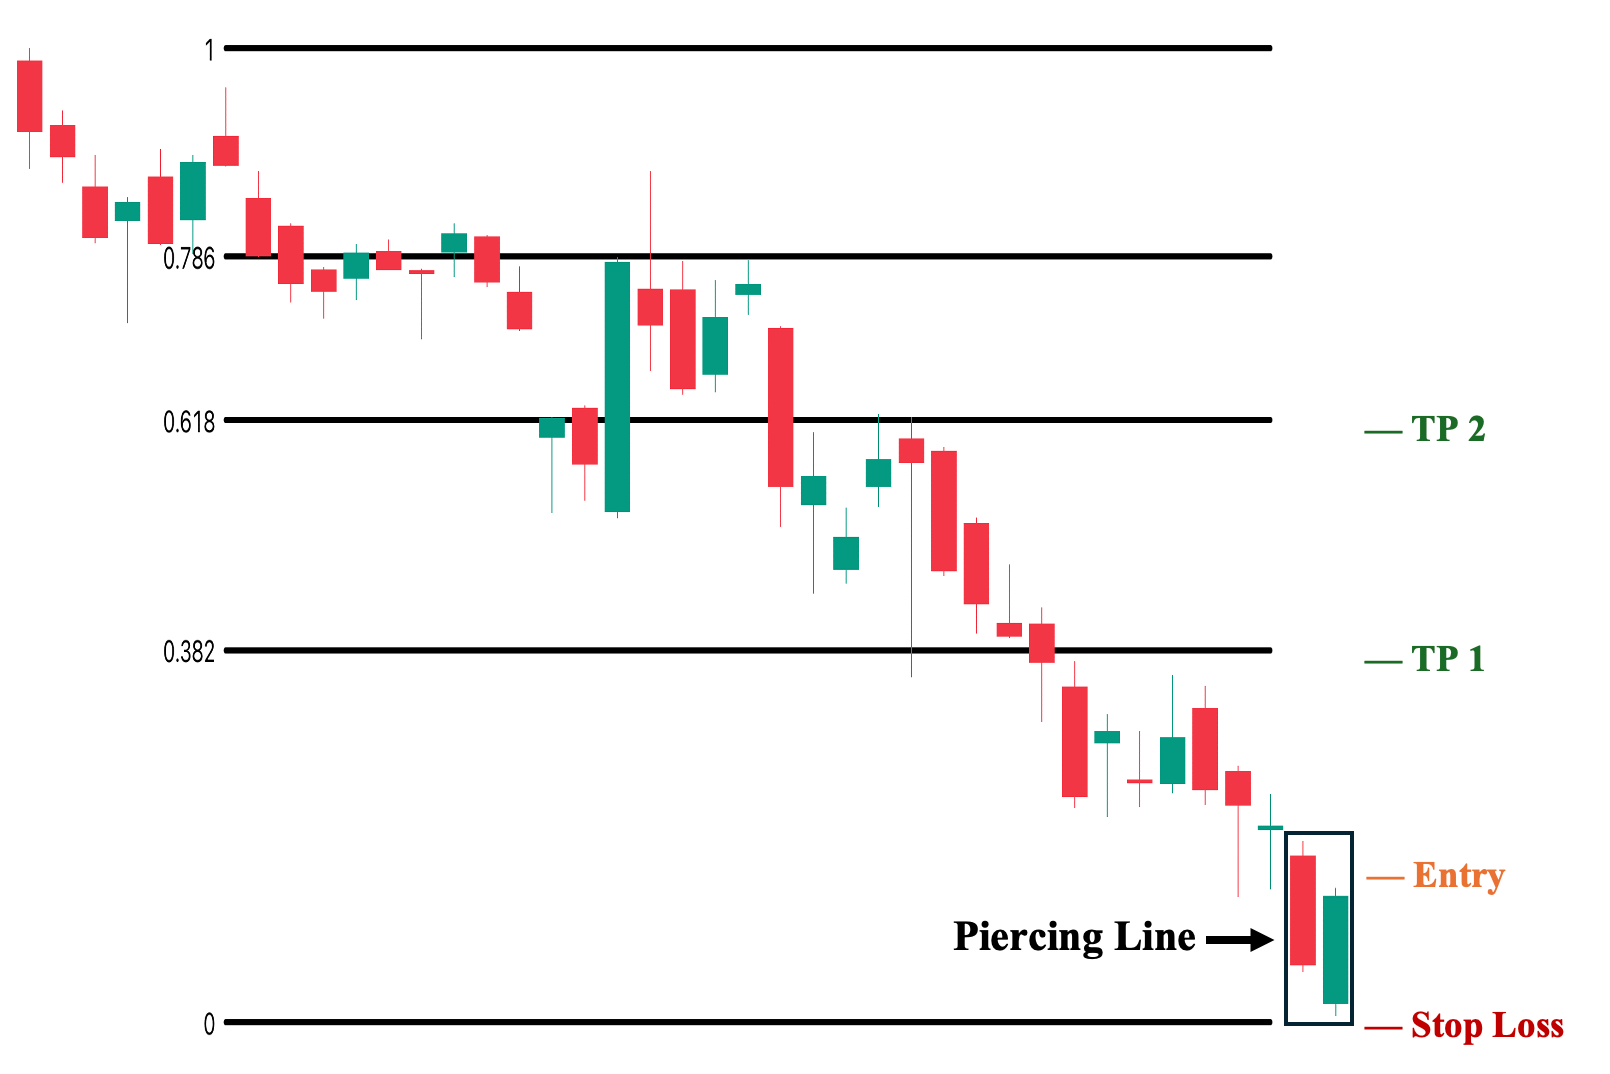
Sixth, unlike other technical indicators, Fib levels are primarily used after you have already decided to take a position. In technical analysis, Fib retracement levels often coincide with key structural price levels. Hence, it can be used as a complementary tool to identify these major key levels where price will likely react. In fact, some traders use it as the “de facto” support and resistance levels in their trade analysis.
To illustrate, we can observe the piercing line pattern emerging at the bottom of a prevailing downtrend. Assuming we identified this as a potential bullish reversal—either by analyzing market structure or using complementary technical indicators—we can then plot Fib levels to identify price areas where significant selling pressure might arise after the candle pattern materializes and lead to a trend reversal. This allows us to set target prices just before or around these levels.
1. Entry Point: A few ticks above the high of the pattern’s second candle.
2. Stop Loss Point: Set your stop loss a few ticks below the low of the pattern’s second candle.
3. Take Profit (TP) Level: If your strategy involves selling in tranches, you can set your first TP a few ticks below the nearest Fib level (0.382) and your second TP a few ticks below the next Fib level (0.618).
4. Risk-Reward Ratio: The risk/reward ratio must be at least 1:1. We do not recommend taking trades with a ratio below this in any trading situation.
Piercing Pattern with Pivot Points
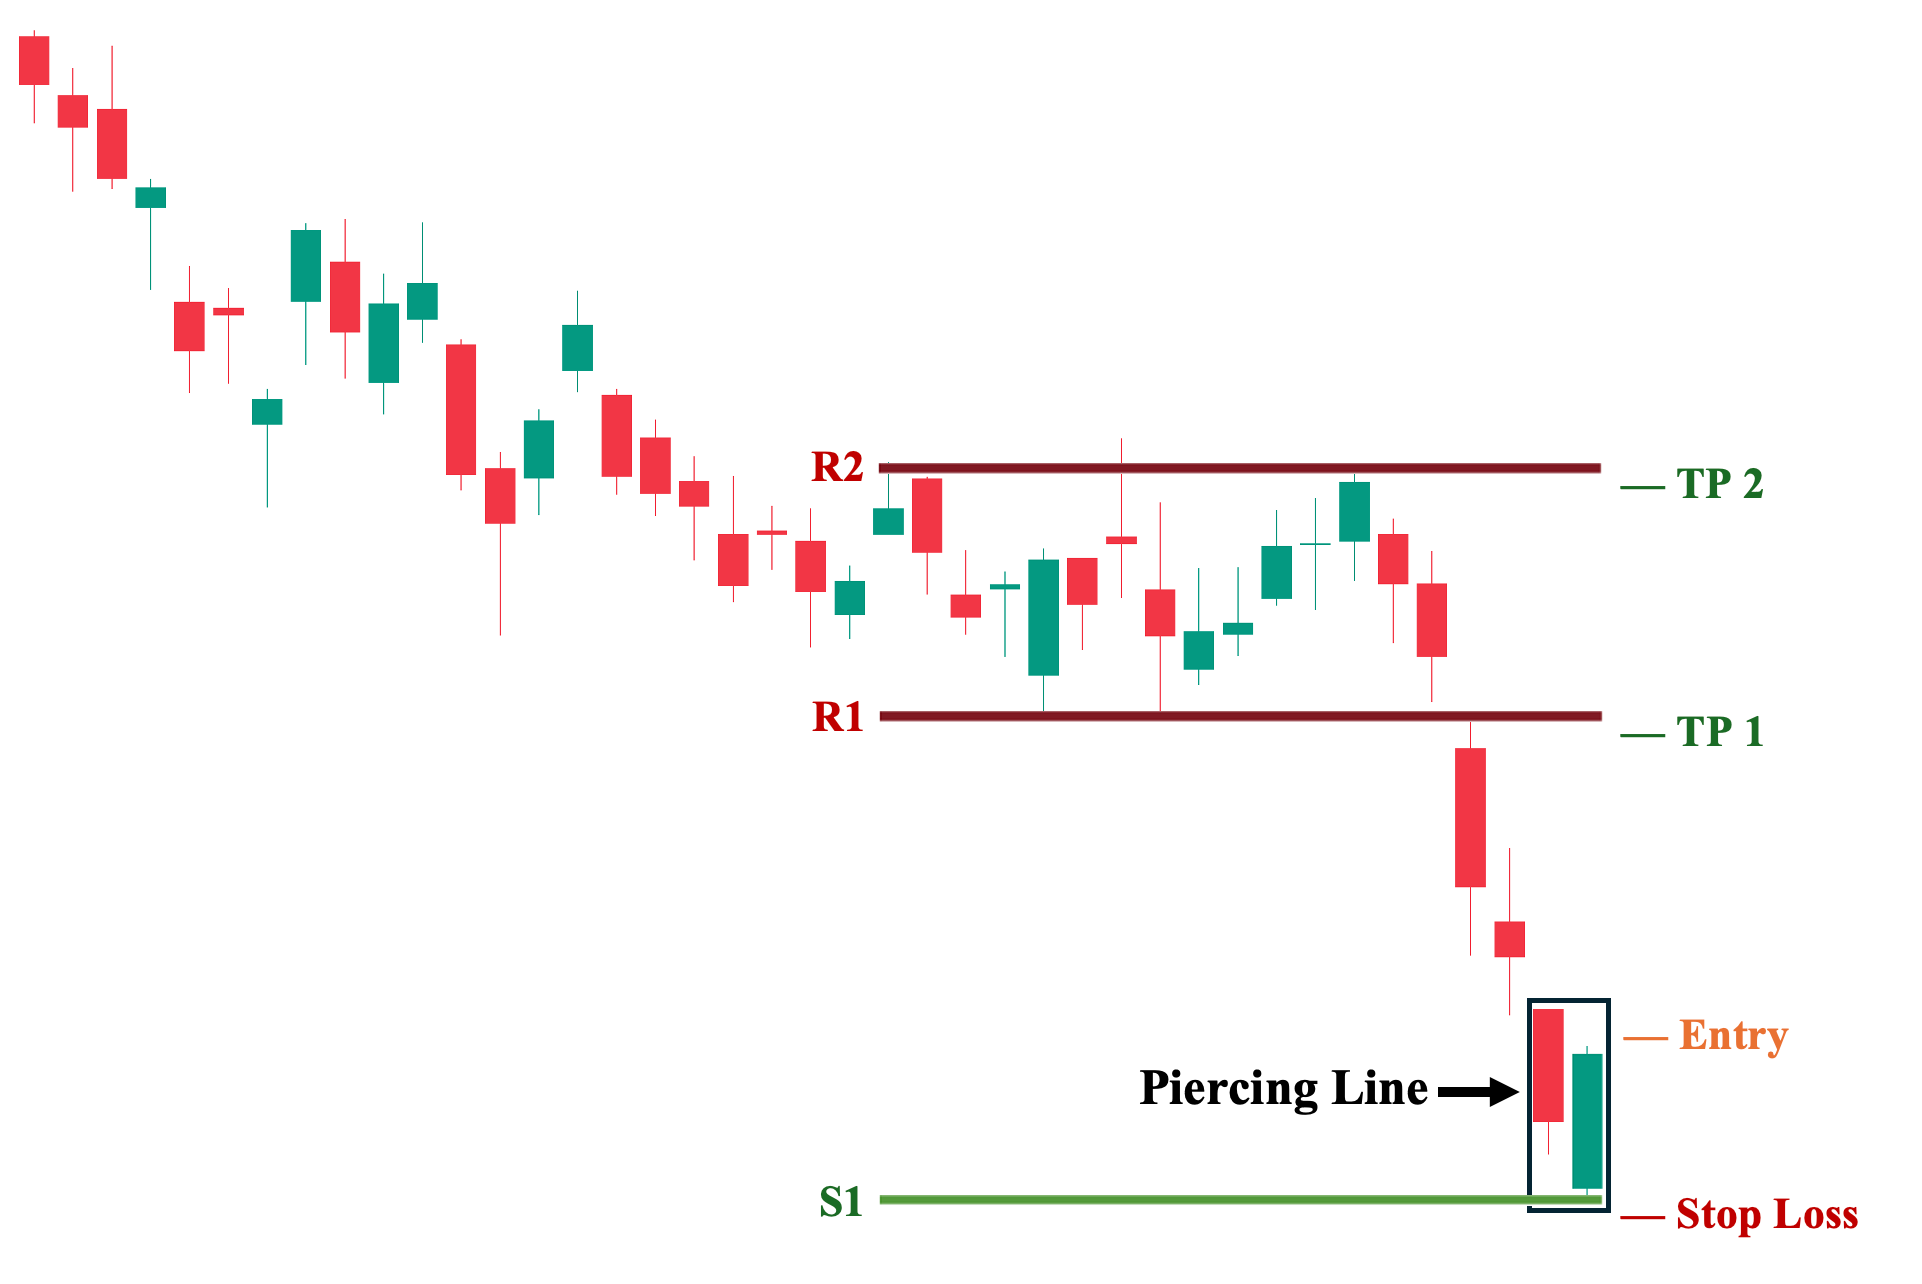
Seventh, similar to Fibonacci levels, pivot points can be used to identify key price levels after you have already decided to take a position. This contrasts sharply with other technical indicators, which are mainly used to qualify or confirm a candle pattern. That said, as a technical analysis tool, pivot points are generated automatically, providing suggested key price levels, including likely support levels (S1, S2, etc.) and resistance levels (R1, R2, etc.), where you can place your stop loss (around the S1 level) and take profit (around the R1 and R2 level).
To illustrate, we can observe above the piercing line pattern occurring at the bottom of a downward trend. Like our approach in the Fib section, assuming we identified this as a potential bullish reversal—either by analyzing market structure or using complementary technical indicators—we can then generate pivot points to identify key areas where we can base our trade decisions (i.e., our stop loss and take profit points).
1. Entry Point: A few ticks above the high of the pattern’s second candle.
2. Stop Loss Point: Set your stop loss a few ticks below the S1 level.
3. Take Profit (TP) Level: If your strategy involves selling in tranches, you can set your first TP a few ticks just below the R1 level and your second TP a few ticks below the R2 level.
4. Risk-Reward Ratio: The risk/reward ratio must be at least 1:1. We do not recommend taking trades with a ratio below this in any trading situation.
Piercing Pattern with Volume Indicator
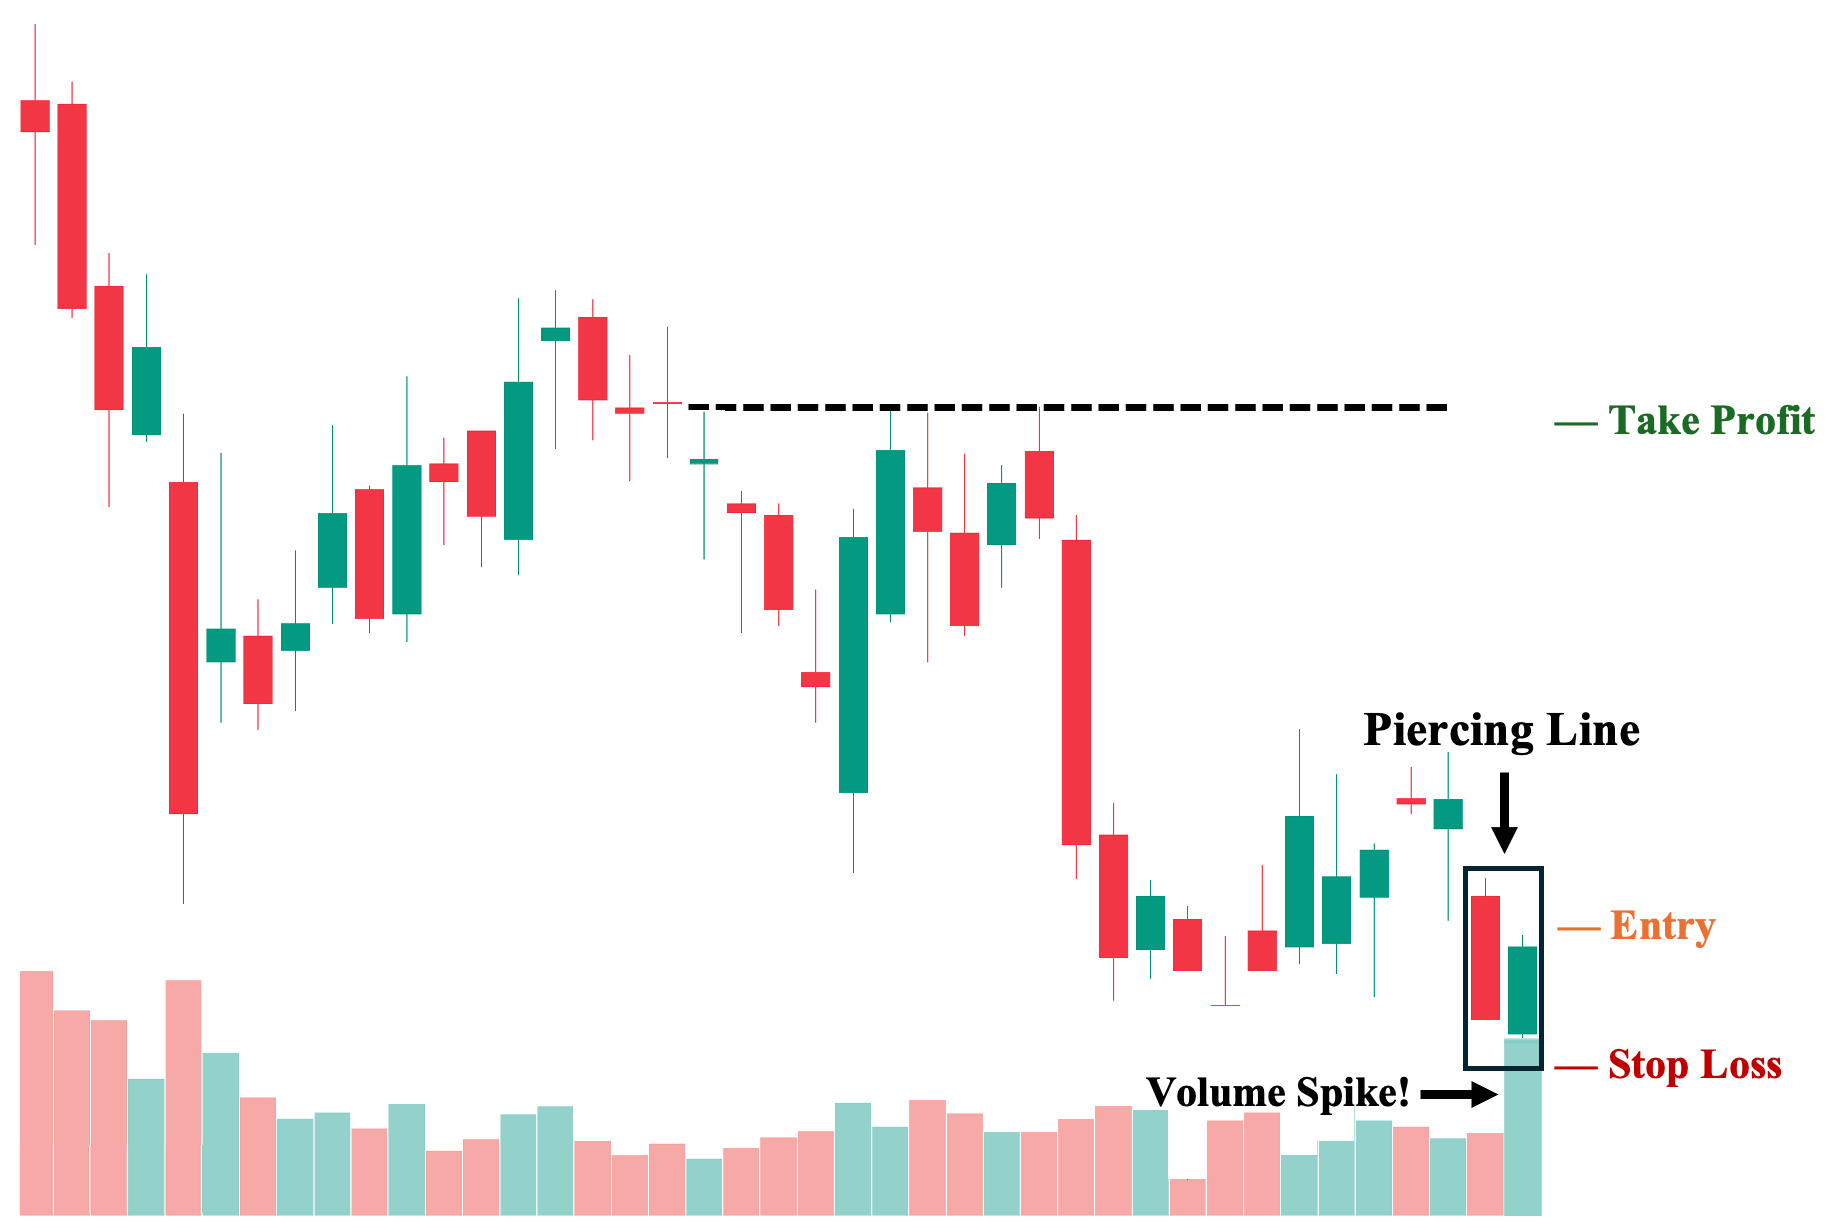
Eight, compared to other technical indicators, volume is one of the few that is completely independent of price action. In other words, its value is not dependent or even affected by price at all. Instead, it simply is the aggregate value of all trades done in a specific session (i.e., total trading volume). This makes it a valuable tool that can fit into most trading strategies, particularly those that deal with a potential reversal signal (in this case, the piercing line pattern).
In general, when a piercing candlestick pattern occurs—such as in the illustration above—we want to see an accompanying volume spike (at least twice the average trading volume over the past month) on the pattern’s second candlestick. This volume spike reflects a remarkably high interest among market participants around that price level and could indicate that the reversal pattern is likely to materialize and lead to a successful trend reversal. Hence, the volume also helps mitigate potential false signals from piercing patterns with low or insignificant volume.
1. Entry Point: A few ticks above the high of the pattern’s second candle.
2. Stop Loss Points: Set your stop loss a few ticks below the low of the pattern’s second candle.
3. Take Profit (TP) Level: Set your TP a few ticks below the nearest key structural level.
4. Risk-Reward Ratio: The risk/reward ratio must be at least 1:1. We do not recommend taking trades with a ratio below this in any trading situation.
Advantages of Trading on the Piercing Pattern
The following are the key advantages of using the piercing line pattern to help you make more informed trading decisions:
1. Reflects Sudden Changes in Fundamental Factors
First, the piercing pattern can signal unexpected changes in fundamental factors within the financial markets, especially when they appear in longer time frames, such as the daily chart and weekly chart. This is due to the very characteristic of the candlestick formation, where a long bearish (red) candlestick making a new low clearly signifies a continuation of bearish market sentiment and a likely further move to the downside. Then, the second candle opens even lower, reinforcing this sentiment, but abruptly reverses course as strong buying pressure pushes it to close above the midpoint of the previous red candlestick. Moreover, if this pattern is accompanied by a volume spike, it may very well reflect an increased interest from market participants due to unexpected positive developments in fundamentals—for a stock, this could be better-than-expected earnings results or an announcement of a new product which brings excitement among investors and traders.
2. Relatively Strong Reversal Signal Compared to Other Candlestick Patterns
Second, in most financial markets, piercing line patterns are generally considered strong reversal patterns, particularly when compared with other bullish reversal candlestick formations such as bullish harami and even tweezer tops. This is due to the abrupt yet decisive shift in market sentiment that the piercing pattern captures with its two opposing candlesticks. In contrast, other bullish candlestick patterns are less decisive, often merely indicating that selling pressure is “dwindling” or losing momentum, which opens an opportunity for buyers to take control of the price. These patterns—although valid bullish reversal signals—do not necessarily signal a sudden and overwhelming increase in buying pressure, which the piercing pattern does.
3. Provides Valuable Insight on Market Sentiment
Third, in line with the first two points, the piercing candlestick pattern provides valuable insight into the overall sentiment among market participants. This is particularly evident when compared to other bullish reversal candlestick patterns, such as tweezer tops, which do not necessarily capture prevailing sentiment and instead primarily suggest that the price may just be “too low” at that specific point in time. In contrast, the piercing pattern distinctly shows how sellers were dominant the previous day and into the second day’s open. However, the buyers gained control of the price action from sellers shortly after the open on the second day, reflecting a potential “catalyst” that could support or drive the start of a trend reversal.
Disadvantages of Trading on the Piercing Pattern
Here are the key disadvantages of using the piercing line pattern that you need to be aware of:
1. Piercing Line Patterns are Not Created Equal
First, the piercing candlestick pattern may not demonstrate the same universal strength as other candlestick patterns. This is because, while the minimum requirement is for the second candle to close above the midpoint (50%) of the first candle’s body, a piercing pattern that closes just above this threshold is often less powerful than one that closes, for example, above 80% of the previous candle’s body, indicating greater strength and decisiveness. Therefore, all else being equal, a piercing pattern with an 80% close is more likely to lead to a successful reversal toward a bullish trend.
2. Reliant on Third-Party Confirmation
Second, as we have discussed in the “Trading Strategies” section, the piercing candlestick pattern is far more likely to lead to a potential trend reversal when there is an additional layer of confirmation from other technical analysis tools, such as an RSI divergence or a volume spike. Like other confirmation-reliant candlestick patterns, the piercing pattern works significantly less effectively in isolation and is also much more prone to generating false signals. Therefore, relying solely on the piercing pattern in trading is likely to produce substandard results.
3. Less Ideal Risk-Reward Profile Compared to Other Candlestick Patterns
Third, the piercing candlestick pattern generally has a less favorable risk-to-reward ratio compared to other bullish reversal candlestick patterns, such as the bullish harami. This is because the default entry point, which is just above the second candle’s high, and the stop-loss placement, which is just below the second candle’s low, often create a wider distance between the two due to the typically large range of the second candle. In comparison, the bullish harami pattern, with its smaller second candle, allows for a much closer placement between entry and stop-loss points.
Piercing Line vs. Dark Cloud Cover
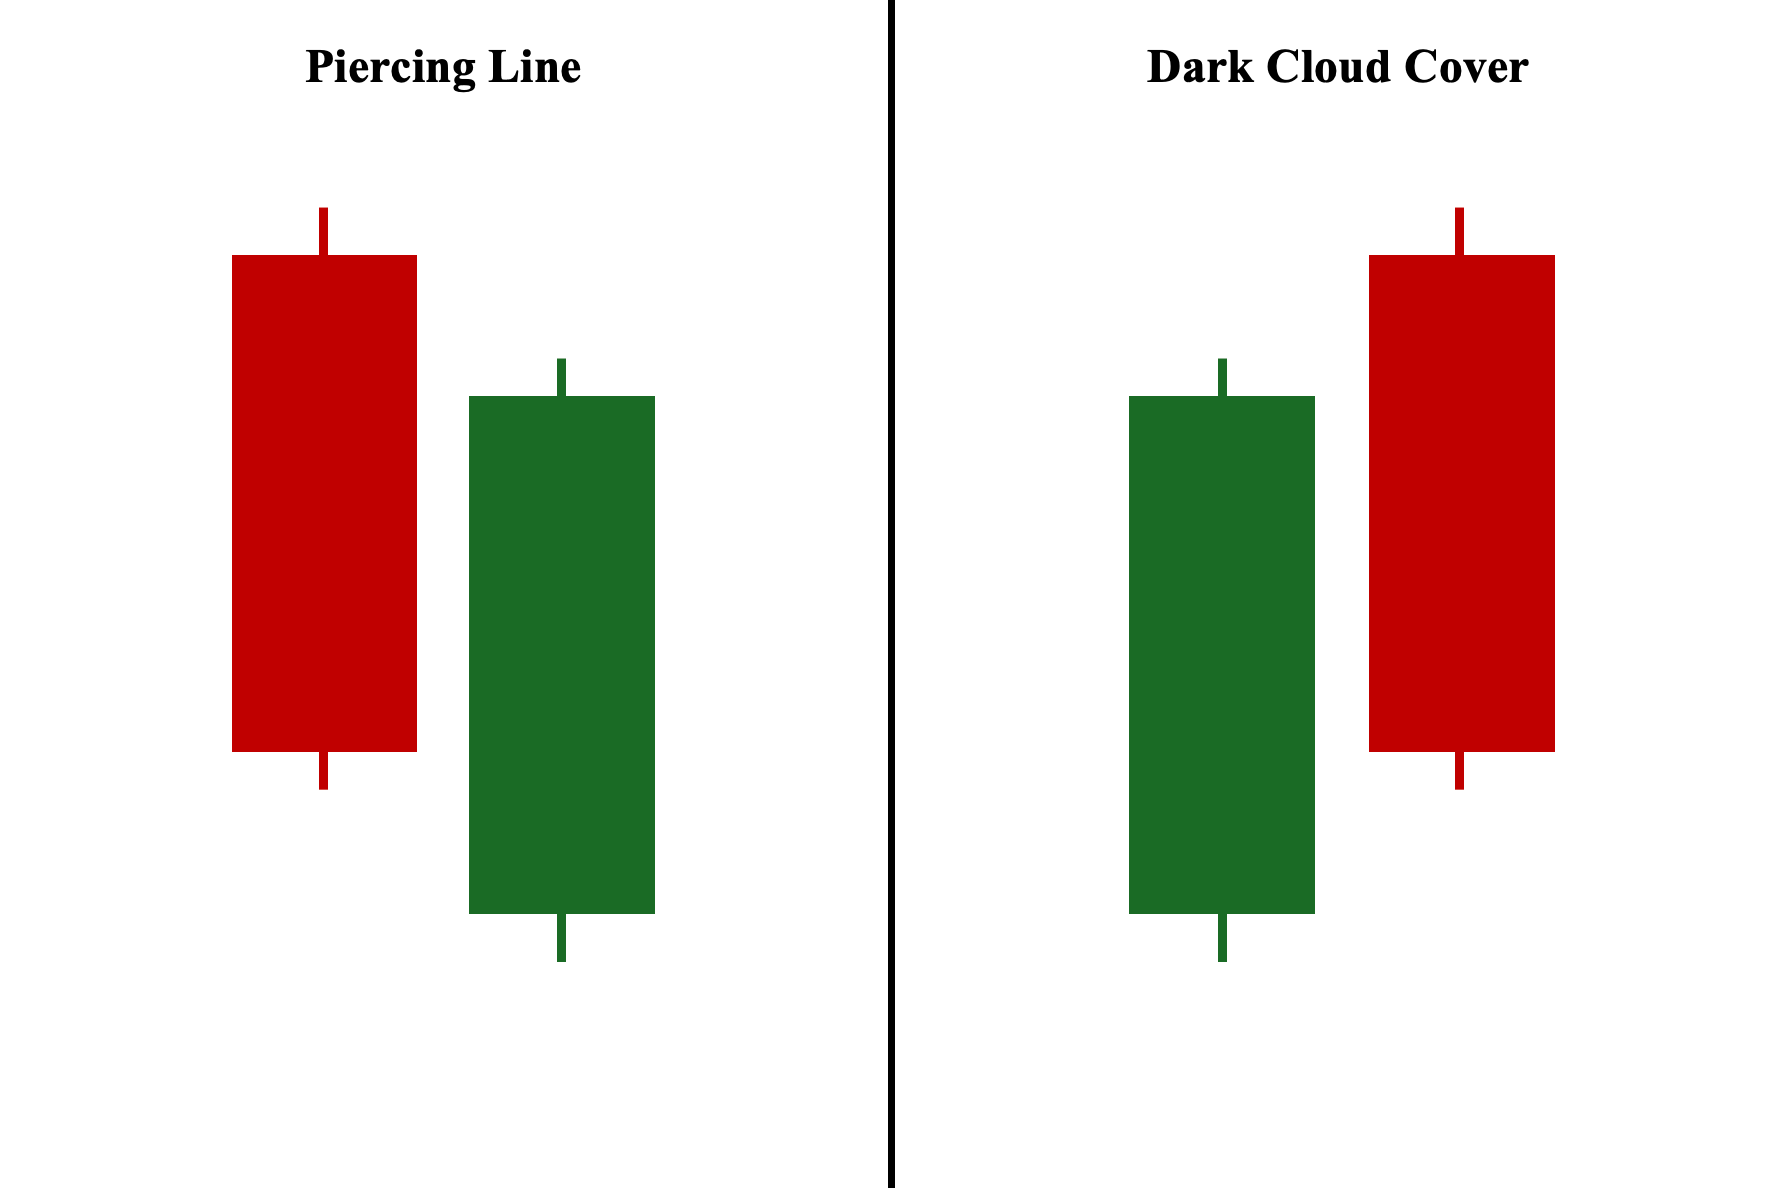
Both the piercing line and dark cloud cover candlestick patterns are composed of two candlesticks and are mirror images of each other. In fact, the dark cloud cover is the direct bearish counterpart to the piercing line pattern. Zooming in, the piercing line pattern consists of a long-bodied bearish candle followed by a long-bodied bullish candle that closes above the midpoint of the first candle’s body, signaling a potential bullish reversal against the ongoing downtrend. Conversely, the dark cloud cover consists of a long-bodied bullish candle followed by a long-bodied bearish candle that closes below the midpoint of the first candle’s body, indicating a bearish reversal from the prevailing upward trend.
Piercing Line vs. Bullish Engulfing Pattern
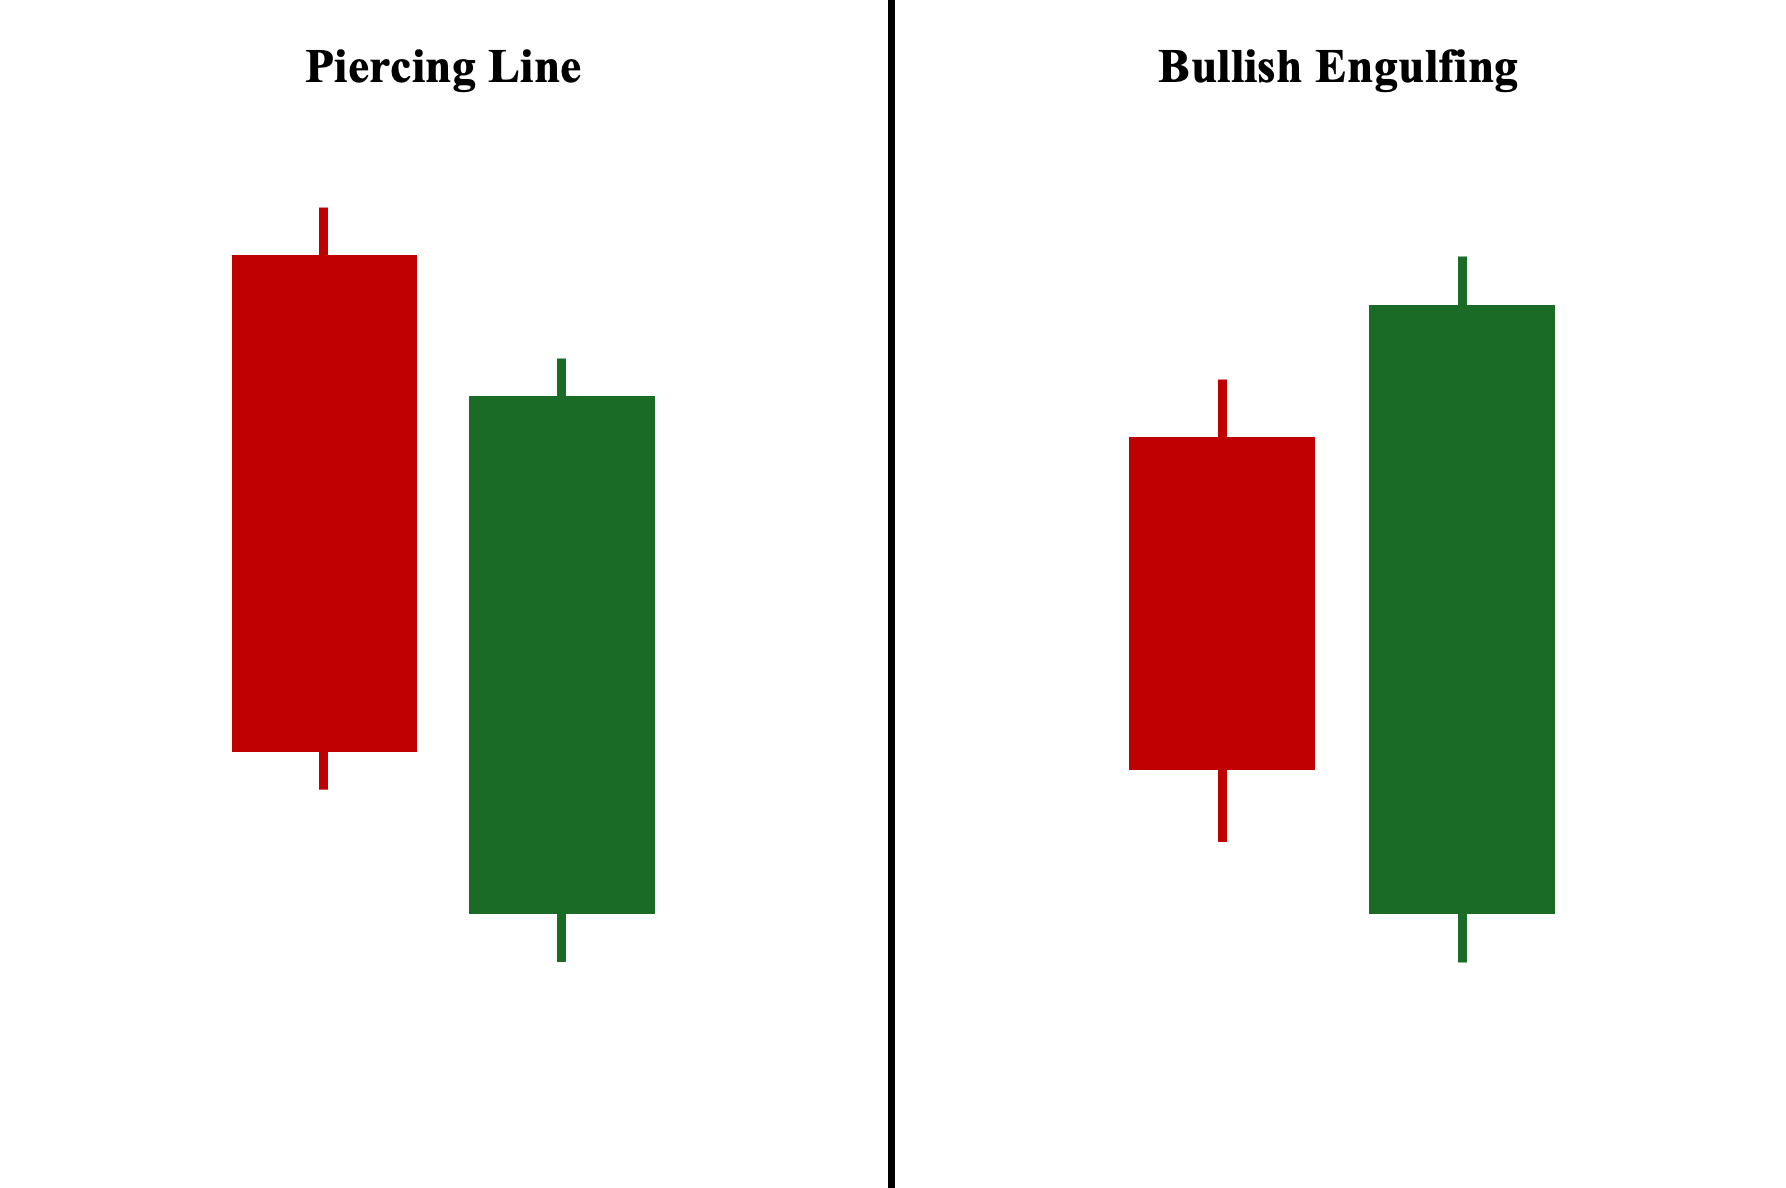
Both the piercing line and bullish engulfing candlestick patterns are composed of two candlesticks—a bearish first candle followed by a bullish second candle. Both are considered bullish reversal patterns, signaling a potential shift in market sentiment from a downtrend to a bullish trend (uptrend). However, unlike the piercing pattern, the bullish engulfing pattern involves a relatively small bearish candle followed by a long bullish candle that fully engulfs or covers the entire range of the previous candlestick. Both candlestick formations are considered strong bullish reversal patterns, particularly compared to other bullish reversal patterns—notably the bullish harami and hammer patterns.
Piercing Line vs. Tweezer Bottom
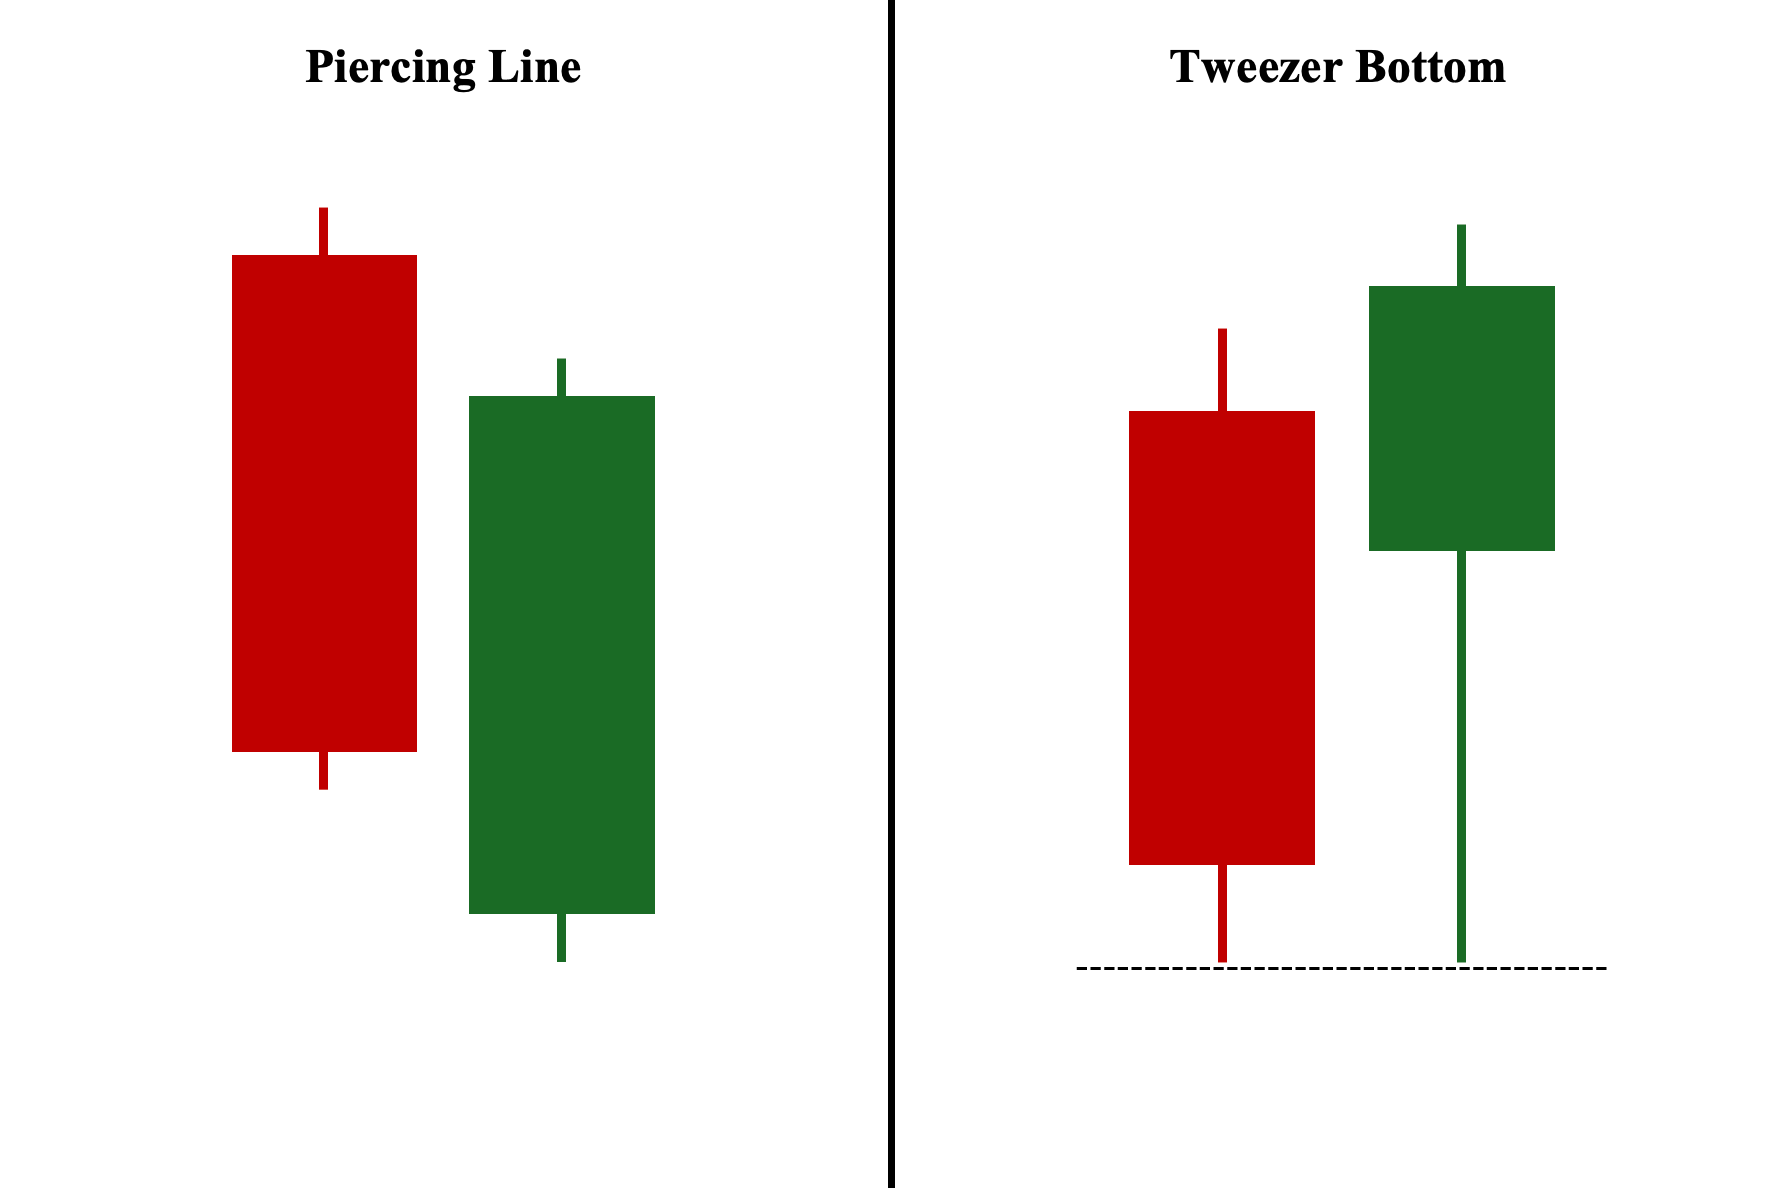
Similarly, both the piercing line and tweezer bottom candlestick patterns consist of two candlesticks—a bearish first candle followed by a bullish second candle—and are both considered bullish reversal patterns. However, compared to the piercing pattern formation, the tweezer bottom involves two candlesticks with identical or nearly identical lows. In this setup, the first candlestick’s low initially tests this level, while the second candlestick’s low reaffirms the strength of the level—establishing it as a potential support level. As a result, the price is more likely to bounce back up, initiating a potential trend reversal rather than breaking through this likely newly established price level.
Piercing Line vs. Three White Soldiers
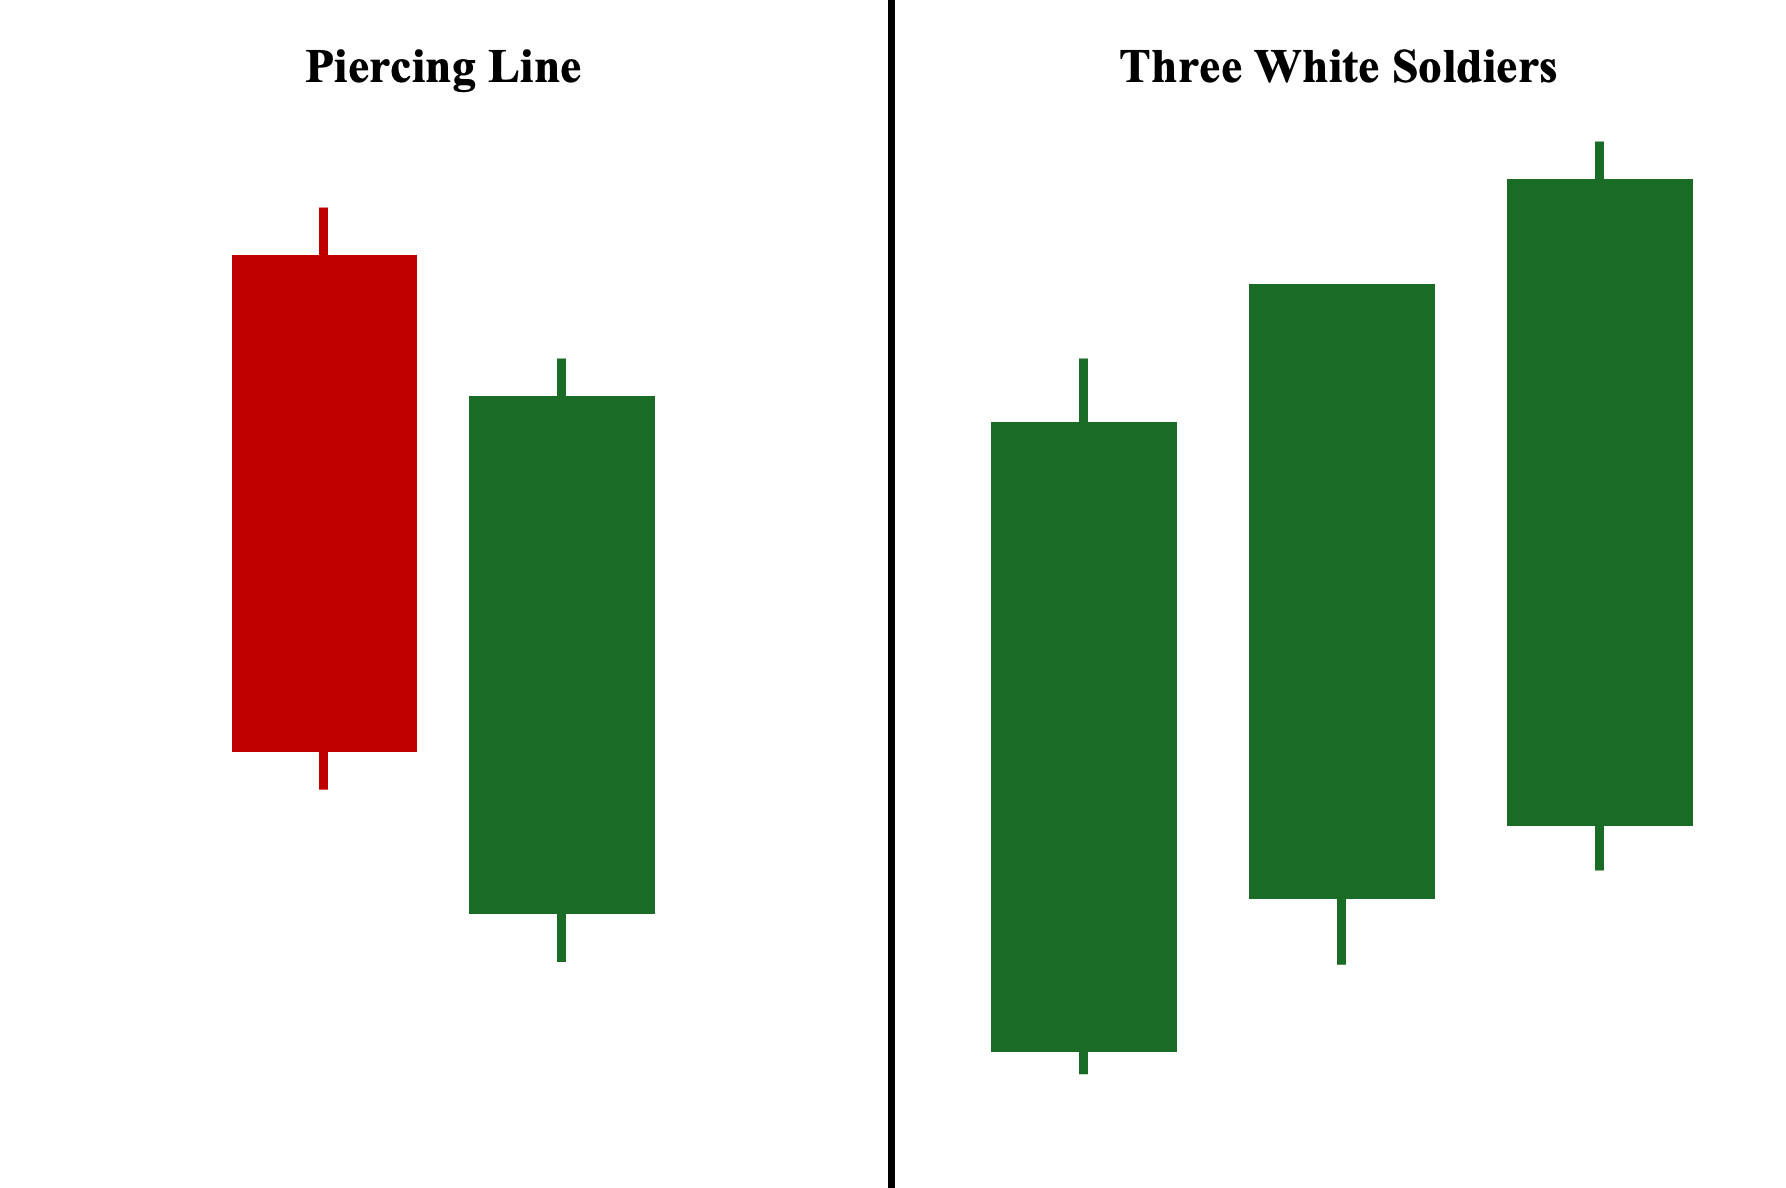
Both the piercing line and three white soldiers are considered bullish reversal patterns. However, while the piercing line pattern consists of two candlesticks—a bearish candle followed by a bullish candle—the three white soldiers consist of three consecutive long-bodied bullish candles that open and close progressively higher each time, signaling strong bullish sentiment from market participants and suggesting a potential bullish trend reversal. Comparatively, because the three white soldiers is a three-candlestick reversal pattern, it is widely considered to be a stronger reversal signal than two-candlestick reversal formations such as the piercing pattern.
What Mistakes Should I Avoid When Identifying Piercing Patterns?
Below are some of the most common mistakes to be aware of when using the piercing pattern:
1. Improper Trend Context
First, it’s important to remember that piercing patterns are only considered valid when they appear during a prevailing downtrend. Consequently, if a piercing pattern forms during an uptrend or in a sideways (non-trending) market, it cannot be relied upon to signal a bullish reversal at all. This is due to the fact that in an uptrend, the market is already bullish, and in a sideways market, there is no established trend to reverse in the first place.
2. Second Candle Fails to Close Above 50% of the First Candle’s Body
Second, always make sure the second candle closes above the halfway point (50%) of the first candle’s body. Keep in mind that this midpoint refers specifically to the body of the first candle and not its full range, which includes both the body and shadows or wicks. This difference matters because the midpoint of the entire candle’s range is often not the same as the midpoint of its body—unless, of course, the candle has minimal or no shadows.
3. Poor Position Sizing
Third, because the piercing pattern can sometimes lead to false signals, careful risk management is essential. As we have mentioned in the Disadvantages section, the piercing pattern tends to have a less favorable risk-to-reward ratio than other candlestick patterns. This happens because if you follow the default placement and place your entry above the second candle’s high and set your stop-loss below its low, the second candle’s large range often requires a farther stop-loss point relative to your entry, which inherently increases risk.
Frequently Asked Questions (FAQs)
What is the opposite of Piercing Line candlestick patterns?
The bearish counterpart of the piercing line pattern is the dark cloud cover pattern. While the piercing pattern is a bullish reversal pattern that appears at the bottom of a prevailing downtrend, the dark cloud cover is a bearish reversal pattern that emerges at the top of an established bullish trend (uptrend). It consists of a long bullish (green) candlestick followed by a long bearish (red) candlestick that gaps up at its opening price but ultimately closes below the midpoint of the first candle’s body.
What is the best time frame to use Piercing Line candlestick patterns?
In general, the piercing pattern works best on longer time frames, such as the daily chart and weekly chart. This is because most institutional and retail traders use these two time frames extensively as they reflect the aggregate market response to key fundamental and geopolitical announcements, adding further validity to the pattern’s appearance. In contrast, lower time frames like minute and hourly charts are more prone to market noise and you are less likely to experience the gap down when scalping or day trading.
What is the psychology behind Piercing Line candlestick patterns?
The rationale behind the piercing pattern being a potential trend reversal revolves around the fact that it reflects the sudden shift in market sentiment within a single trading session. This is because the pattern involves a long bearish candlestick that is part of an ongoing downtrend and often sets a new low, suggesting continued downward momentum. Then, a long bullish candle suddenly follows, gapping lower on the open, then closing above the midpoint of the first candle. This signals unexpectedly strong and decisive buying pressure, especially just after reaching a new low.
Is the Piercing Line pattern bullish or bearish?
The piercing line pattern is a bullish reversal pattern, indicating a potential shift in market sentiment away from the ongoing bearish momentum. When this pattern appears, it suggests the possible end of a prevailing downtrend and the start of a countermove toward an uptrend.


