Verfasst von:

- Quarterly Forecast
- Dezember 31, 2025
- 8 Min. Lesezeit
Q1 2026 Crude Oil, Silver, Gold, and Bitcoin Forecast
| Q4 2025 Performance | 2025 Calendar Year | |
| *Gold (XAUUSD) | +11.7% | +64.4% |
| *Silver (XAGUSD) | +51.5% | +146.1% |
| *Crude Oil (USOIL) | -8.3% | -20.1% |
| Copper (XCUUSD) | +16.9% | +41.6% |
| Platinum | +28.8% | +124.1% |
| *Bitcoin | -23.2% | -6.2% |
*Analysis and forecast below
2025 was a phenomenal year for metals and a lackluster year for crude oil.
At first glance, one would think the US Dollar debasement trade caused the metals to get repriced higher. The debasement trade is a weaker US Dollar that causes a hard asset, like the commodities, to reprice higher. However, not all commodities did reprice higher as both Crude Oil and Bitcoin finished the year lower.
Real Interest rates are falling and metals typically like those environments as it implies sticky inflation.
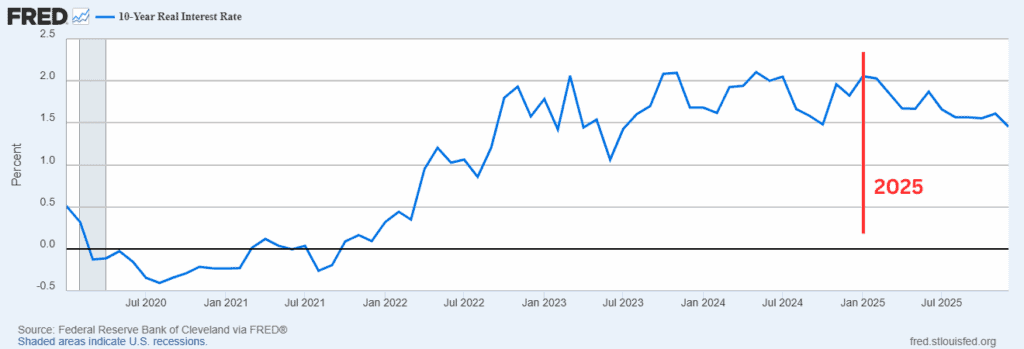
The chart above is the US 10-year Real Interest Rate. Through the course of 2025, that rate fell 60 basis points reaching its lowest level since July 2023.
Though asset prices have remained elevated, the industrial growth (or lack thereof) may be providing a headwind for oil dragging its prices lower.
Looking ahead in 2026, the metals may need a few months to consolidate these massive gains. Additionally, I think we’ll see crude oil perk up and try to ‘catch up’ on some gains as the world’s appetite for energy is increasing due to AI and data centers yet the available energy infrastructure is unable to meet that demand.
Crude Oil
Starting off with Crude oil, energy demand is on the rise. Big tech has been planning out many new data centers which are energy intensive buildings to make their calculations and keep cool. This is part of the reason President Trump signed an executive order to fast track the onboarding of new nuclear energy facilities. It’s basically an “all hands on deck” for energy as demand is rising and available supply of energy isn’t able to meet that demand.
What does crude oil have to do with electricity generation? Plenty. Crude oil is needed to generate electricity. Therefore, greater demand on the electrical grid means all sources of energy (renewable, oil, gas, and nuclear) are needed to meet that demand.
According to the IEA.org, demand is heavier in 2025 than previously forecasted. Additionally, the demand for 2026 is forecasted to rise +860,000 barrels per day than what was consumed in 2025.

Looking into the past price history, it appears Crude Oil is nearing the end of a multi-year decline, an Elliott wave diagonal pattern. The diagonal is shaped like a falling wedge and is a bullish structure once it is completed.
It appears that crude oil may bottom in Q1 2026 and begin a multi-month and possibly multi-year rally that ultimately challenges $100 or higher.
The diagonal pattern is very late in development and could capitulate lower to $49 per barrel, though it doesn’t have to.
There are some Fibonacci wave relationships appearing between $49-$53 so I suspect that if price makes it that low, it may not spend much time down there. At $52.67 is where wave (C) is .618 times (A). At $49.63 is the 61.8% Fibonacci retracement level of the 2020-2022 rally.
As a result, I suspect oil related stocks (like XOM, BP, CVX) are likely to be supported in Q1 2026 and beyond.
Silver
Silver was a darling in Q4 2025 rallying over 50%. Those large rallies need a breather and often include steep retracements. Therefore, any profit taking in the first part of January to defer capital gains taxes until 2027 may lead to additional selling to protect unrealized gains.
Therefore, I suspect Q1 will be volatile for silver as it digests these recent gains.
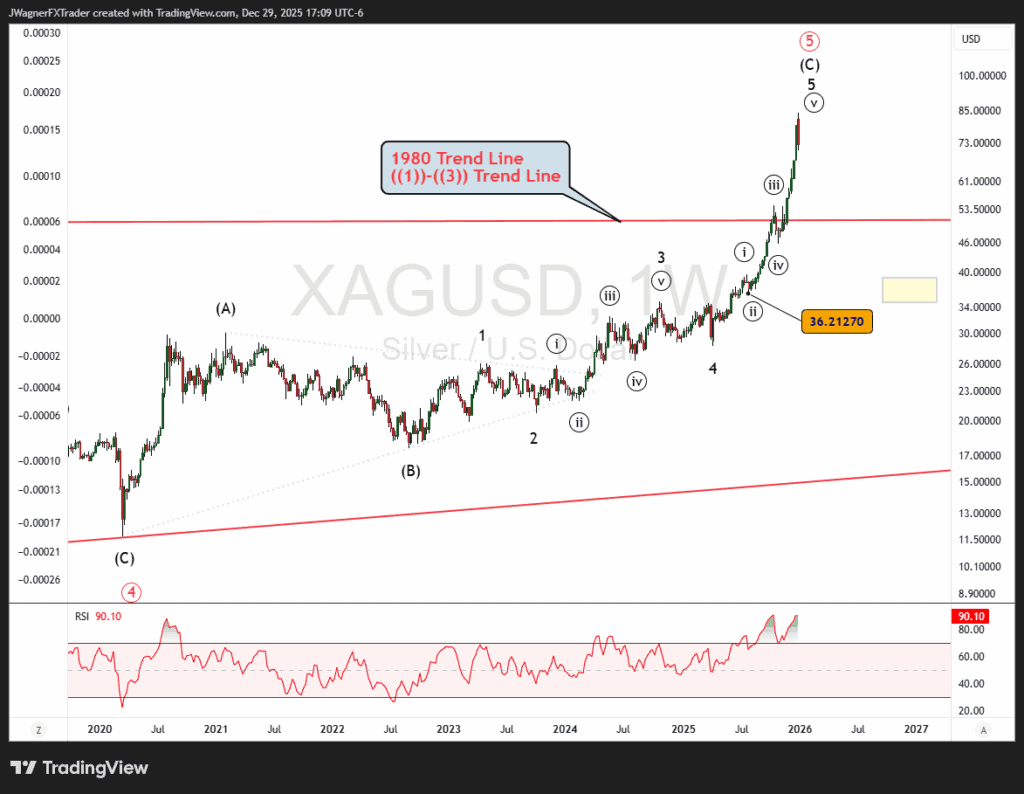
From an Elliott wave perspective, the rally can be viewed as nearly over at multiple degrees of trend.
The larger pattern would be a 50-year ending diagonal pattern with wave ((5)) beginning in 2020 and ending soon. Within wave (C) of ((5)), there is an extended 5th wave where prices rallied in extreme fashion.
Under such a scenario, prices often retrace back to wave ((ii)) of 5, which is near $36. But first, keep an eye on the ((1))-((3)) trend line that passes through near $52. If that support breaks, then $36 is the next level of support.
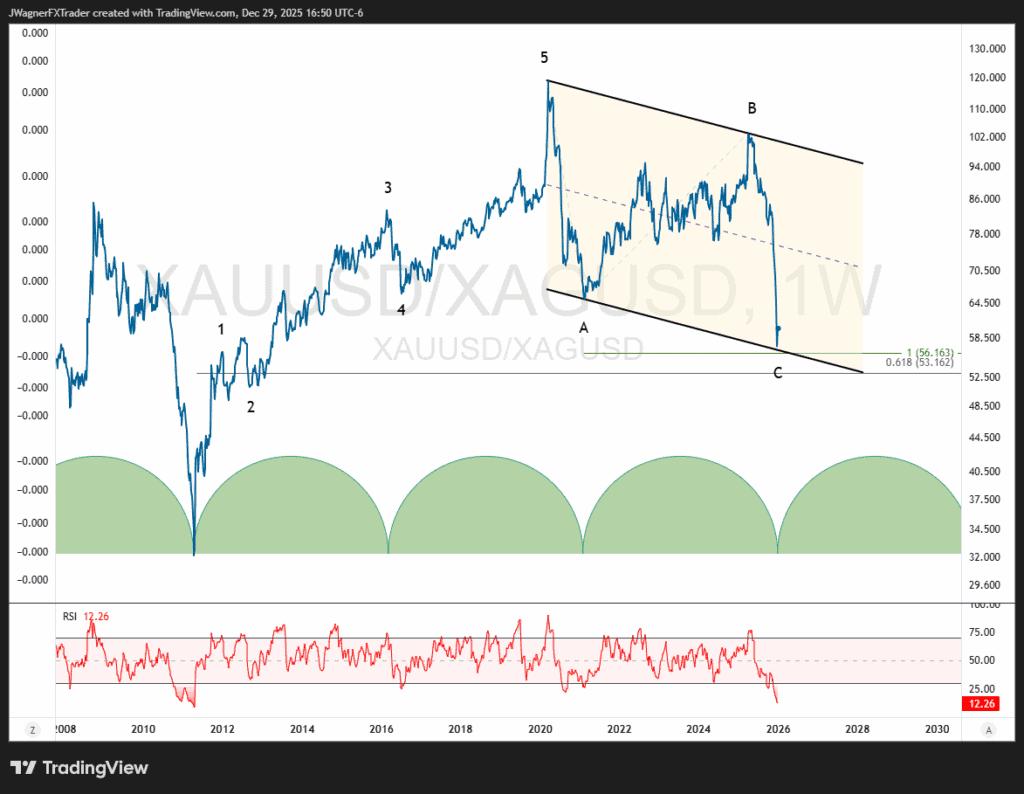
Another chart that spells underperformance for Silver is the Gold-to-Silver ratio. Silver’s outperformance in Q4 2025 has driven this ratio lower in 3-waves. Since 2011, we can spot a clear 5-wave rally and 3-wave decline in this ratio. The geometry and harmony of the recent decline in the ratio hints that gold may outperform silver again.
Additionally, the green timing cycles at the bottom of the chart hint at a low in the ratio developing in Q1 2026.
Be careful with these ratios because they don’t tell you the trend of the underlying assets. But, if the Elliott wave labeling on silver above is correct, gold can simply outperform silver by:
- Gold not declining as fast as silver.
- Gold staying even while silver declines.
- Gold rallies while silver’s rally is weak or declining.
Bottom line for silver, I suspect the silver lining fades while the luster of gold shines brighter than silver.
Gold Forecast
Gold has had a monster year in 2025. Will it see another strong year in 2026?
I suspect there is a good chance gold continues its ascent. There are a couple of Elliott Wave patterns we are following and both patterns are incomplete to the upside.
From an Elliott wave perspective, we’re looking for 5 completed waves to the upside. Within the 5-waves, we’d like to see the interruption waves, wave 4 and wave 2, carve in a similar size and length.
So far, the patterns we are following suggest that gold is nearing the end of wave 3 or is halfway through wave 4. Either way, a wave 5 rally is needed as both rally patterns are incomplete.
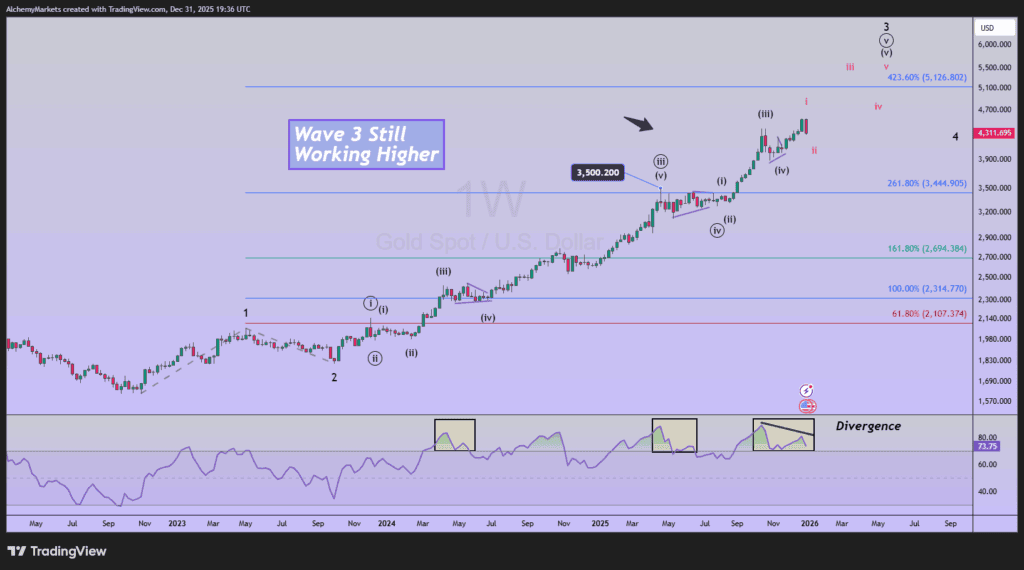
If wave 3 is incomplete, the next wave relationship appears near 5,100 where wave 3 would be a Fibonacci extension 4.236 times the length of wave 1. When wave 3 is extremely extended, the next level beyond 2.618 is 4.236.
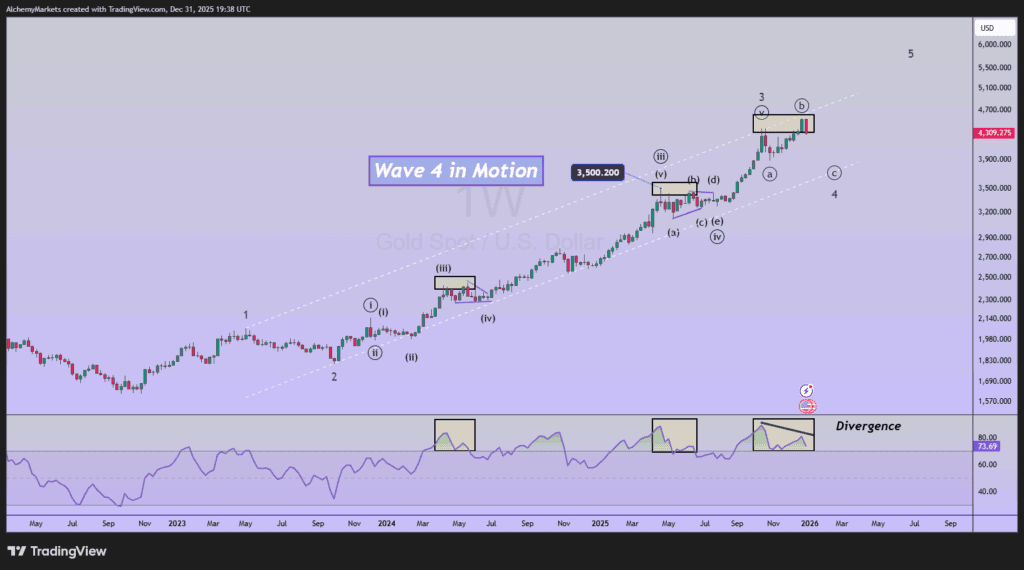
If wave 4 is already underway, then a decline to 3,800-4,200 would be considered normal to finalize the wave and may chew up most of Q1 to finish it. There is an interesting pattern developing if wave 4 is in process. Notice how a series of “double tops” formed with the end of a third wave and wave ‘b’ of a triangle? Those tops correspond with diverging RSI. So a decline in gold would be considered normal to consolidate recent gains.
Bitcoin Forecast (Digital Gold)
There are 3 main Elliott wave counts I’m following for Bitcoin.
One of the counts calls for a decline to below $50k. Another is targeting near $70k, while the third is very bullish and would need a surge now.
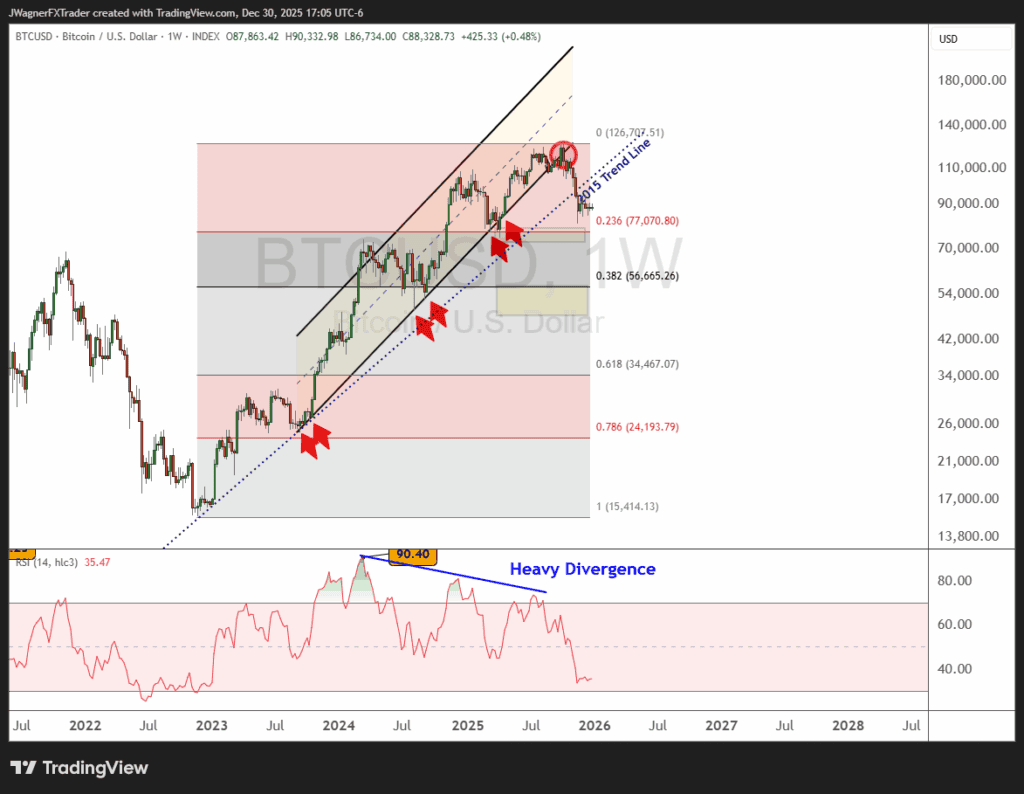
The key point to remember with Bitcoin, the decline in November broke a support trend line that had been in place since 2015. This means the mood of the market has drastically changed and unless a surge begins immediately, the negative mood could propel prices significantly lower.
At the time of this writing, Bitcoin has almost retraced a Fibonacci 23.6% from the 2022 rally. The 23.6% Fibonacci retracement level is considered the minimum retracement within a completed decline. Therefore, within the context of the 2022 rally, this decline in Bitcoin has been shallow.
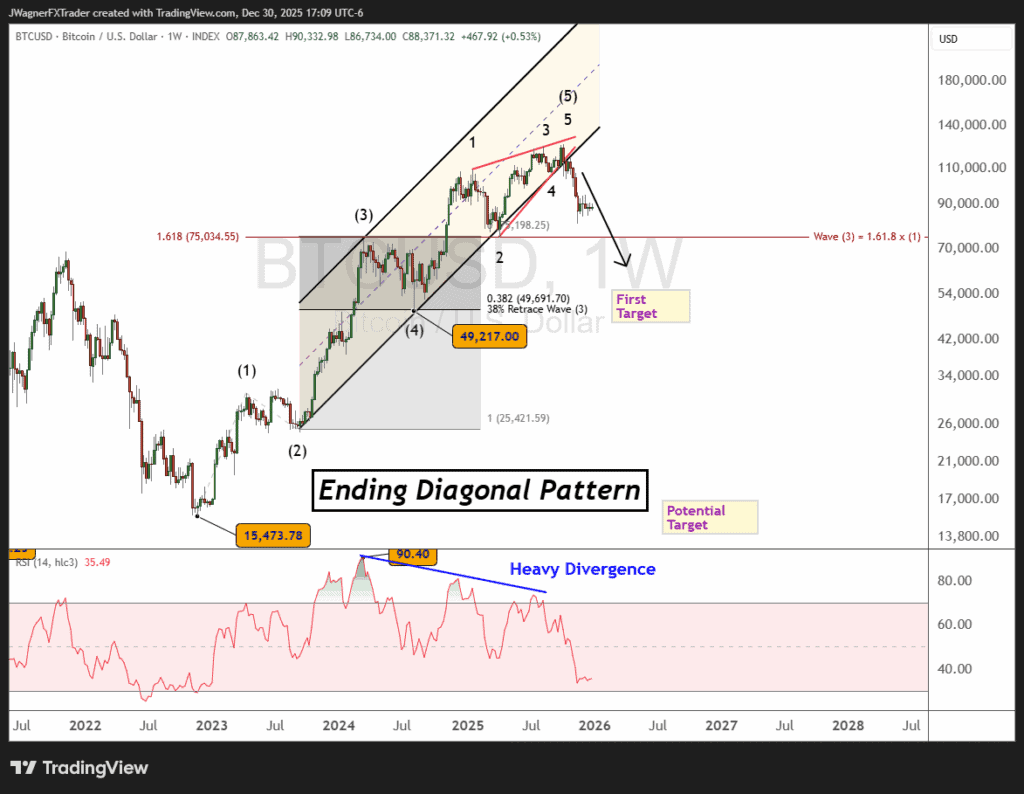
If the 2022 rally is a completed Elliott wave impulse pattern, then wave (5) of the impulse can be counted as an ending diagonal or rising wedge. These patterns tend to be completely retraced leading to a decline back to $49,217.
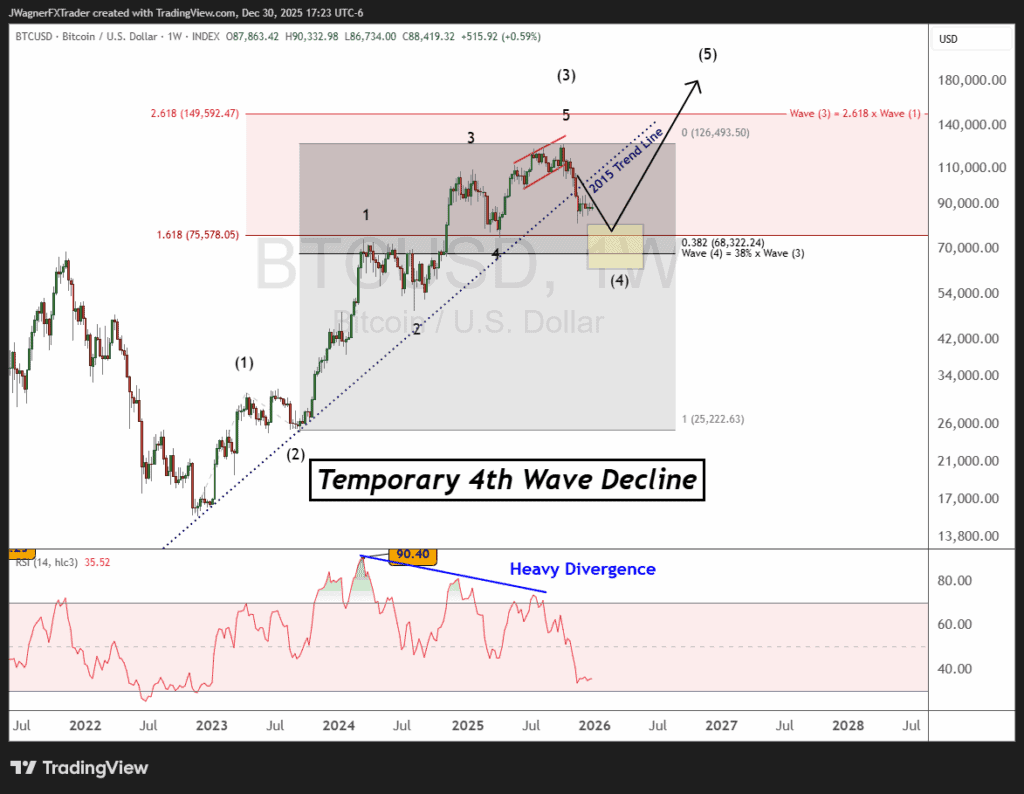
There is a secondary pattern that we are following that calls for Bitcoin prices to dig a little deeper and find support near $68-75k, just below current levels. This decline would be viewed as wave (4) of an incomplete 5-wave advance. Once wave (4) was in place, then a rally to new highs would be the next trend under this wave count.
The heavy RSI divergence appearing at the end of wave (3) is not typical. Oftentimes, the end of wave (3) would see a high RSI value. However, this wave count does not break any of Elliott’s rules, so we’ll keep an eye on it. I’m not a huge fan of this count but we’ll keep it in mind.
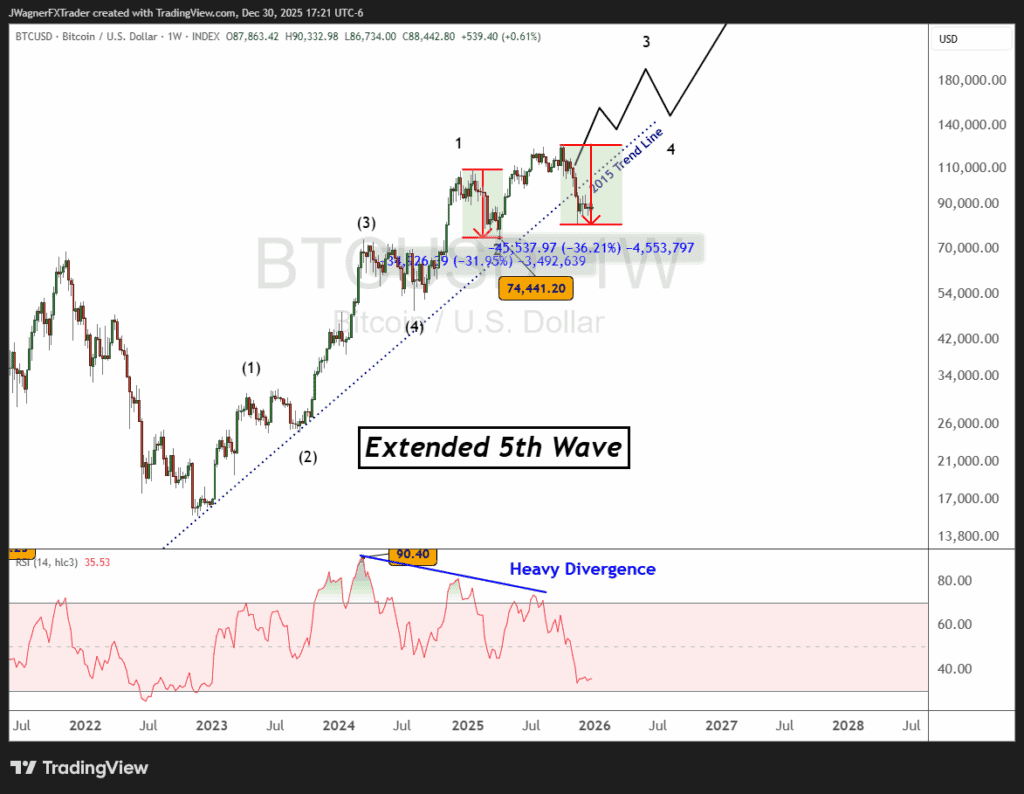
The last pattern I hesitate to share because it is an extremely bullish count. This count implies that Bitcoin needs to surge immediately from current pricing without falling below $74,441.
From an Elliott wave perspective, this would be an extended 5th wave in development. I’m not a huge fan of this count for obvious reasons such as the 2015 trend line breaking. An extended 5th wave would surge higher and support trend lines should not be broken.
Additionally, the Q4 2025 decline is larger than the Q1 2025 decline. This means the smaller degree wave has declined further than the larger degree wave. This doesn’t break any of Elliott’s rules, but does draw into question the count. Therefore, this one is relegated to lower probability.
Bottom line, it appears the decline in Bitcoin is not complete and further losses may appear in Q1 2026.