


Verfasst von:

- Chart of the Day
- April 22, 2026
- 4 Min. Lesezeit
Bitcoin Bounce in Play as Long Setup Builds
Bitcoin has started to look interesting again, and that’s thanks to how price has broken a large descending trendline on the daily timeframe.
For traders who have spent the last few weeks waiting for Bitcoin to show some real strength, this is the first chart in a while that feels like it has something cleaner to work with.
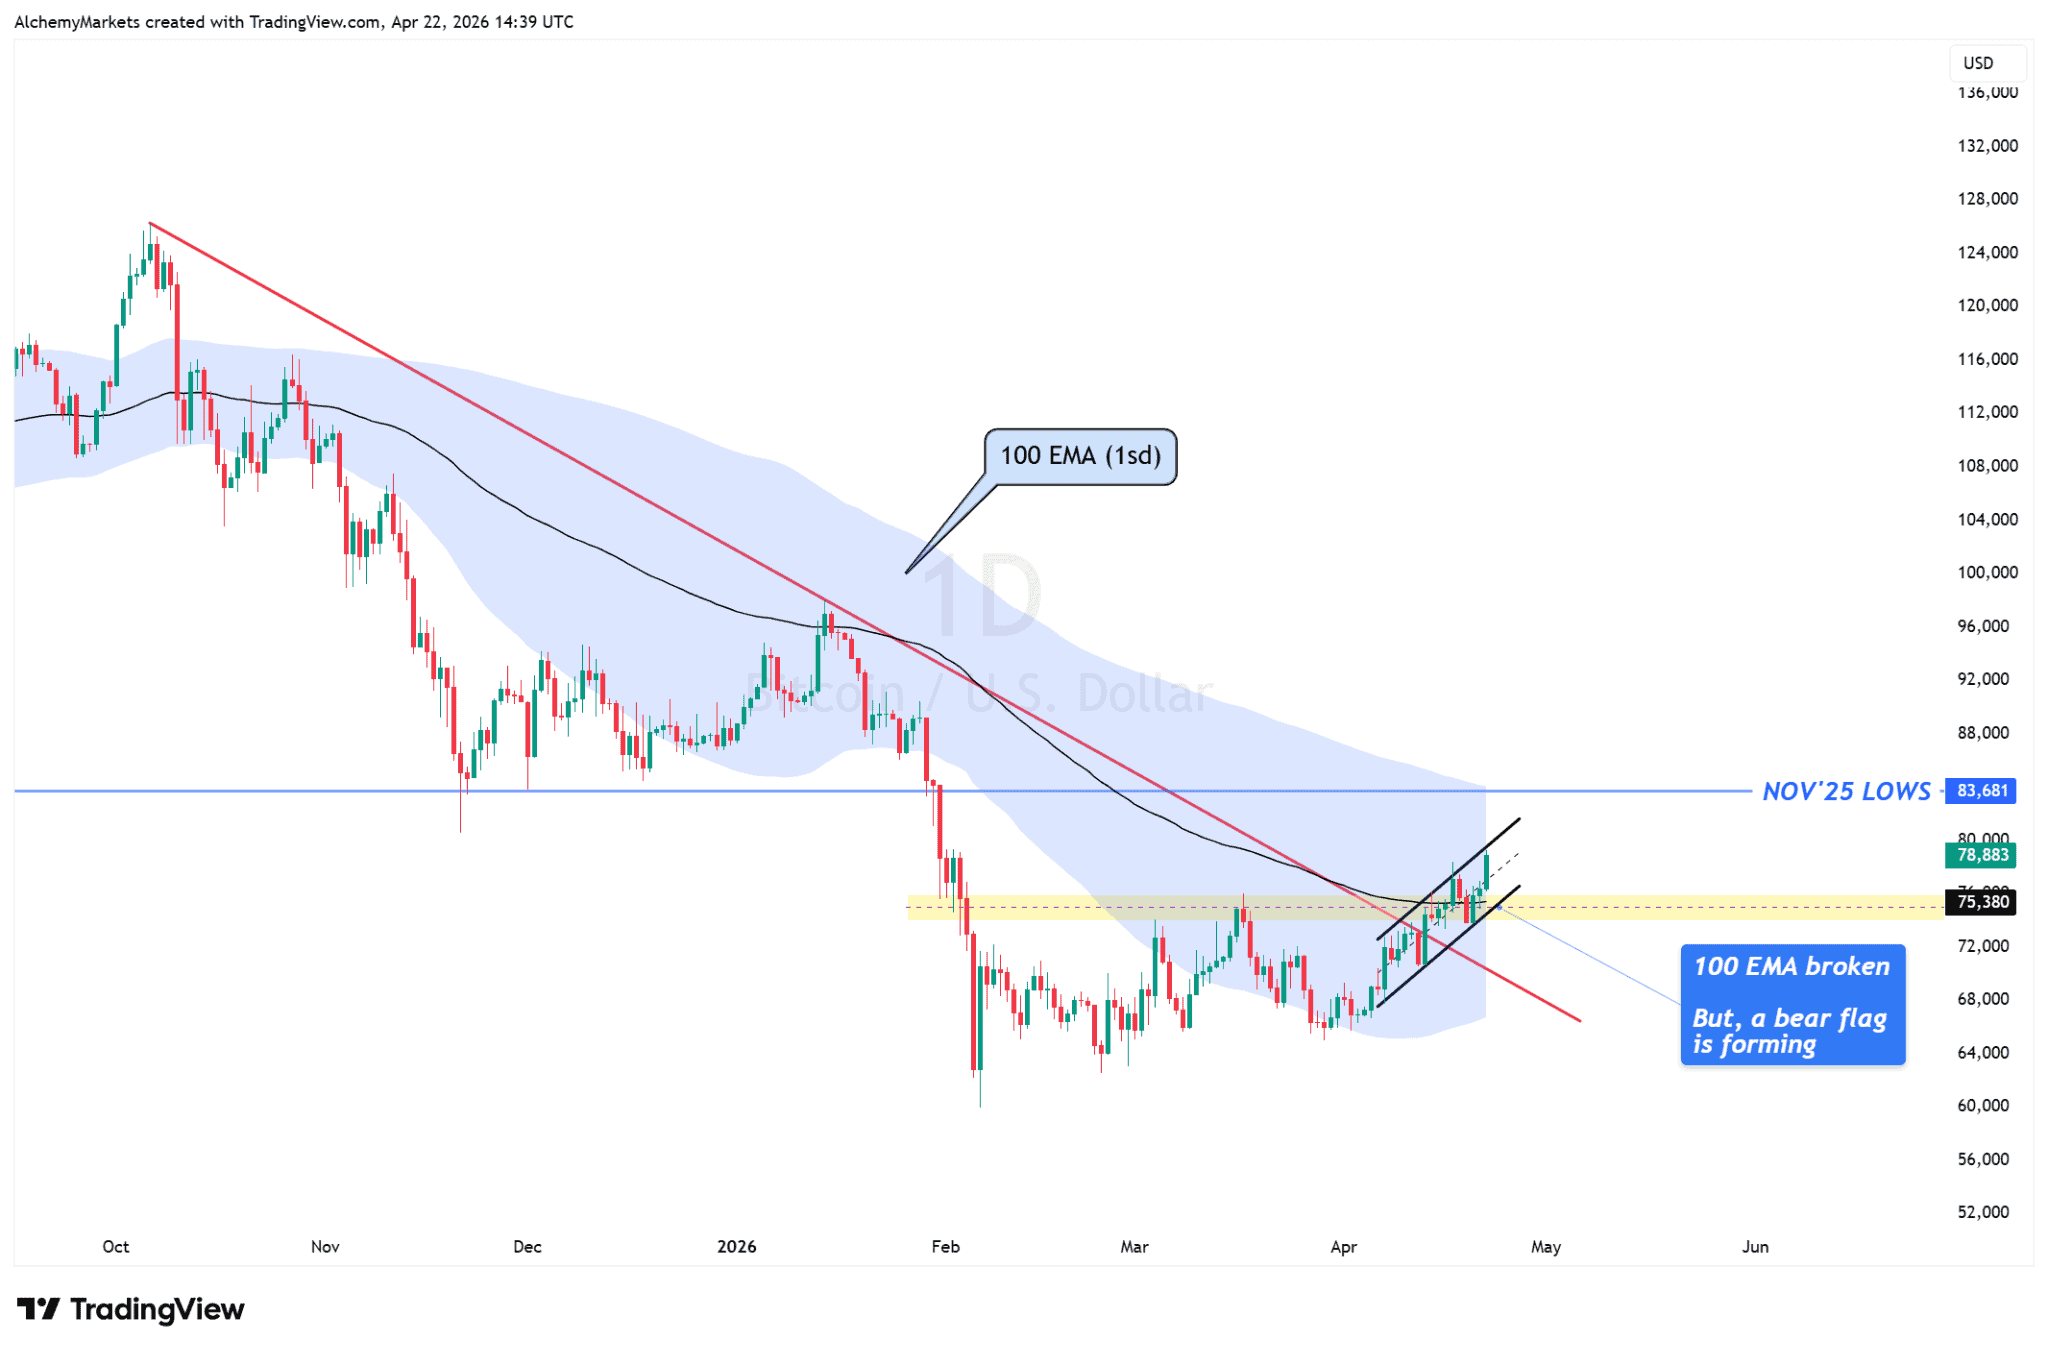
More importantly, price has shown enough strength to stay above that break, which aligns with the 100-day EMA. This is beautiful because now, we have a repeatable, objective level to watch for a possible retracement, which may lead to a bounce / long trade setup.
This key, objective zone now sits around $75,380 (the 100-EMA), with upside targets at November 2025 lows near $83,681.
Scenario 1: The Bounce Holds
If Bitcoin pulls back into the breakout zone and holds above the 100-day EMA, the chart starts to look like a proper rebound rather than just a quick squeeze higher. In that case, the move towards $83,681 becomes the next major target.
This area also aligns with the top band of the 100 EMA’s 1 standard deviation, which has shown to be a great estimation of where price may react.
This 100 EMA also aligns with the neckline of a “bottoming shelf” that has been forming since February, so basically – give or take – watch $75,000 for a potential long setup.
Scenario 2: The Bear Flag Is the Real Story
But, there is one elephant in the room we must address: the possible bear flag.
Price is grinding higher, but it is still doing so inside a relatively tight upward-sloping structure after a hard selloff.
Sorry bulls, but this just has to be said. We could simply just be building a bear flag, within an already suppressive 100-EMA band (1sd).
If Bitcoin cannot hold above $75,000, and the bear flag has a clear break and successful bearish retest, Bitcoin’s short term top could just have been set in front of our eyes.
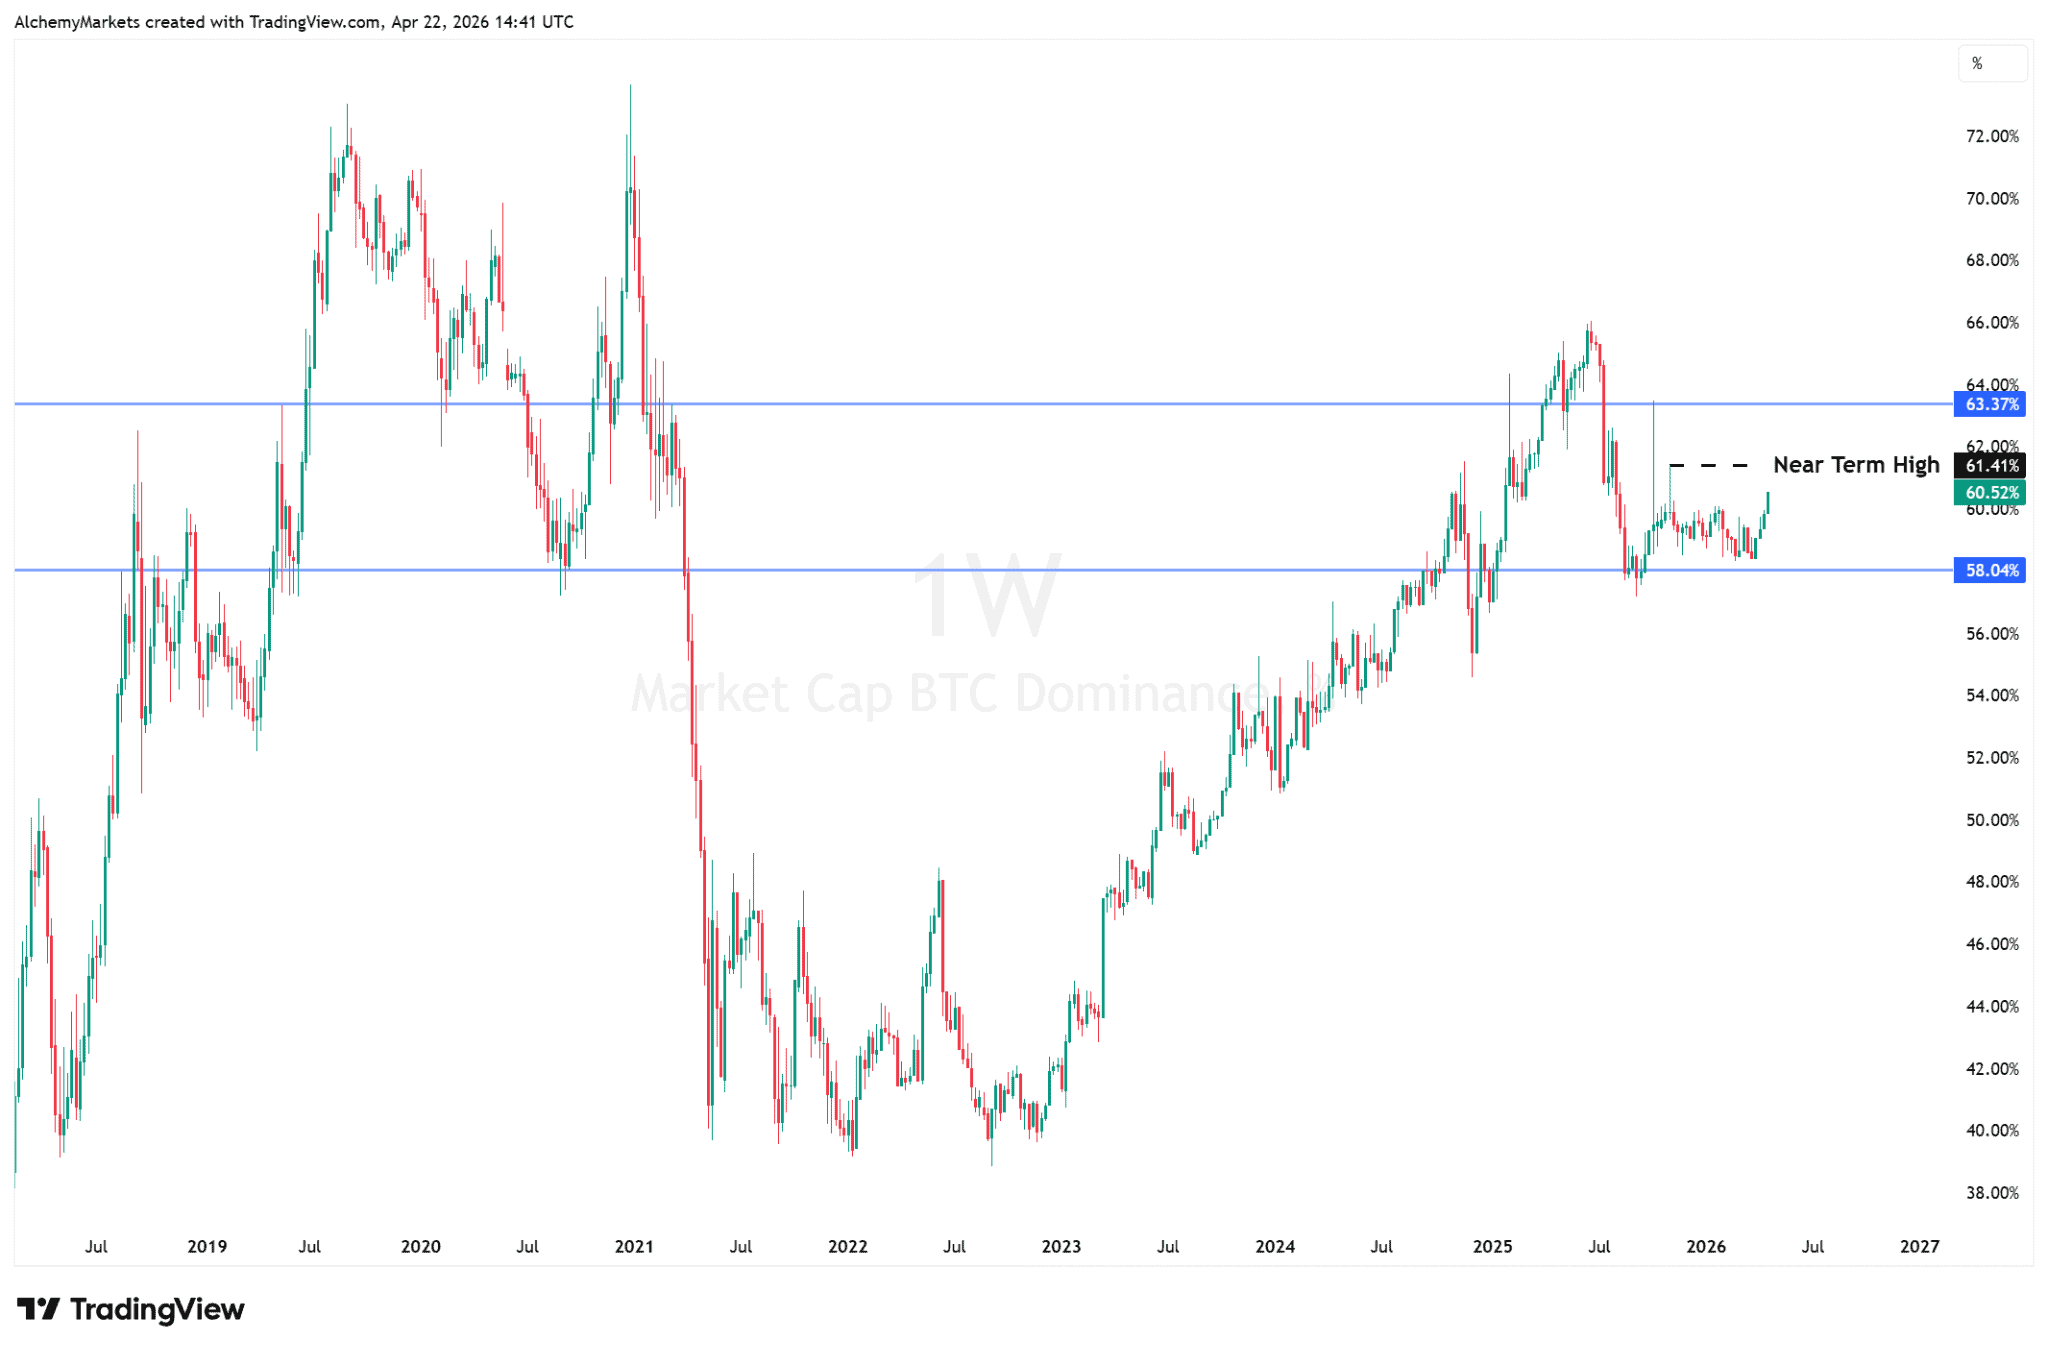
Helping the Bullish Case: Bitcoin Dominance
This is one reason the bounce setup still deserves respect. Bitcoin dominance has held above the 58% where it has refused to drop below – even as the index has flirted with the level repeatedly.
Near term high (Resistance) is at 61.41% and we’re not yet there – so the rally may still have legs.
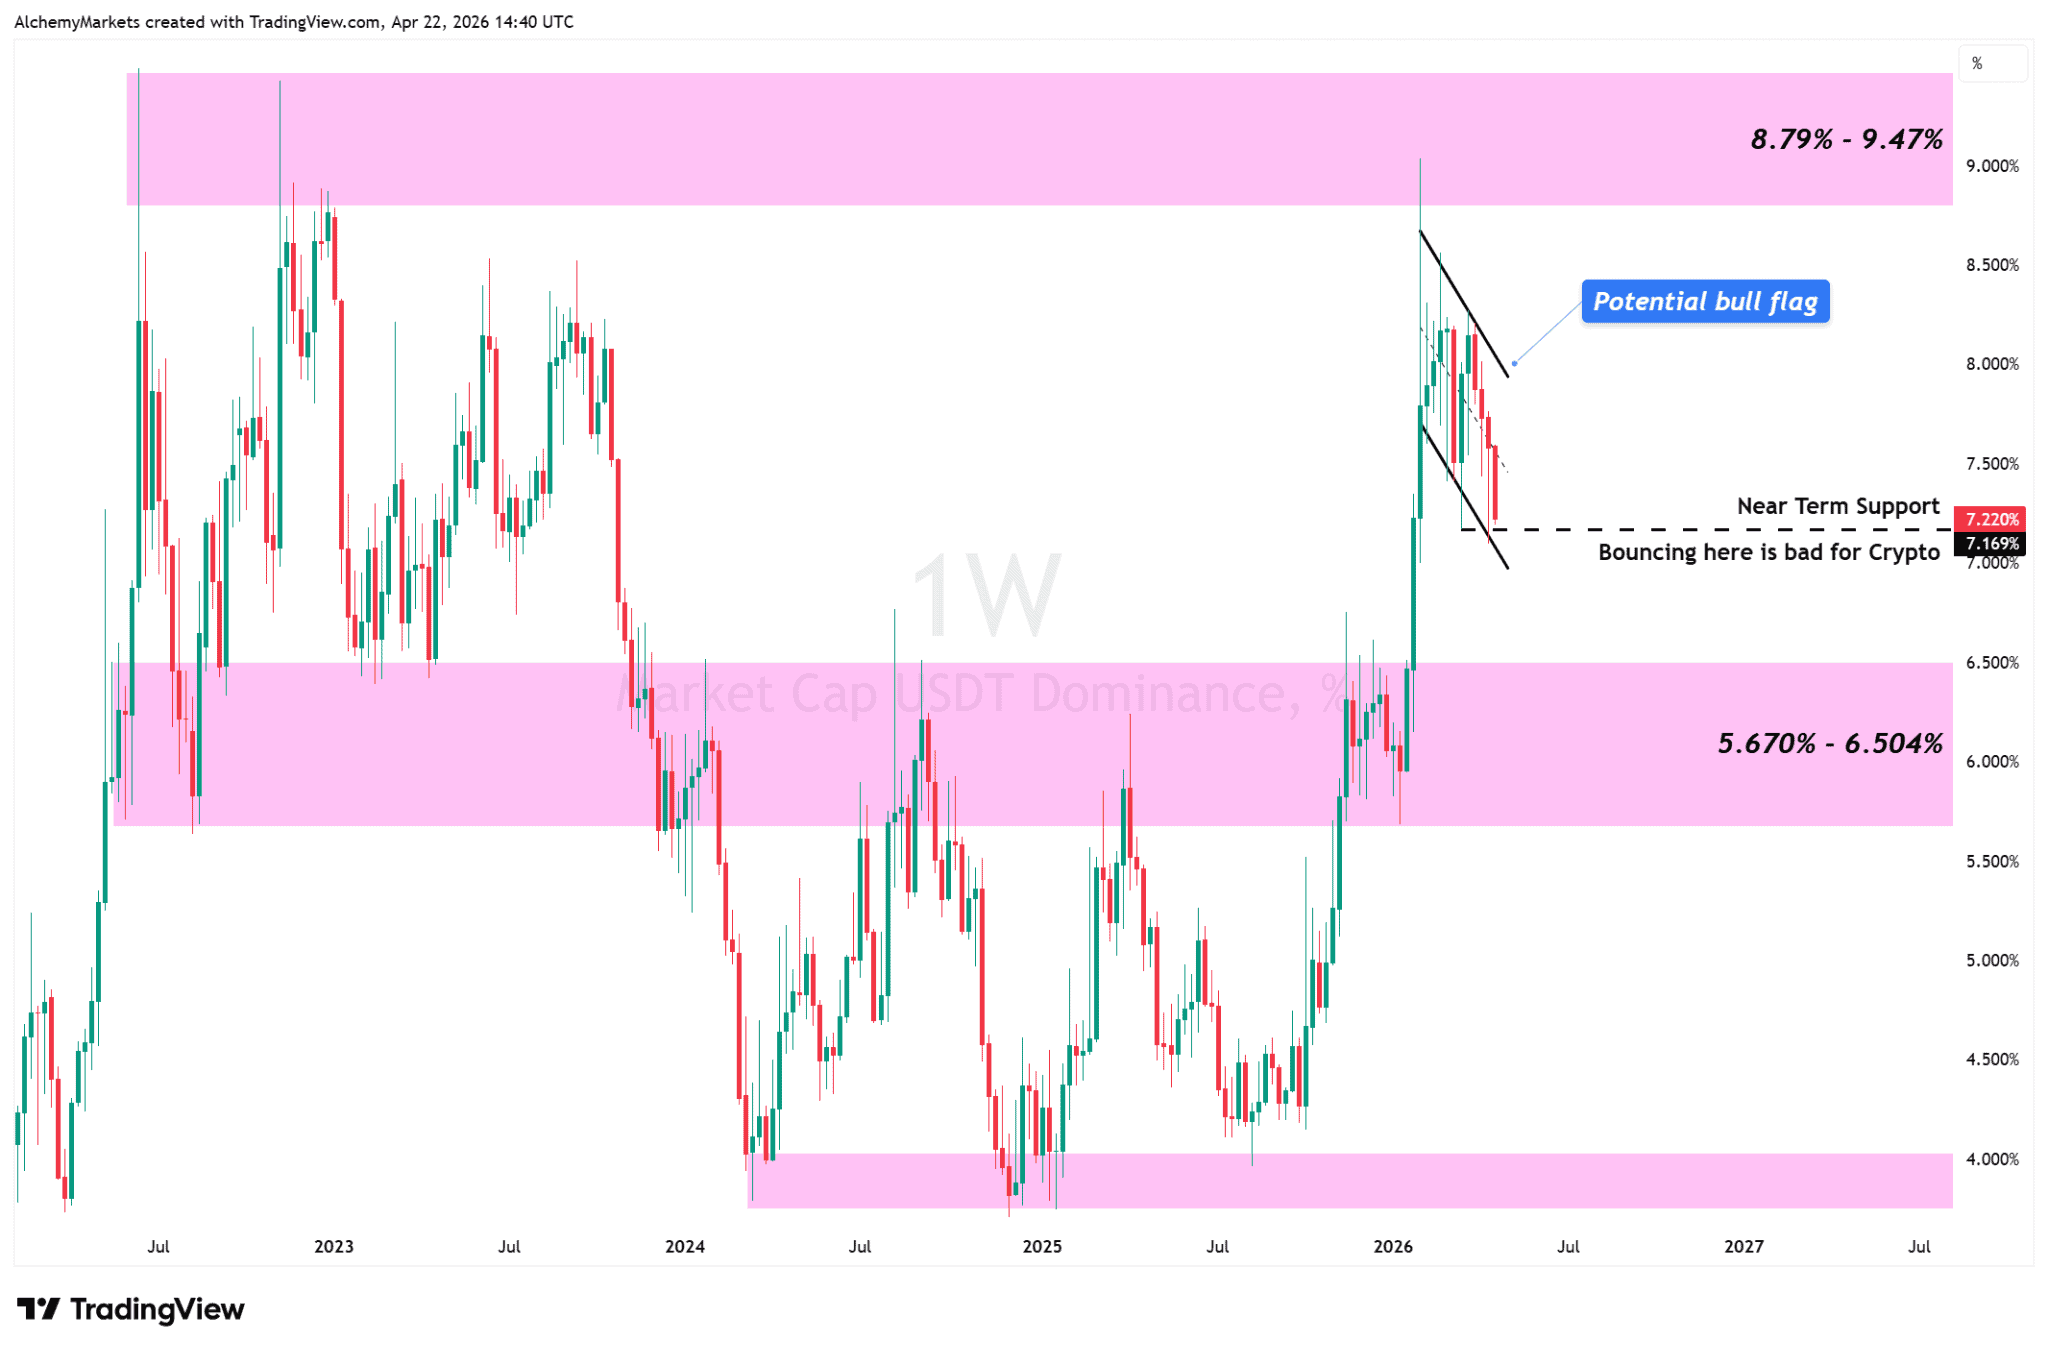
Helping the Bearish Case: USDT Dominance
USDT dominance can still be read as a possible bull flag. This is bad because USDT.D at high levels, or when it rises, represents more people rushing into USDT as a safe haven within the crypto space.
The chart is sitting on support around 7.20% to 7.28%, and if that area holds and starts bouncing, it would suggest money is still happy to sit in stablecoins rather than fully rotate back into crypto risk.
That would naturally make it harder for Bitcoin to keep pressing higher. The upper zone on that chart still sits around 8.79% to 9.47%, so there is enough room there for USDT.D to become a real headwind if support starts to hold too well.
Final Read
A bounce setup is in play. Bitcoin has broken the daily trendline, reclaimed the 100-day EMA, and opened the door to a move back toward $83,681.
That is the lead scenario as long as the breakout zone around $75,380 continues to hold.
The second scenario is still there in the background. If the retest fails, the bear flag becomes harder to ignore. And if USDT.D starts confirming its own bull flag, that caution will matter even more.
For now, the chart has improved enough to lean on the bullish side – at least in this editor’s opinion. However, risks still exist on a technical level to warrant a cautious outlook if BTC rallies.


