The simple moving average, also known as SMA, is an indicator beloved by many traders. It is an indicator used by traders to identify market trends, especially bullish and bearish trends. Below, you’ll learn how to use the indicator when trading the financial markets to identify trends and trading opportunities.
What Is a Simple Moving Average (SMA)?
A simple moving average (SMA) is used in technical analysis to help traders determine the direction of the price trend and where solid opportunities exist to enter and exit trades. The SMA is a trend indicator that is primarily used to identify an asset’s current trend, whether bullish or bearish.
As its name implies, the simple moving average (SMA) tracks the average price of an asset over a specific time period and plots the same on a price chart. Therefore, the SMA is a tool that smooths market price fluctuations and generates an easy-to-interpret line representing the average price action.
What Does a Simple Moving Average Indicate?
A simple moving average indicates the average price of an asset based on a specific number of periods. For instance, a 20-period SMA plots the average closing price over the past 20 bars.
Every time a new bar appears, the indicator adds the new closing price to the average while dropping the oldest price from the calculation. This process of averaging prices is repeated with each new bar resulting in a smooth line displayed on the price chart. Traders will then compare the actual price bars, and their location relative to the moving average indicator line.
How Are Simple Moving Averages Used in Technical Analysis?
Simple moving averages (SMAs) are used in technical analysis to identify trends, signal when a trend shifts from upward to downward (and vice versa), and determine dynamic areas of value as support and resistance.
Trend Identification:
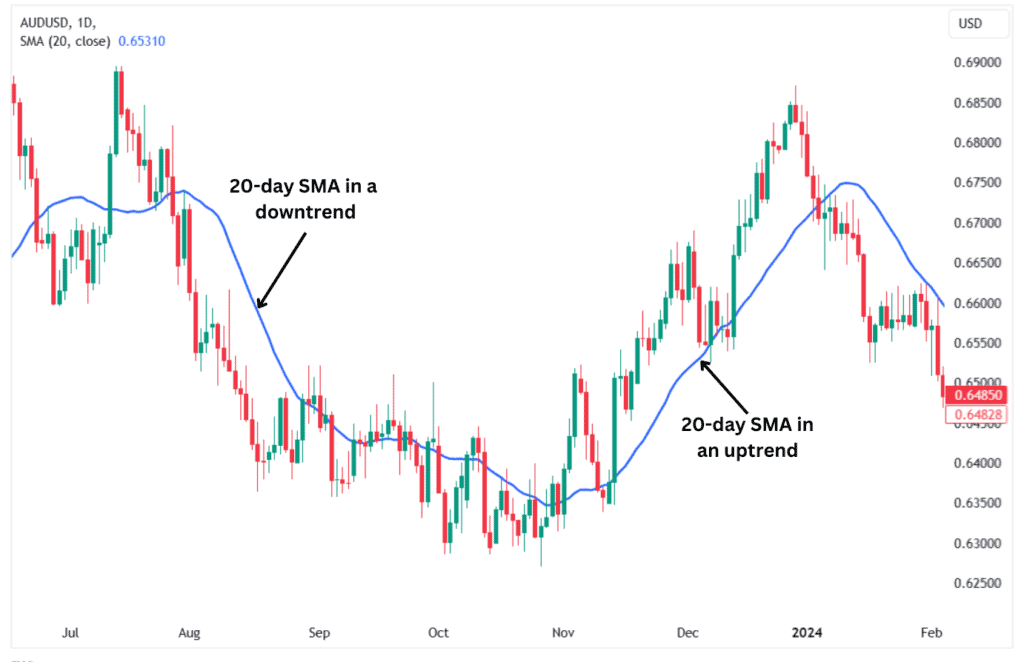
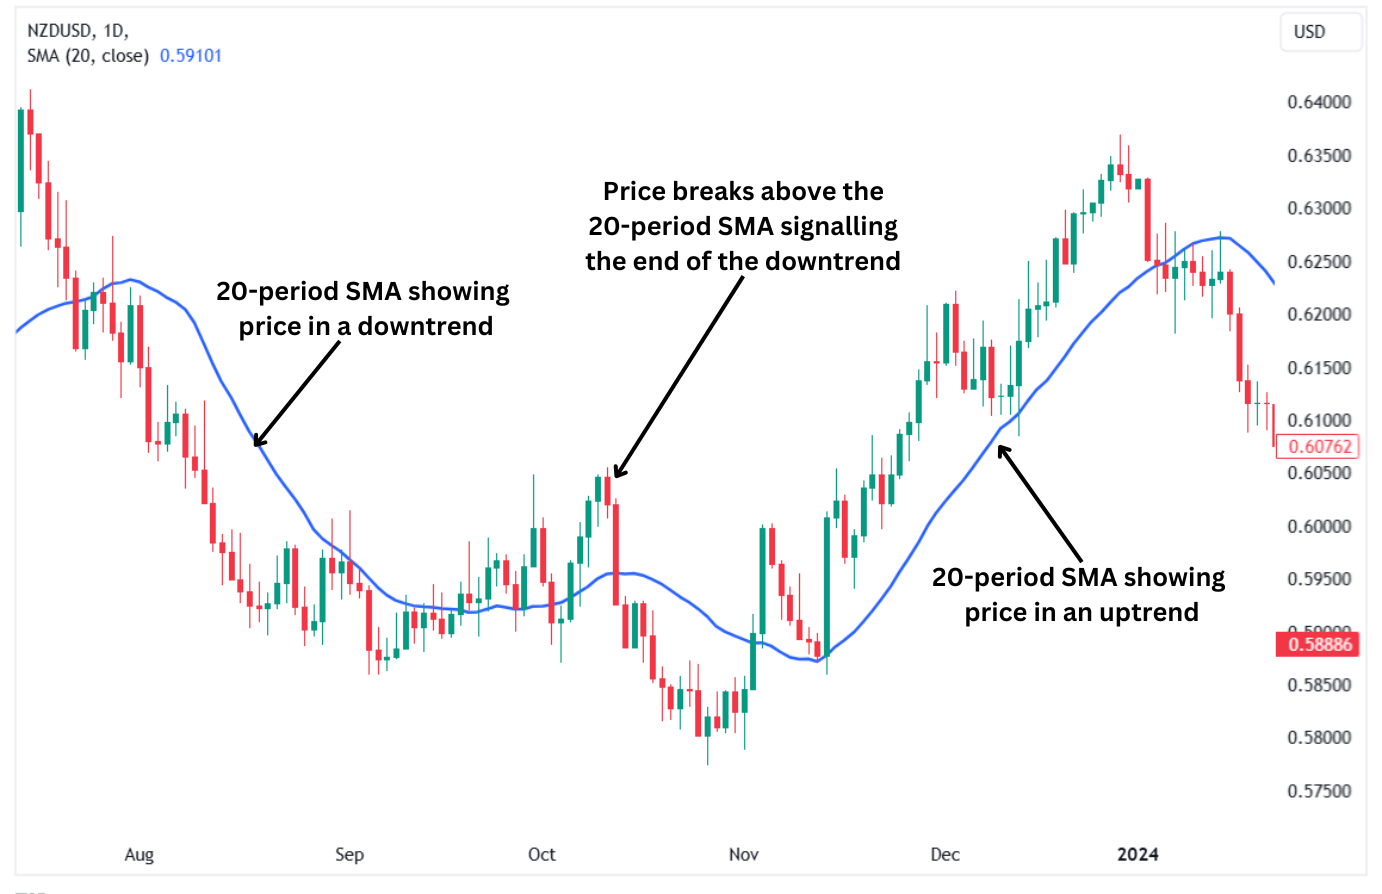
Based on the price’s relative position to the SMA, traders can easily identify whether the price is in an uptrend or a downtrend.
For example, an asset is considered in an uptrend if its price is above the simple moving average. The opposite is true for assets in a downtrend since their prices are usually below the SMA.
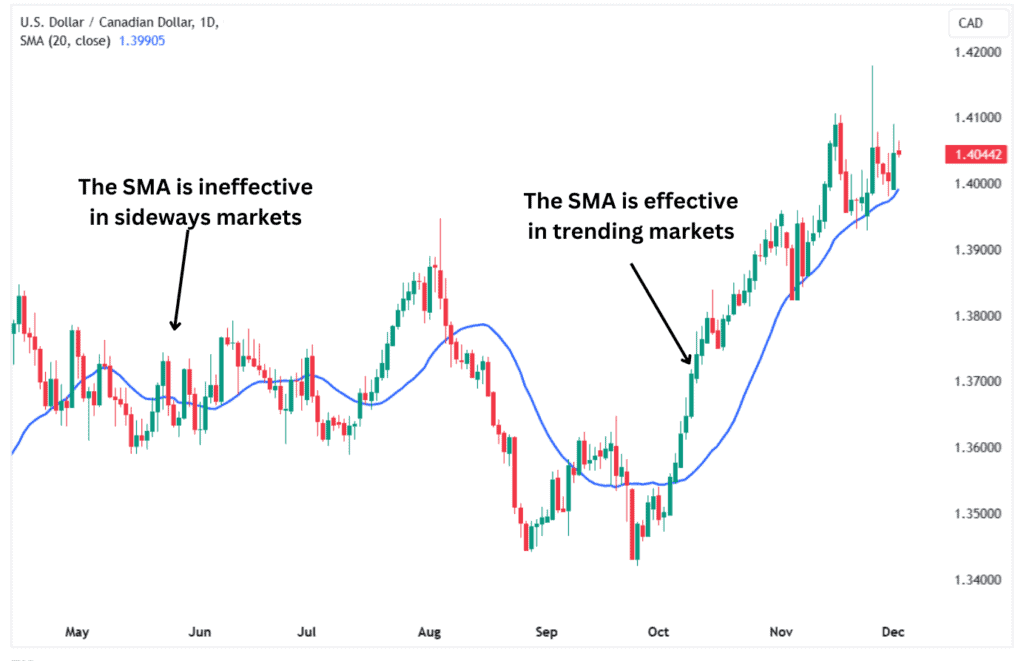
The simple moving average is most effective whenever an asset is trending. However, it can generate multiple false signals when an asset is trading sideways.
Trend Changes:
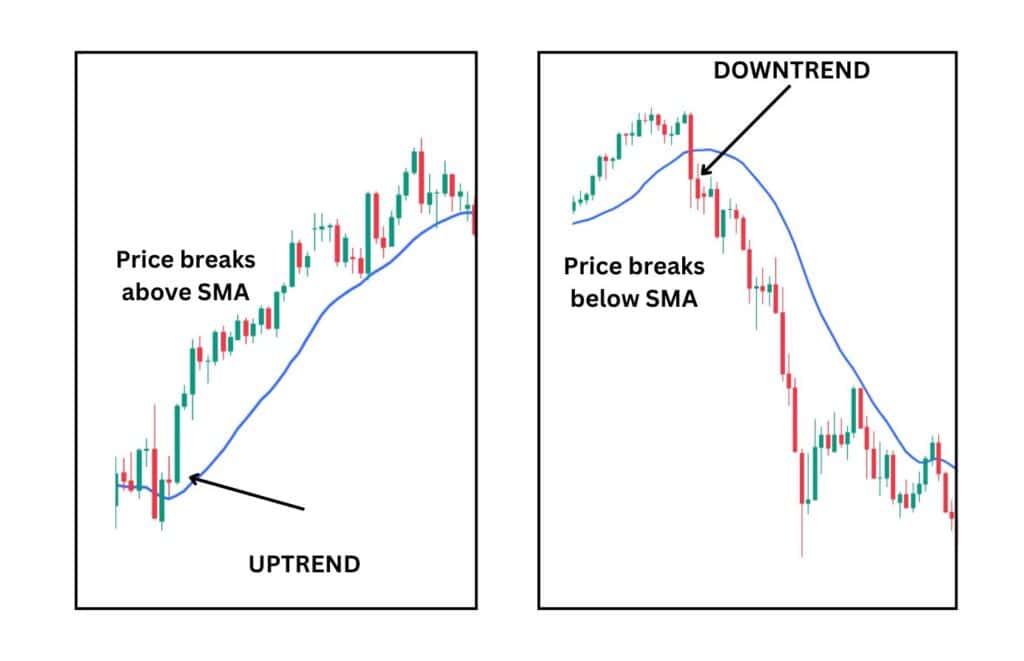
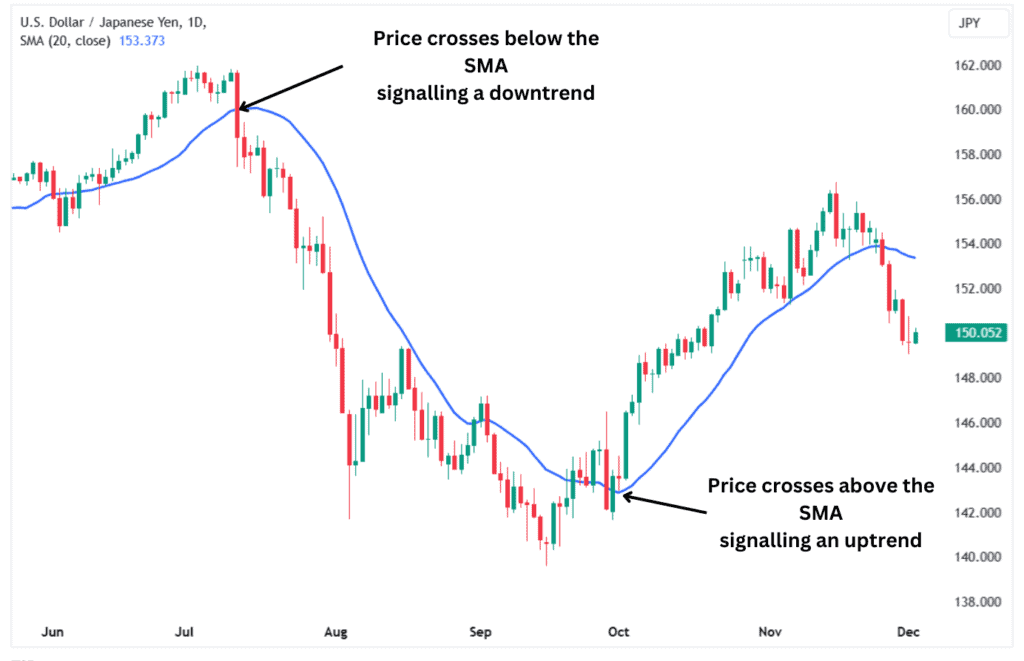
Whenever the price crosses above the SMA, it signals the beginning of a new uptrend. Conversely, when the price crosses below the SMA, it suggests that a new downtrend has begun.
Support and Resistance Indicator:
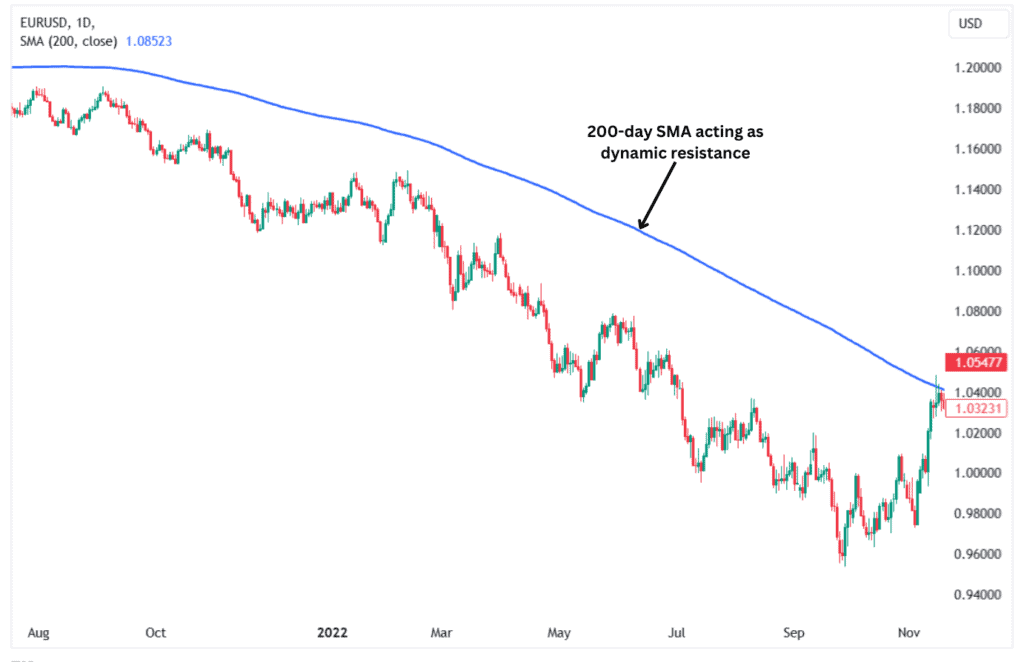
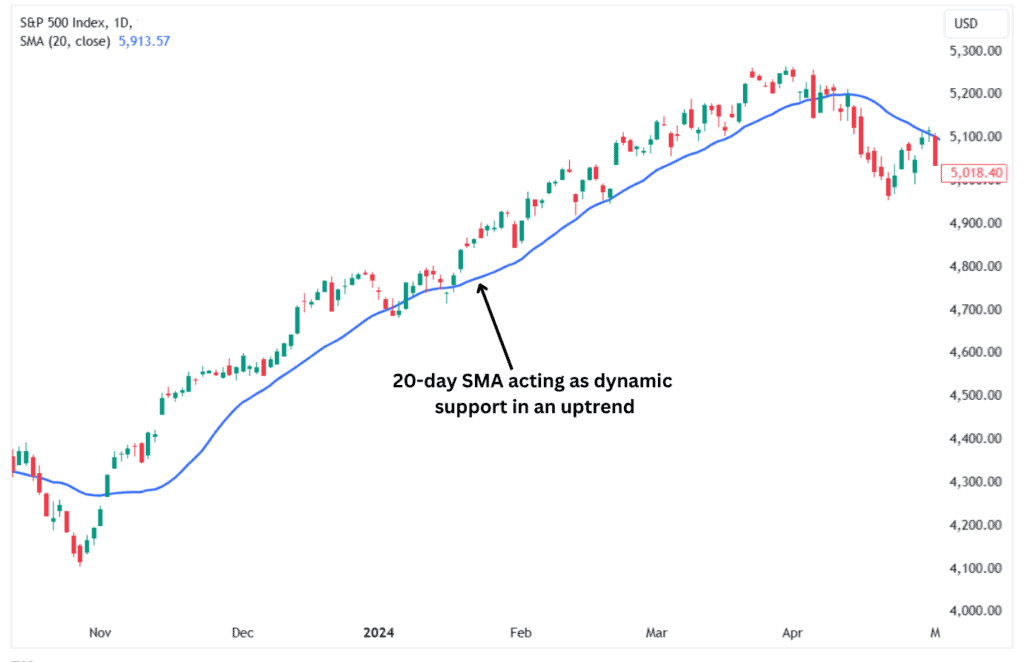
The SMA also provides areas of value within sustained trends. During a consistent upward trend, the SMA can act as dynamic support. When the asset’s price pulls back, the SMA indicates a relative value and buy zone within the uptrend.
The opposite is true of sustained downtrends, where the SMA may provide a ceiling that holds prices down. Eventually, the SMA ceases to act as dynamic support and resistance and the price crosses over to the other side.
Used Inside Other Technical Indicators:
Moving average also acts as a smoothing tool for other indicators, such as stochastics, MACD, stochRSI, and Average Directional Index (ADX). For example, the %D line for stochastics is a simple moving average of the %K line. Embedded within the Average Directional Index calculation is a simple moving average to smooth out its values. A central part to the Bollinger Bands®, is a 20-period simple moving average.
How to Calculate Simple Moving Average?
Calculating the simple moving average is fairly straightforward. First, decide the time period you want to include, as different time periods can significantly affect the calculation and interpretation of the SMA. The SMA will react faster to price fluctuations when you choose a shorter time period. Conversely, it will be less reactive to price fluctuations when you choose a longer time period.
After deciding the time period, you then add up the closing prices of all the bars specified in the period. This means that if you choose 20 periods, you will add up the closing prices for the past 20 bars. After getting the sum of the closing prices, you then divide by the number of periods to get the average. This average is then plotted on a price chart, with each new calculation generating a line, the simple moving average line, on the chart.
Example:
Let’s calculate the simple moving average for a stock based on the past 10 periods. This will be a 10-period simple moving average. The data set of closing prices for the past 10 periods are 25, 34, 45, 68, 53, 37, 49, 75, 86, 91.
To calculate running average of the SMA, we add the above prices and divide by the total number of entries (periods).
25+34+45+68+53+37+49+75+86+91=563
563 / 10=56.3.
The average price for the past 10 periods is 56.3. A trader would then analyse the current price of the asset relative to its 10-period moving average to make trading decisions. We’ll discuss some strategies further down the page.
The SMA will keep changing as new data is generated. The oldest period (the previous 10th period), will fall off while the new closing price is added to the calculation.
Simple Moving Average Formula
Given that the simple moving average allocates equal weight to all periods, its calculation is pretty straightforward.
You can use the formula below:
SMA = Sum of Closing Prices Over N Periods/ N
Where N is the number of periods.
How Do You Identify a Trend Using Simple Moving Averages?
The Simple Moving Average (SMA) indicator can help you identify trends by analysing the indicator’s position in relation to the asset’s price. If the asset’s price is above the simple moving average, it is in an uptrend. If the price is below the SMA line, then it is in a downtrend.
Therefore, it is extremely easy to identify trends using the simple moving average. However, the indicator loses its definitive edge when the price trades sideways. In such cases, the price oscillates both above and below the SMA, resulting in multiple false signals. Hence, you should use other indicators and tools whenever the price is trading sideways.
How Do You Read a Moving Average Ribbon?
A moving average ribbon comprises multiple moving averages plotted on a price chart with different period lengths. You could create a ribbon that includes simple moving averages with periods of 20, 50, 100, and 200.
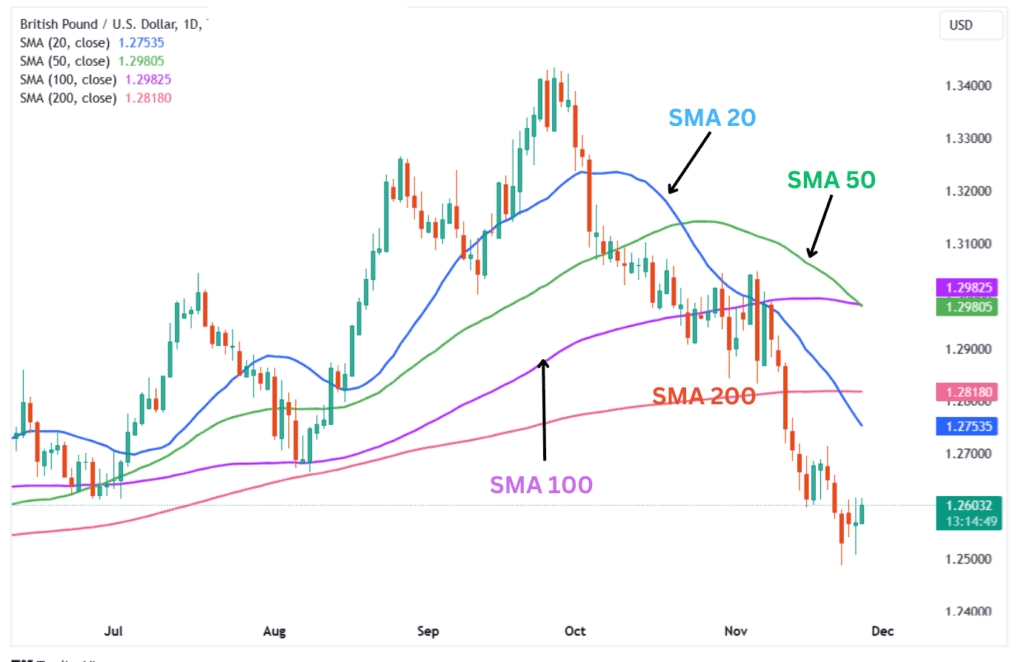
A moving average ribbon is read like a single moving average but with a twist. The trend is considered bullish when the shorter moving averages are above the longer moving averages on a price chart. The trend is considered bearish when the shorter moving averages are below the longer moving averages.
Often, the price and ribbons do not align perfectly, and there are instances when the price falls within the ribbon. For the price to be considered in an uptrend, it should be above the longest-period moving average. A similar concept applies to a downtrend, as the prices should remain below the longest-period moving average.
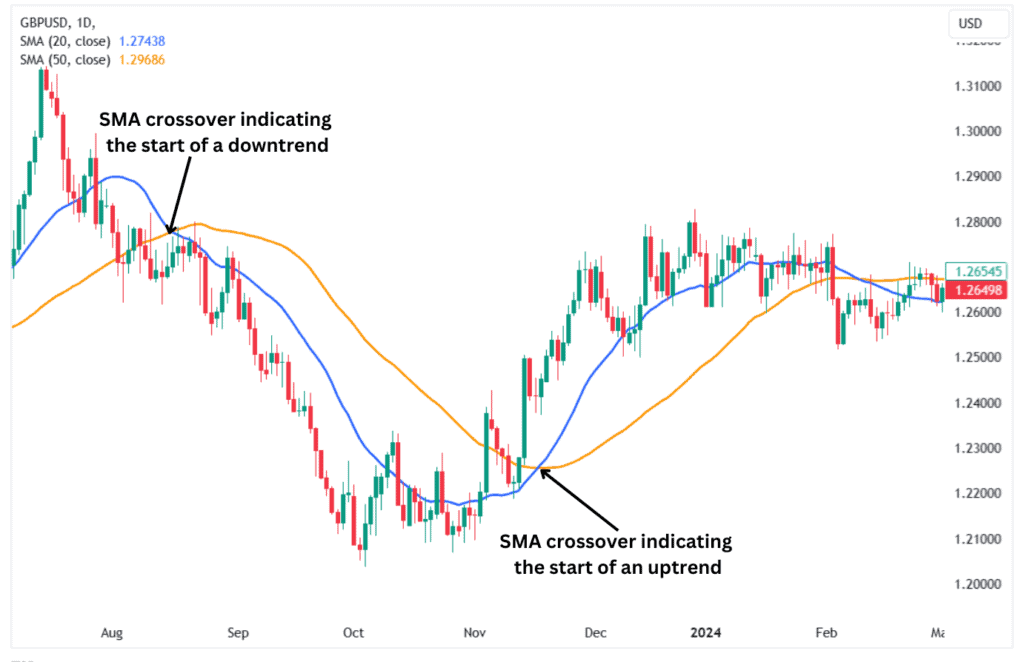
How Do You Read a Double Simple Moving Average Crossover?
A double simple moving average crossover occurs when two SMAs are plotted on a price chart. The crossover occurs when the shorter SMA crosses above or below the longer SMA. The double SMA crossovers usually signal the beginning of an uptrend or a downtrend. However, the crossovers are usually not very reliable.
You can read a double simple moving average crossover by monitoring which direction one of the moving averages crossed over the other. The shorter or longer SMA is fine, but choose one and use it consistently in your analysis.
For example, when a shorter moving average crosses above the longer SMA, it indicates the beginning of an upward trend. On the other hand, whenever the shorter SMA crosses below the longer SMA, it signals the beginning of a downtrend.
A Word of Caution
A double simple moving average crossover is often unreliable, as it typically provides late trade entry and exit signals. The trend is often already underway by the time the crossover occurs. This issue is particularly pronounced with longer SMAs, such as the 100 and 200-period SMAs, which are slower to identify trends and may cause technical traders to miss significant portions of a market move. Technical traders typically use additional indicators and tools to confirm trades before acting on a simple moving average crossover to address this limitation.
To compensate for this, traders could use price structure and candlestick patterns to identify potential trend changes at support or resistance levels. Reversal chart patterns such as the head and shoulders, double top or double bottom, and the rising wedge or falling wedge are helpful in identifying potential turning points where new trends are beginning. You can also use support and resistance zones to identify potential trend turning points.
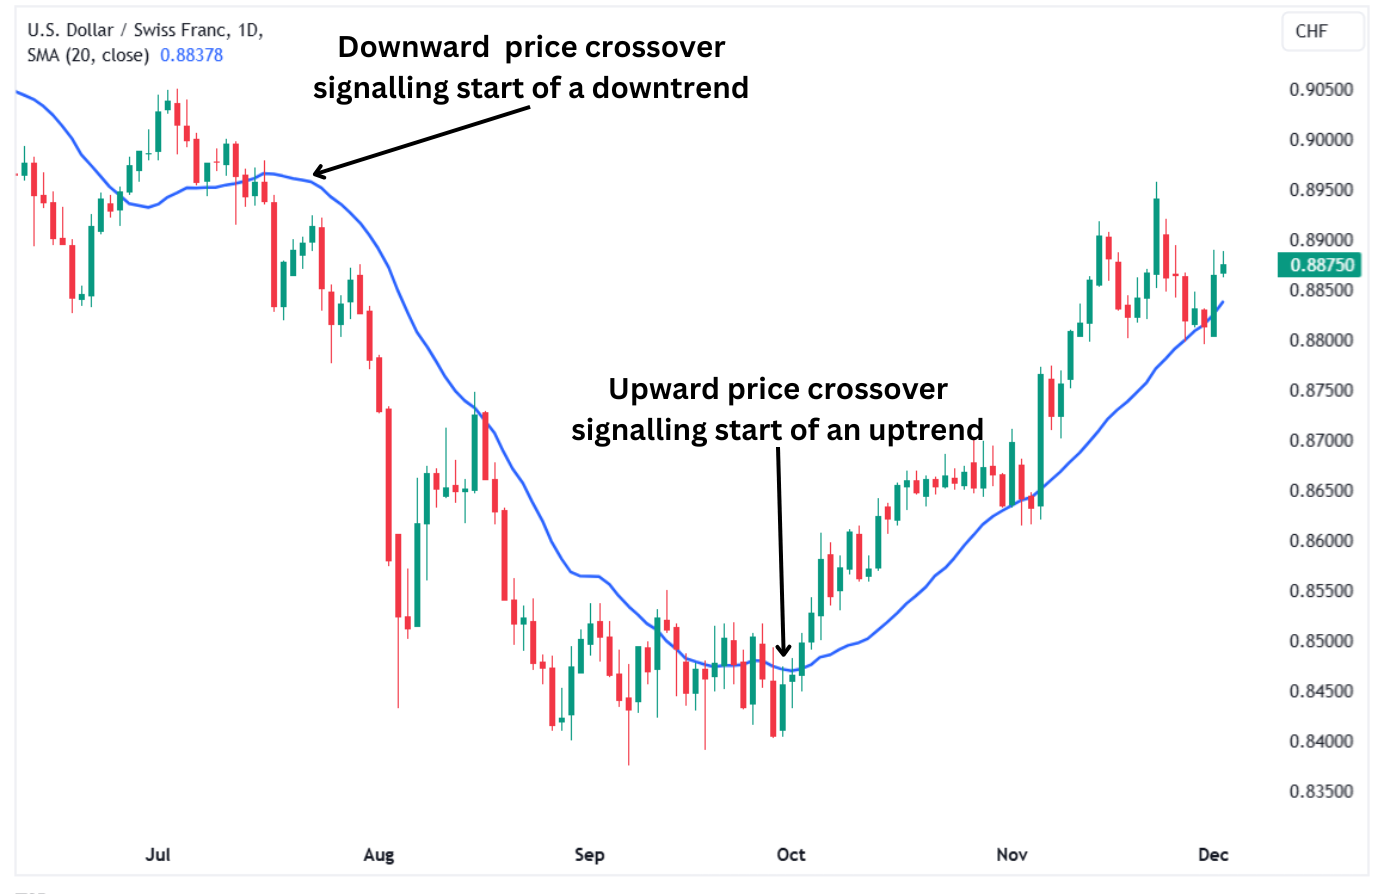
How Do You Interpret Price Crossing a Moving Average?
To interpret the price crossing a moving average, we must identify whether the price crosses over from below or above the moving average. Whenever the price crosses above the simple moving average, it indicates the beginning of an uptrend. Conversely, when the price crosses below the moving average, it usually signals the start of a downtrend.
Simple Moving Average Examples
Here are some examples of simple moving averages when applied to different asset classes. These charts showcase how the moving averages can be applied to forex pairs, commodities, cryptos, stocks, and indices.
Bitcoin Uptrend Example:
Below is an example of Bitcoin rallying higher, supported by the 20-period simple moving average. This is an excellent example of a swing trade that could have seen a trader profit from the majority of the move that began in late September 2024.
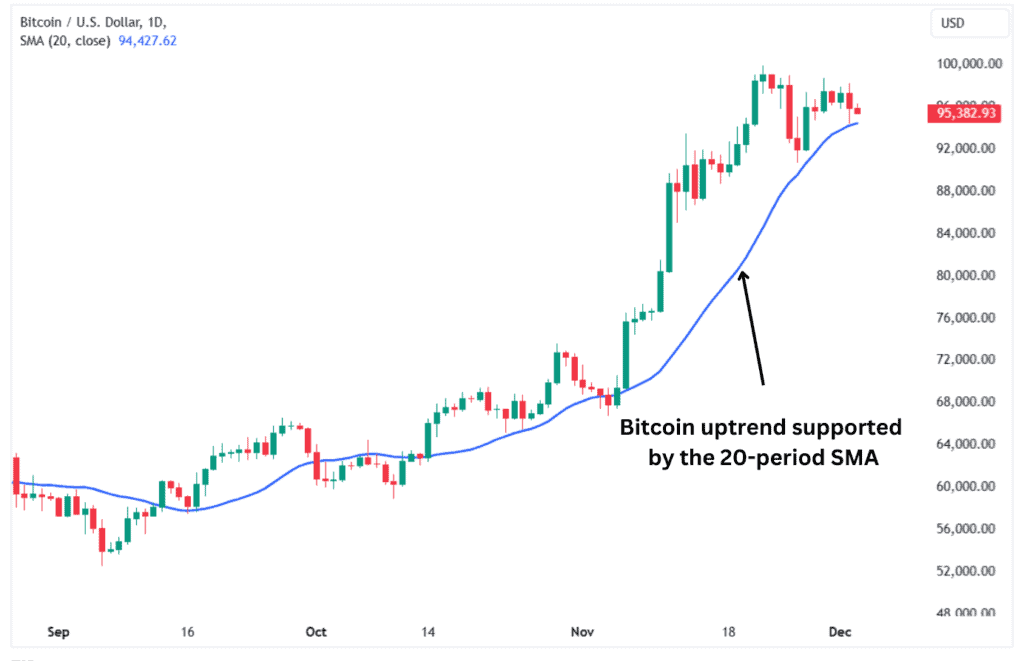
The Bitcoin price kept bouncing off the 20-period SMA during the uptrend, which is still in play. The uptrend was not over yet, as Bitcoin was still trading above the 20-day SMA at the time of writing.
EURUSD Moving Average Trend Change Example
The chart below highlights the crucial role of price crossing above a moving average in identifying the start of a downtrend and an uptrend. This example is based on the EURUSD daily chart, which is the most popular currency pair among traders.
The above chart clearly shows how the SMA price crossovers led to a sustained uptrend and downtrend. At the time of writing, the SMA crossover signalled another downtrend in the EURUSD currency pair.
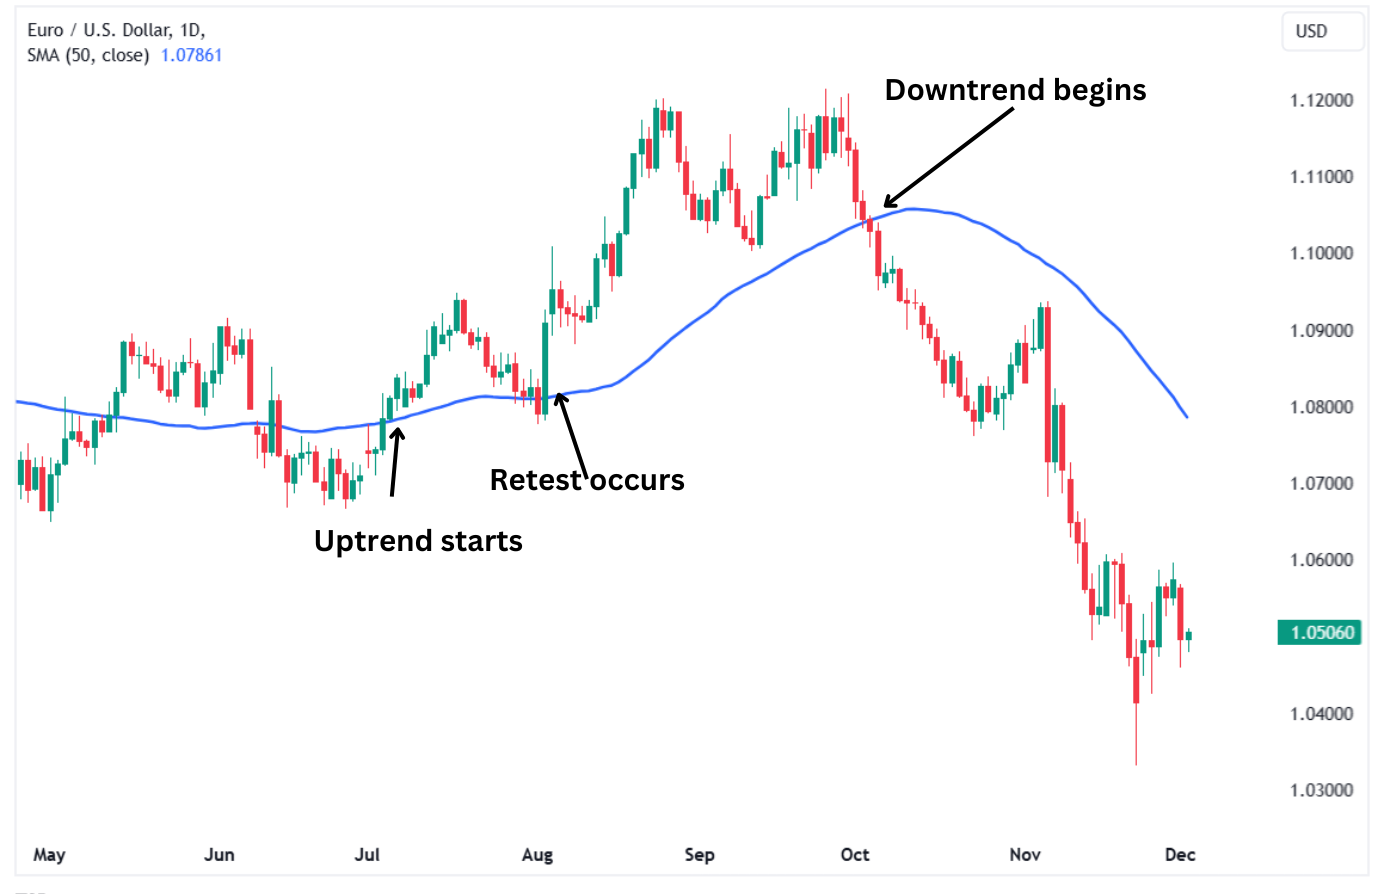
Gold Simple Moving Average Uptrend Example
This section will look at the simple moving average crossover on the gold chart. Traders widely prefer gold as a commodity and trade it as a CFD or a futures contract. In this example, we shall focus on gold CFDs, which we offer at Alchemy Markets.
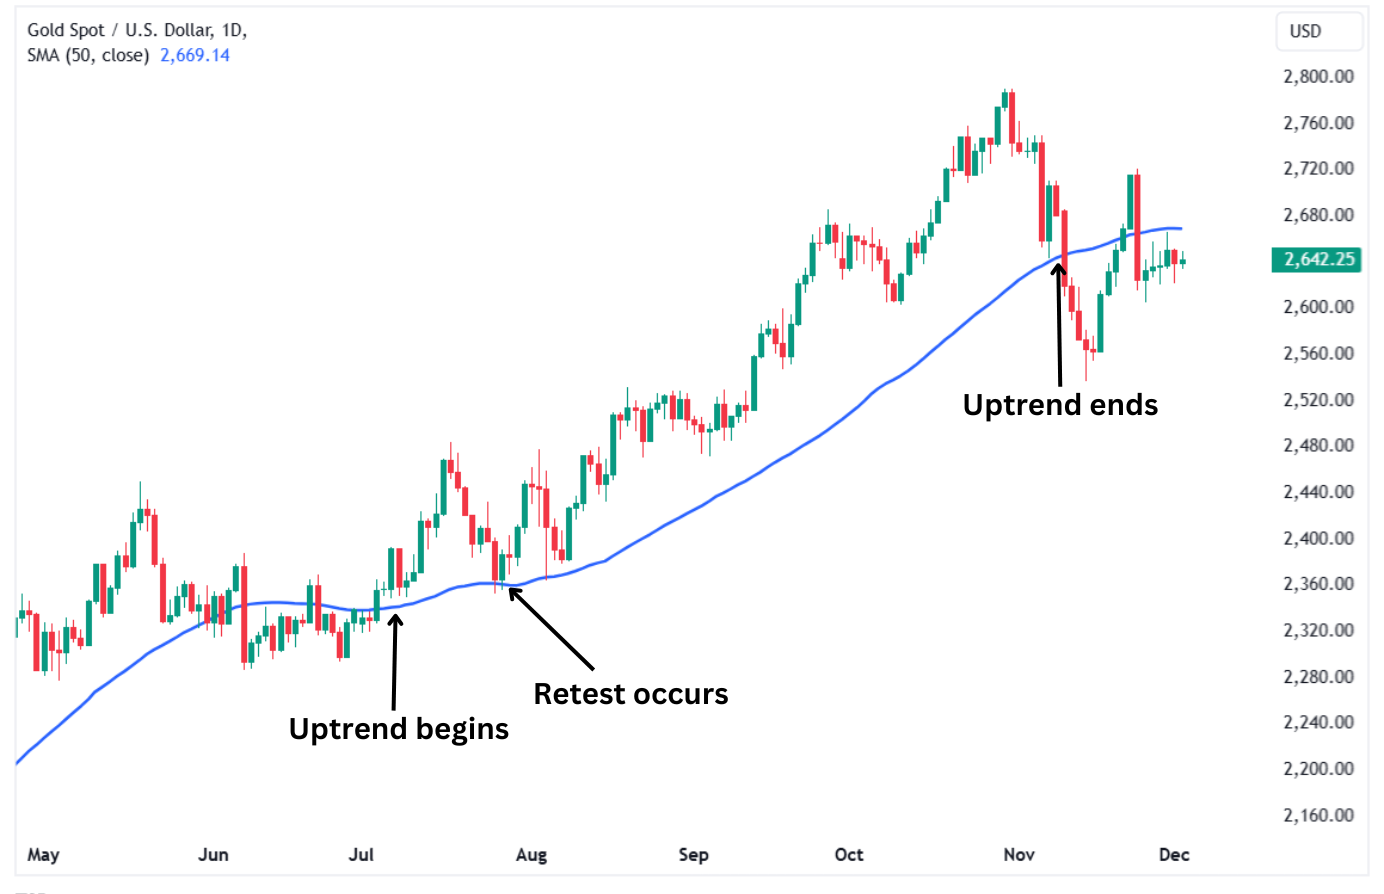
The above chart shows where an uptrend begins after the price crosses above the 50-period moving average and when the trend ends as the price crosses back below the 50-period moving average. The chart also highlights a retest of the 50-period SMA as a support level before the trend continued higher.
Alphabet (Google) stock price moving average example
The chart below illustrates how GOOGL stock performed after price crossed above the 50-period simple moving average that supported a massive rally in its stock price over several months. Traders could have easily used the moving average price crossover signal to capture most of the move higher.
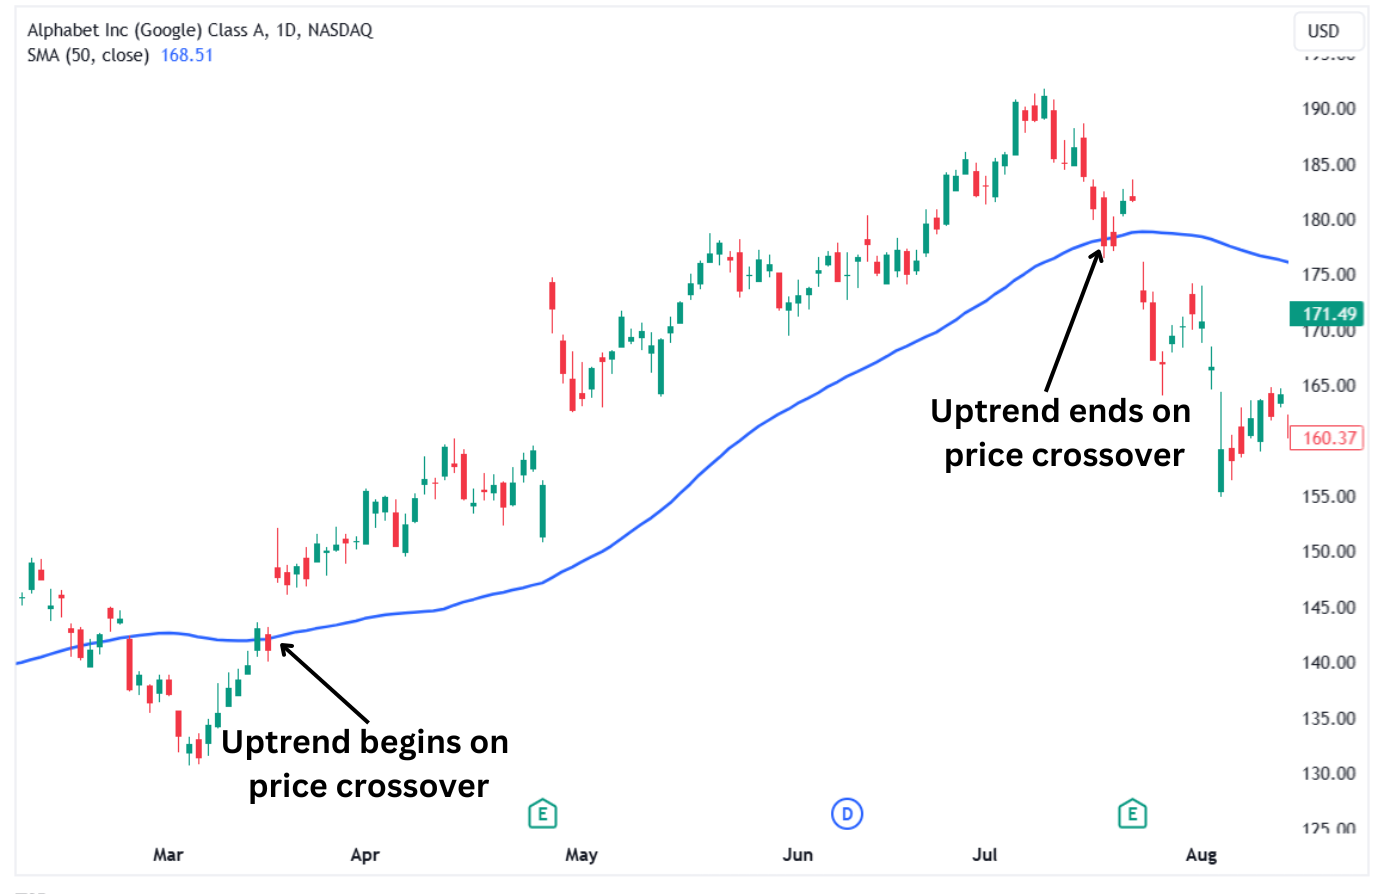
Swing and position traders could have taken advantage of the above opportunity in Google’s stock price to book significant gains from buying and holding the stock for months. This shows how vital SMA crossovers can be to long-term traders.
S&P 500 Index Example
The chart below highlights the sustained uptrend in the S&P 500 index after the price crossed above the 20-period moving average. The trend change occurred in early November 2023, leading to a sustained uptrend up to early April 2024.
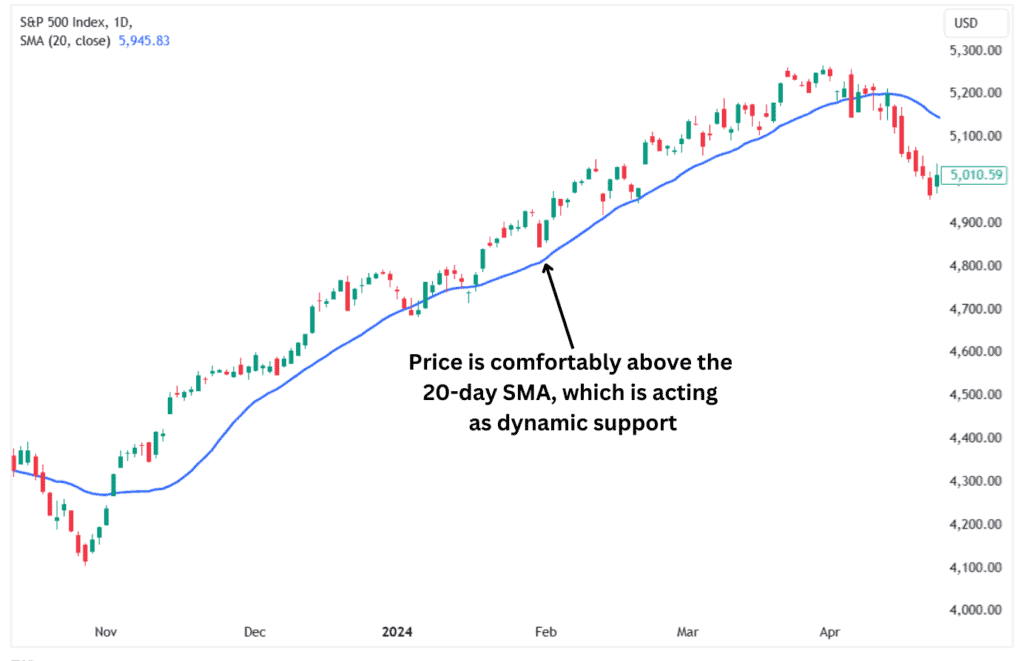
Long-term traders could have greatly benefitted from the above setup if they entered buy trades after the price crossover and got out when the reverse crossover occurred.
Golden Cross Example
A golden cross is a specific type of dual moving average crossover. The golden cross is a bullish technical analysis chart pattern occurs when a shorter moving average crosses above the longer moving average. The most common moving averages used in the golden cross is when the 50-period SMA crosses above a longer 200-period SMA. Traders and market pundits will use this is a longer term signal for a larger uptrend in force.
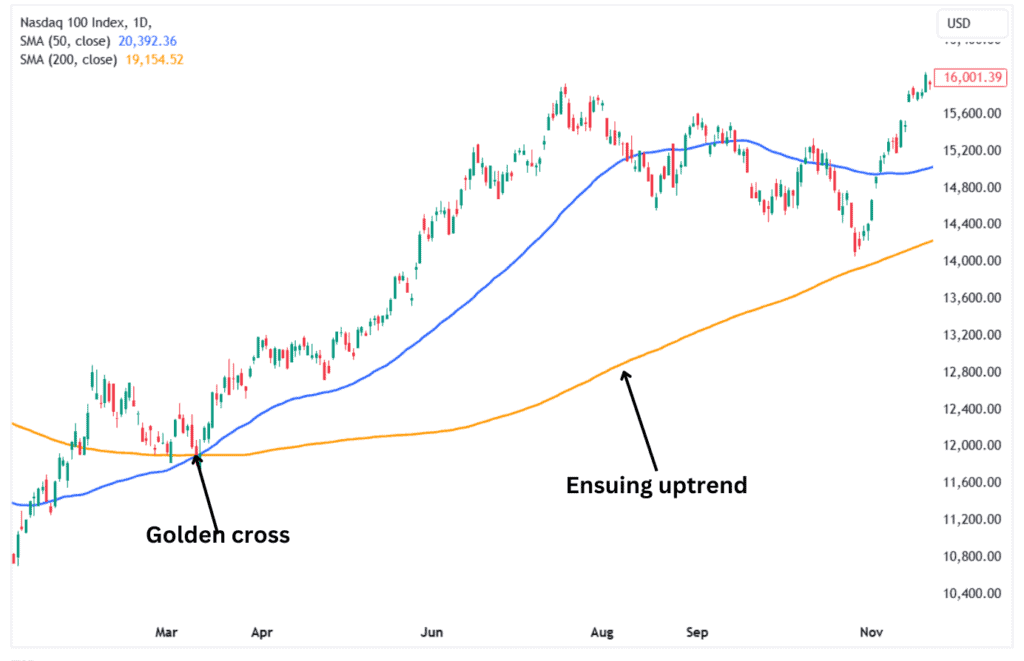
When the market is in a long-term sustained bullish trend, the golden cross can work as a bullish reversal chart pattern, but confirming the trade entry signal with other confluences is always prudent. Traders can look at the volume accompanying the crossover, which signals that the buyers are now in control. However, it is important to note that the pattern only works in trending markets and can generate false signals in sideways markets.
Death Cross Example
A death cross is the polar opposite of a golden cross. The death cross is when a shorter-term moving average crosses below the longer-term moving average. Again, the most common input values are when the 50-period simple moving average crosses below the 200-day simple moving average.
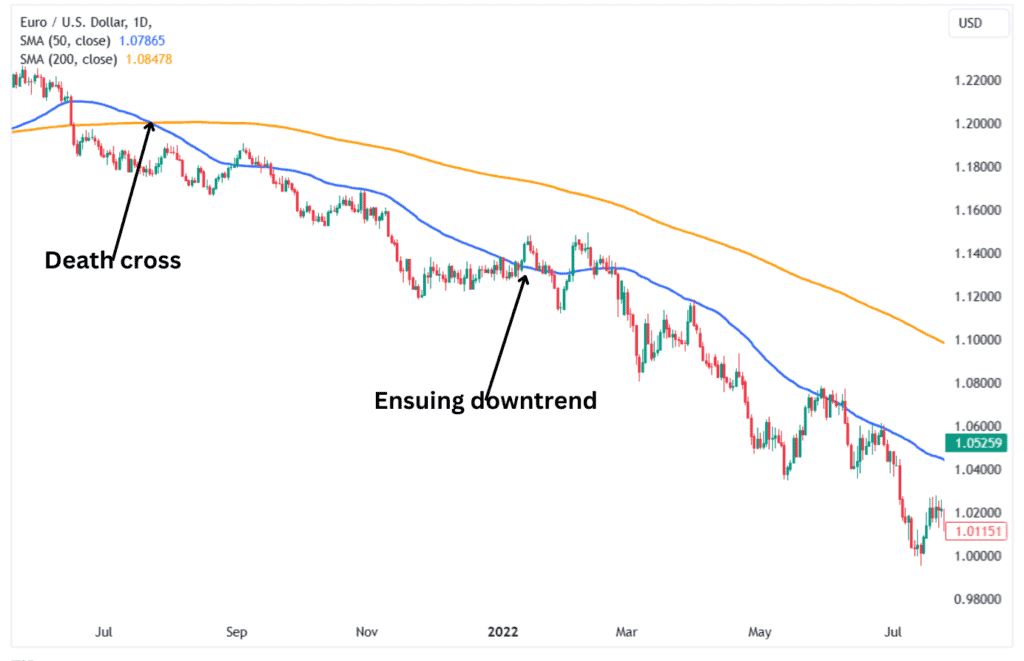
Traders typically consider a death cross as a bearish signal. The price moves in favour of the sellers, who push it lower for an extended period. When longer-term bearish trends are in place, the death cross can help traders confirm the bearish momentum, particularly when significant volume supports the move.
You can also confirm the trade signal using other indicators, such as the relative strength index (RSI) being in the overbought territory before the death cross. However, you should note that the death cross works best in trending markets but may lead to false signals in sideways markets.
Simple Moving Average Trading Strategies
There are multiple strategies that investors can utilise when trading with the simple moving average. Here, we shall delve deeper into these strategies, such as buying and selling on SMA intersections, the SMA crossover strategy, and identifying support and resistance. We shall also explore the Guppy multiple moving average and SMA forecasting.
Buying and Selling on SMA Intersections
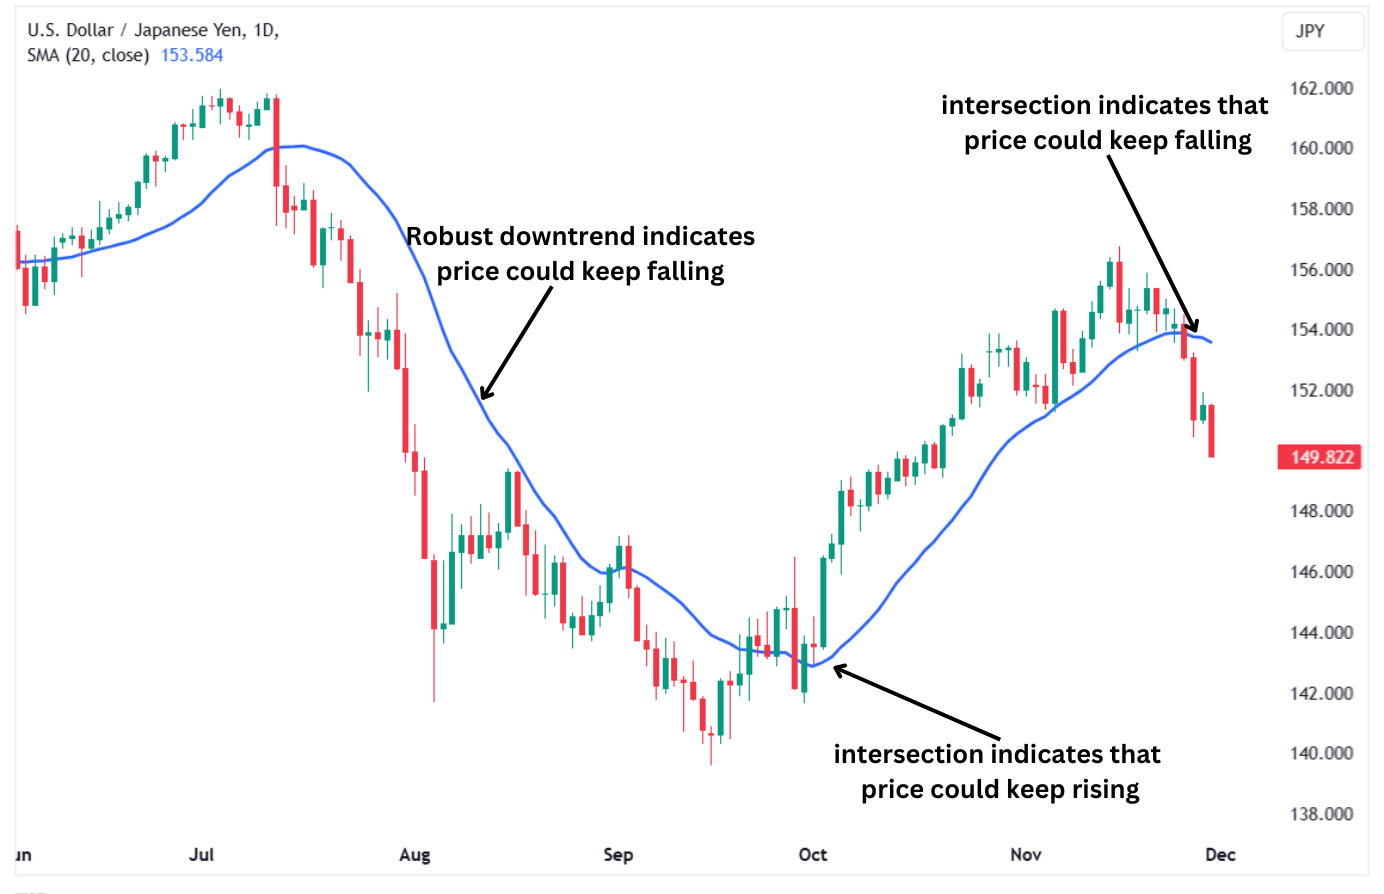
As demonstrated above, the moving average calculates the average price over the past few periods or bars. When the price breaks across this average, it typically signals a change in the market sentiment, leading to a change in the price trend.
Therefore, the most straightforward method to trade using the simple moving average (SMA) is to buy and sell whenever the price intersects with the SMA. For example, you can buy an asset whenever its price crosses above the SMA, while you can sell the same asset whenever its price crosses below the SMA.
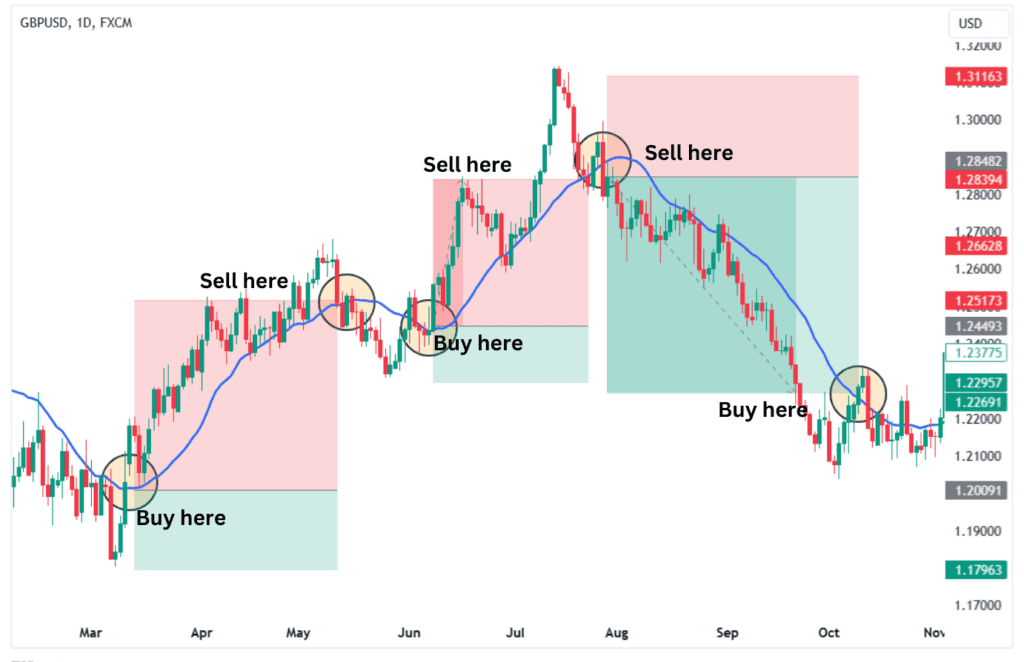
The above chart shows that whenever the price crosses above the SMA, it continues rising for a while. The opposite is true when the price crosses below the SMA since it tends to continue falling for a while. Therefore, you can use these intersections as trade entry and exit signals.
However, you must remember that the SMA is based on historical data, so it tends to lag behind the current price. Hence, it tends to identify trends once they have already begun.
SMA Crossover Strategy
The SMA crossover strategy involves two simple moving averages (SMAs) plotted on the price chart. The SMAs usually have different lengths, with one being shorter than the other. Some common SMA pairings include the 20-period SMA plotted against the longer 50-period SMA. Though double moving average crossovers are easy to read, they are not the most reliable trend indicators.
However, traders widely use the 50-period and 200-period SMAs to identify medium- to long-term trends in the markets. Traders use the bullish and bearish intersections of the two SMAs to confirm trend direction. We refer to the crossovers of the two SMAs as the golden and death crosses, as we previously discussed.
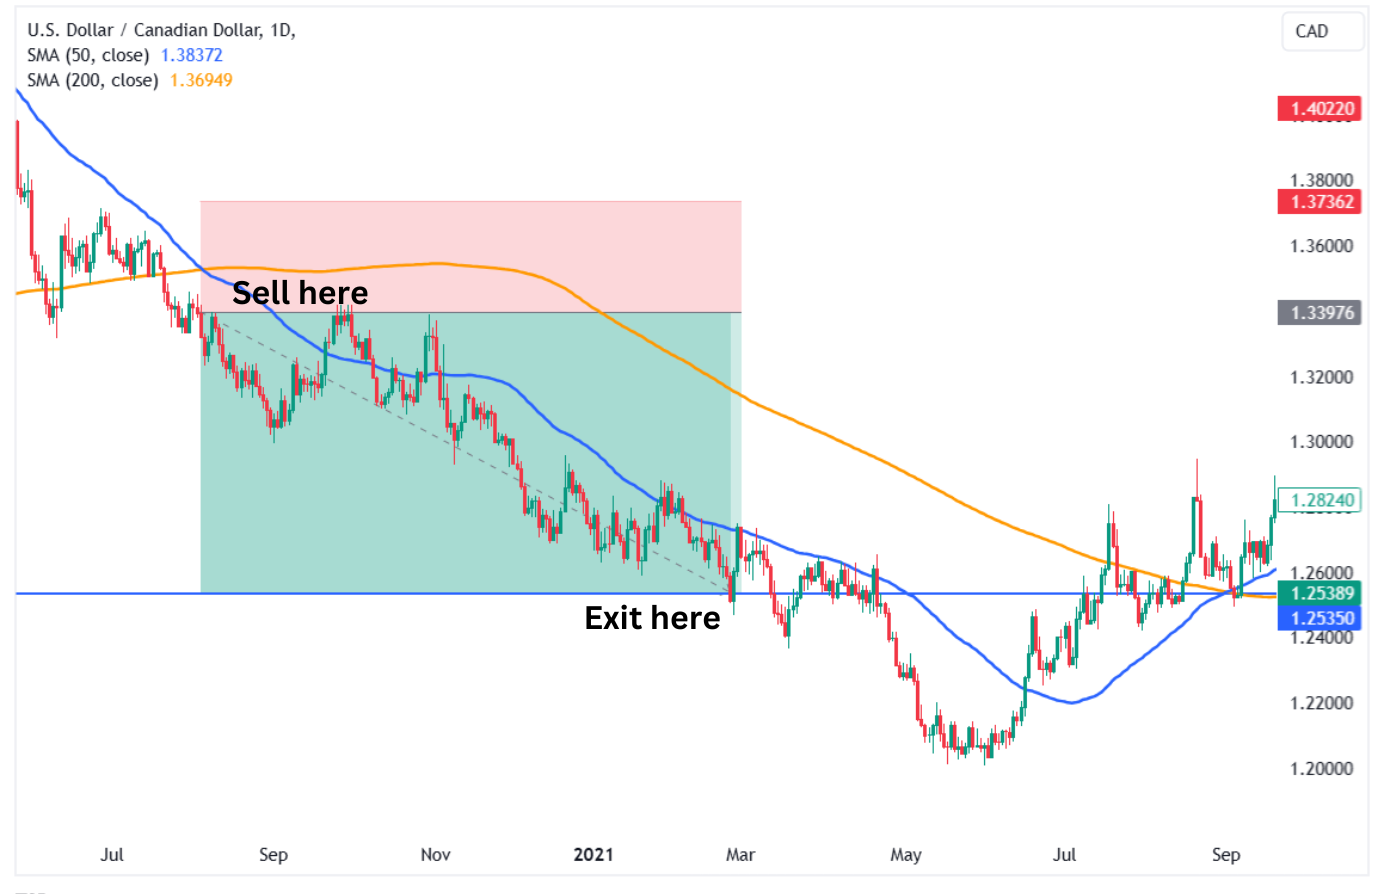
The big downside to the dual moving average crossover is that is typically doesn’t appear until well after the new trend has begun. This can mean you arrive late to the trend reducing the potential reward on the trade.
Identify Support and Resistance
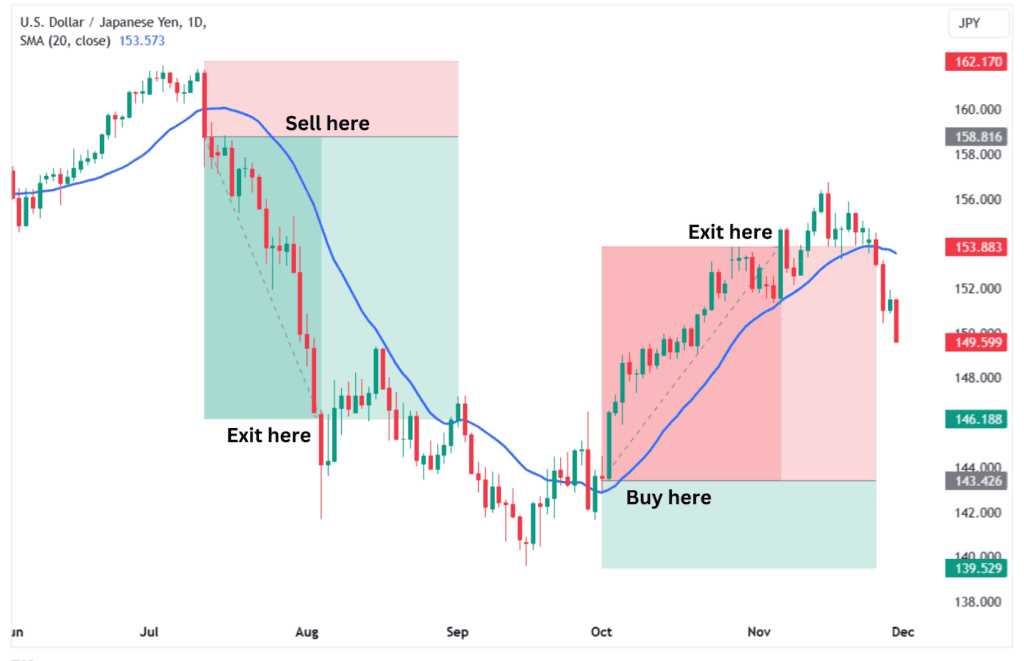
The SMA can sometimes act as dynamic support or resistance underpinning the price as it either rallies higher or declines. You can use the SMA as dynamic support or resistance to set up your trades and profit from market trends, as shown in the chart below.
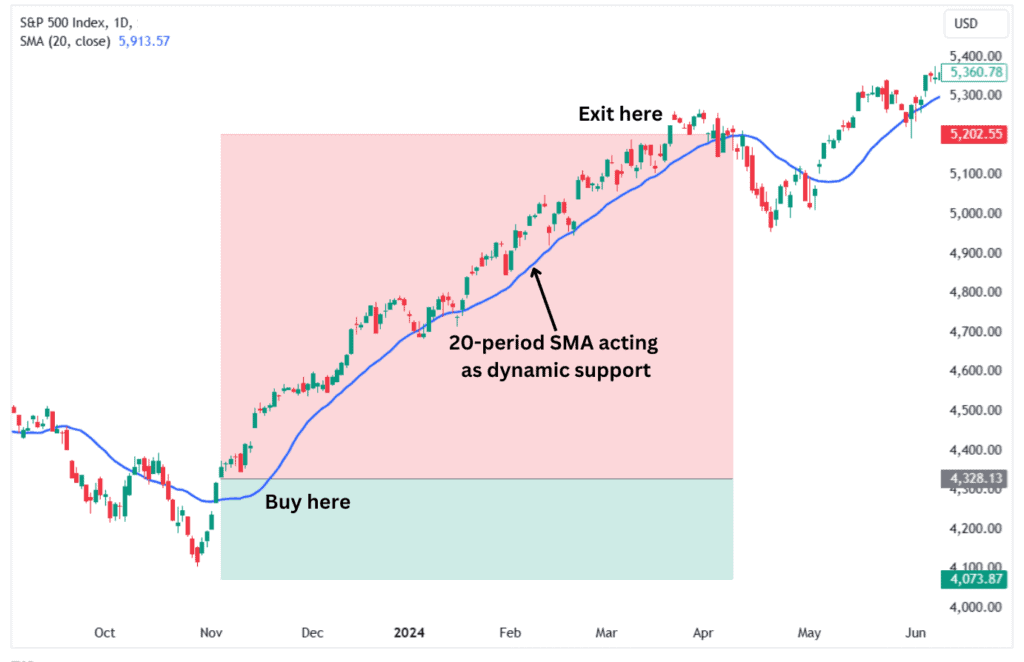
The above chart shows that traders could have significantly benefitted from the rally in the S&P 500 by treating the 20-period SMA as dynamic support. With this strategy, the rule is to exit the trade once the price convincingly closes below the SMA. In a downtrend, the rule is to sell when the SMA acts as dynamic resistance and exit when the price firmly closes above the SMA.
Guppy Multiple Moving Average
The Guppy Multiple Moving Average (GMMA) is a technical indicator created by Daryl Guppy, an Australian trader and author. It consists of multiple long-term and short-term exponential moving averages (EMAs) grouped to form two distinct ribbons, as shown in the chart below.
The short-term group consists of 6 EMAs, which are the 3, 5, 8, 10, 12, and 15 period EMAs, while the long-term group comprises of 6 EMAs, which are the 30, 35, 40, 45, 50, and 60 EMAs. The short-term EMAs represent the activity of short-term traders in the market, while the long-term EMAs represent the behaviour of long-term investors in the market.
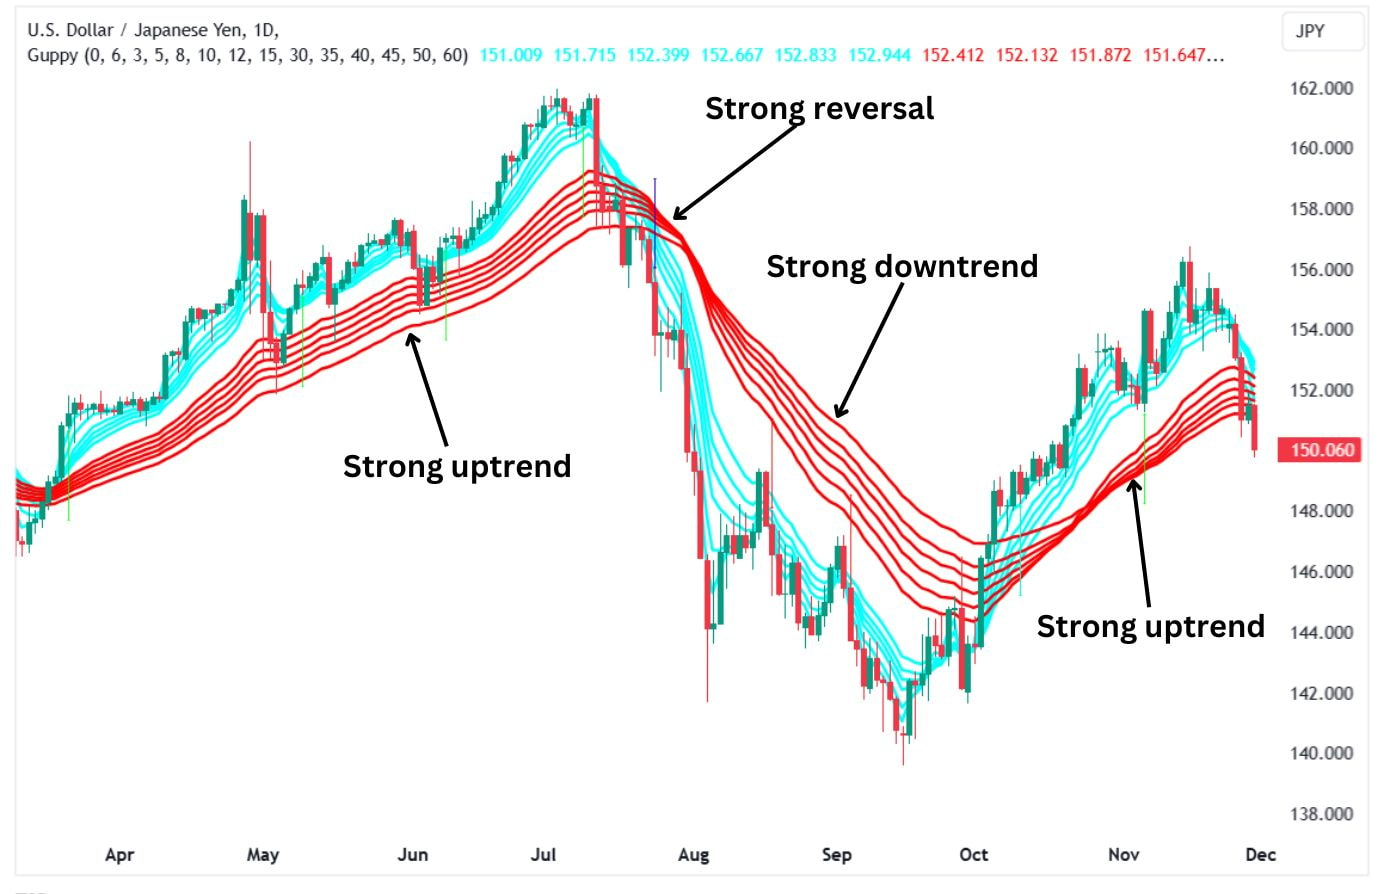
The Guppy Multiple Moving Average (GMMA) works in a unique manner. Whenever the shorter EMAs are above the longer EMAs and the two groups are separated by a significant gap, it usually signals the presence of a robust uptrend. Conversely, when the shorter EMAs are below the longer EMAs and there is a gap between the two groups, it usually signals a robust downtrend.
Scenarios where the two groups of EMAs are close together usually signal that the current trend is losing momentum and a potential reversal could occur.
SMA Forecasting
SMA forecasting refers to a unique method of predicting future price movements based on the SMA indicator. This is a unique way of using the SMA, a lagging indicator, to determine future price trends. For example, if the price crosses below the SMA, it suggests price is less than ‘average’ indicating a downtrend. On the other hand, if the prices crosses above the SMA, the price is trading higher than average indicating an uptrend.
Traders can also identify dynamic support and resistance levels based on the simple moving average (SMA) line.
The techniques used in SMA forecasting include trend extrapolation, where analysts assume that the trend will likely continue if the price is consistently above or below an SMA.
Another technique is crossovers, where traders and analysts watch out for bullish and bearish crossovers to predict future price trends. Lastly, analysts tend to look at historical price data to pinpoint recurring patterns that they can use to predict future price movements.
You can use SMA forecasting in multiple trading strategies, such as swing trading, where you identify trend reversals and continuation to take trades that last from a few days to weeks. You can also use the SMA forecasting techniques for trend-following strategies where you seek to benefit from sustained price trends. You can also use SMA forecasting as part of your risk management strategy.
Advantages of Trading Using the Simple Moving Average
Here are four advantages of trading with the simple moving average (SMA).
1. Effortless trend spotting
The SMA simplifies price movements, providing a clear view of the overall trend. Whether prices are rising, falling, or consolidating, the SMA eliminates the noise, helping traders see the market’s true direction without overcomplicating things.
2. Customizable to your strategy
One of the SMA’s greatest strengths is its flexibility. You can adjust the timeframe to suit your trading style—shorter periods for fast-paced intraday trades or longer periods for catching broader trends. This adaptability ensures it works seamlessly across various market approaches.
3. Reliable support and resistance levels
Traders often notice that SMAs act as dynamic support or resistance levels. Prices may “bounce” off the SMA during trends, providing a practical reference point for planning trade entries, exits, and stop-loss placements.
4. Ease of use for all experience levels
The SMA’s simplicity makes it perfect for both beginners and seasoned traders. It requires no complex calculations or technical know-how, allowing anyone to incorporate it into their trading toolkit and focus on making informed decisions.
Disadvantages of Trading Using the Simple Moving Average
Here are four disadvantages of trading using the simple moving average (SMA).
1. Lagging indicator
The SMA relies entirely on past price data, making it slow to react to sudden market changes. This delay can result in missed opportunities during rapid trend reversals, limiting its effectiveness in volatile conditions.
2. Ineffective in sideways markets
When the market lacks a clear trend, the SMA often generates conflicting signals. This makes it challenging for traders to differentiate between genuine opportunities and false moves, leading to potential losses.
3. Equal weighting of data
The SMA gives the same importance to older and more recent price data points. This can dilute the relevance of current market conditions, making the indicator less sensitive to the latest price shifts.
4. Limited predictive power
The SMA reflects historical price trends but does not anticipate future price movements. This means traders must pair it with other indicators or analysis techniques for more accurate predictions.
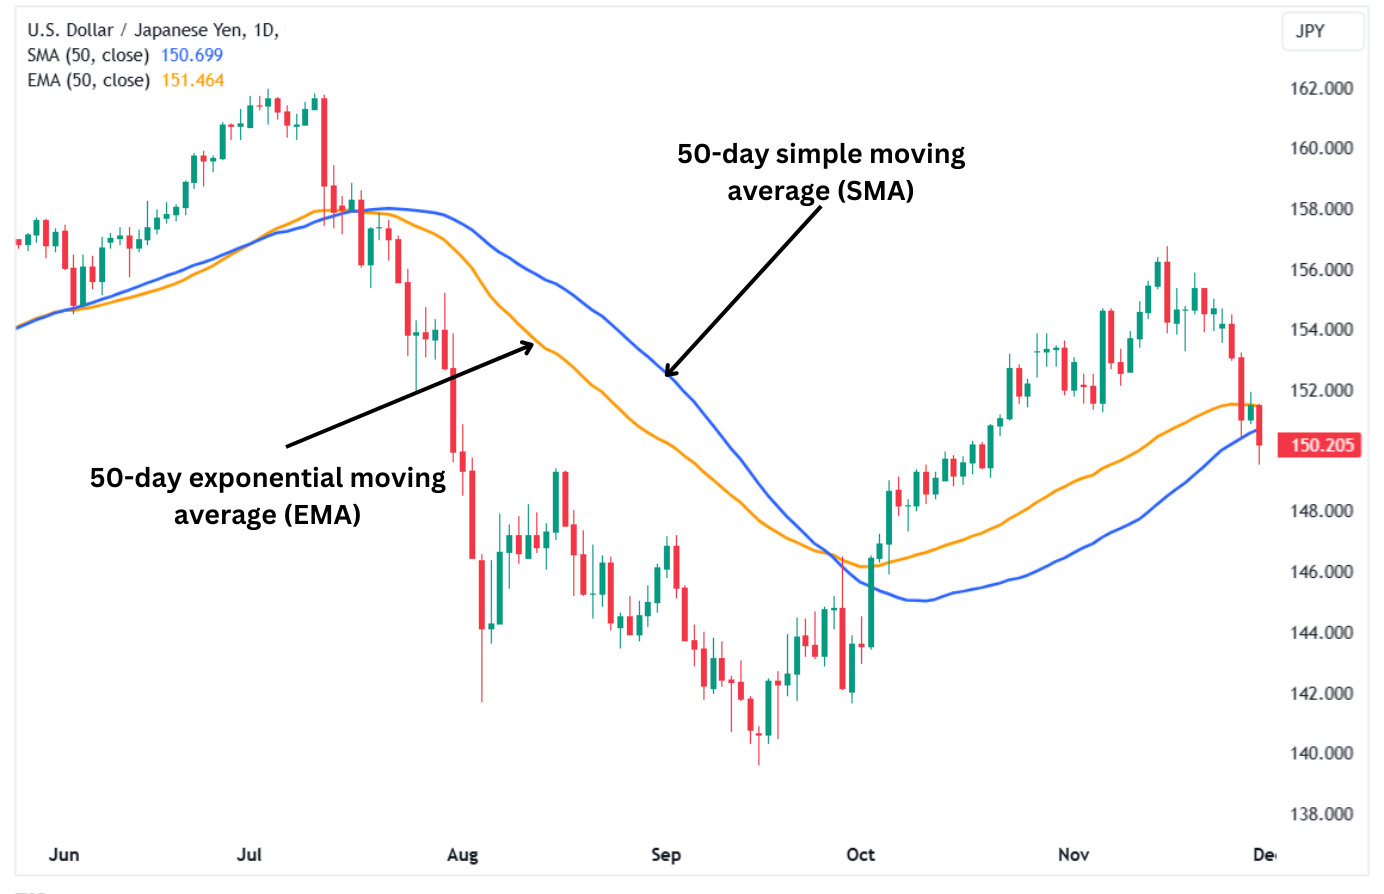
Simple Moving Average vs. Exponential Moving Average
The SMA and EMA are both popular tools for smoothing price data and identifying trends, but they achieve this in slightly different ways. While the SMA offers a straightforward average of prices, the EMA emphasizes the most recent data points, making it more responsive to price changes.
Key differences between the SMA and EMA
Weighting of price data
The SMA gives equal weight to all data points in the calculation period, providing a steady average. The EMA, on the other hand, assigns greater importance to recent prices, making it more sensitive to current market movements.
Responsiveness to market changes
Due to its design, the exponential moving average (EMA) provides more timely insights compared to the simple moving average (SMA) by reacting more quickly to sudden price shifts. This can be advantageous in volatile markets but may also lead to more false signals. The SMA is slower to react, offering a smoother and less volatile trend line.
Calculation complexity
The SMA is simple and easy to calculate, making it beginner-friendly. The EMA involves a more complex formula with a weighting multiplier, which requires traders to rely on charting tools for accuracy.
Similarities between the SMA and EMA
Trend Identification
Both indicators excel at revealing the market’s overall direction, helping traders align their strategies with prevailing trends.
Versatility Across Markets
Both indicators are adaptable and can be applied to a wide range of markets, from forex to stocks and commodities, making them essential tools in technical analysis.
Uses of the SMA and EMA
- SMA: Best suited for identifying long-term trends due to its stable nature. It is often used by traders who want a clearer picture of the market without reacting to every price fluctuation.
- EMA: Ideal for short-term strategies where responsiveness is critical. Day traders and scalpers often prefer it to capitalise on quick market movements.
Choosing Between the SMA and EMA
The decision to use the SMA or EMA depends on your trading style. For a conservative approach, the SMA’s steady signals are reliable. If agility and quick reactions are your focus, the EMA’s sensitivity can give you an edge. Many traders use both in combination to balance stability and responsiveness.
Simple Moving Average vs. Weighted Moving Average
The SMA and Weighted Moving Average (WMA) are tools designed to make price trends easier to follow. The SMA works by taking the total of prices over a specific number of time periods frame and dividing it evenly. Every price is treated equally, regardless of when it occurred, making this method steady but sometimes a bit slow to react to sudden changes. It functions akin to a detached observer, concentrating on the broader picture instead of analysing each individual occurrence.
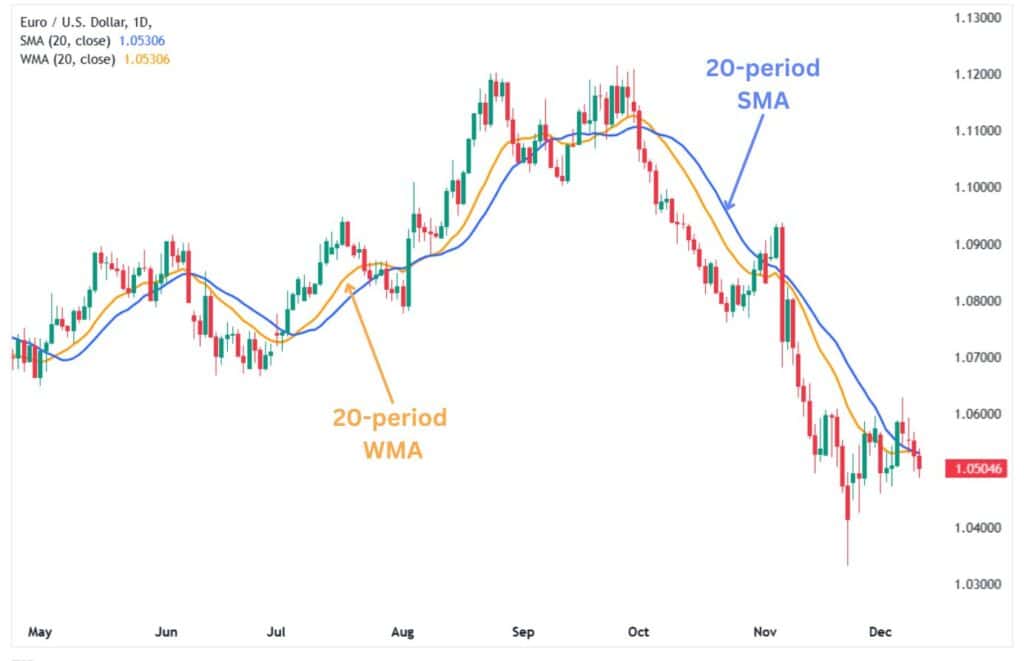
In contrast, the weighted average (WMA), puts the spotlight on recent prices, assigning them more importance while gradually reducing the influence of older data. This method detects shifts more quickly, which can be advantageous for identifying momentum, but it may also react to noise in a volatile market. Despite their differences, both approaches aim to give traders a clearer view of the market’s rhythm. The choice often depends on whether you value a steady perspective or the ability to adapt to rapid price movements.
Simple Moving Average vs. Smoothed Moving Average
The SMA and Smoothed Moving Average (SMMA) serve similar purposes but take distinct paths to get there. The SMA averages prices over a set number of periods, treating every price equally, like giving all participants in a race the same recognition. This straightforward approach is simple to understand and widely used, but it only considers the specified time frame, which can make it sensitive to sudden market fluctuations.
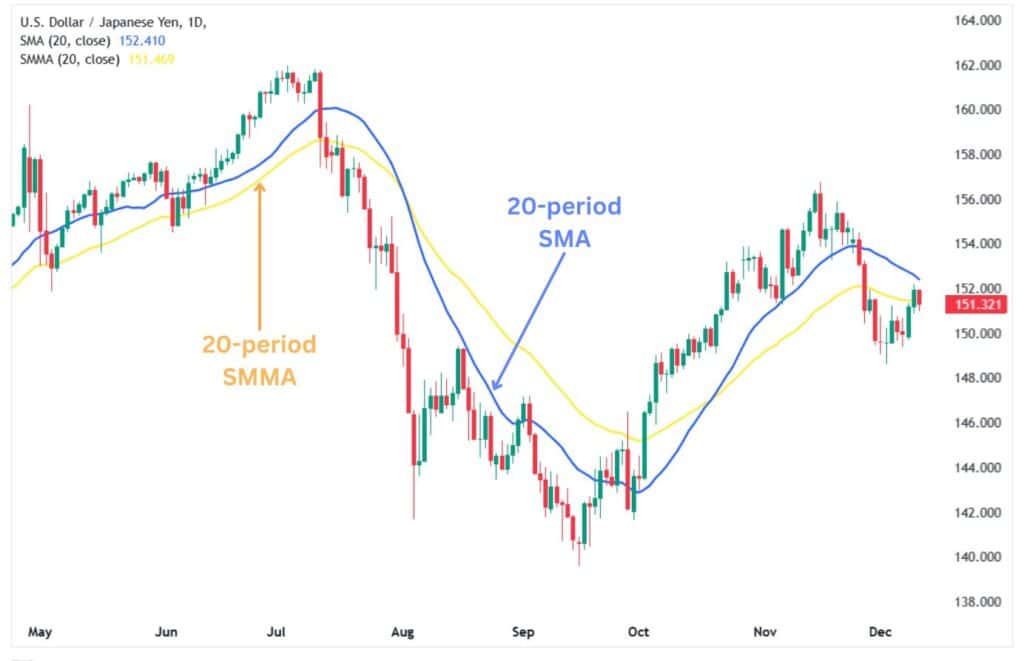
In contrast, the SMMA is more like a rolling tide, blending past and present prices into a seamless flow. It doesn’t discard older data abruptly but tapers its influence over time, creating a line that’s less jittery and more reflective of overarching trends. While the SMA provides a sharp focus on recent activity, the SMMA offers a broader and steadier view, making it ideal for those who prefer to avoid reacting to every minor market ripple. Both have their place, depending on whether a trader values quick insights or a smoother narrative.
Differences Between Shorter vs. Longer SMAs
Shorter Simple Moving Averages (SMAs) and longer SMAs both help traders identify trends, but they serve different purposes. A shorter SMA, such as a 10-day average, reacts quickly to price changes. It’s like a sprinter, capturing short-term market movements and helping traders spot momentum shifts. However, this quick reaction can also mean more noise—shorter SMAs are more likely to signal false trends in choppy markets.
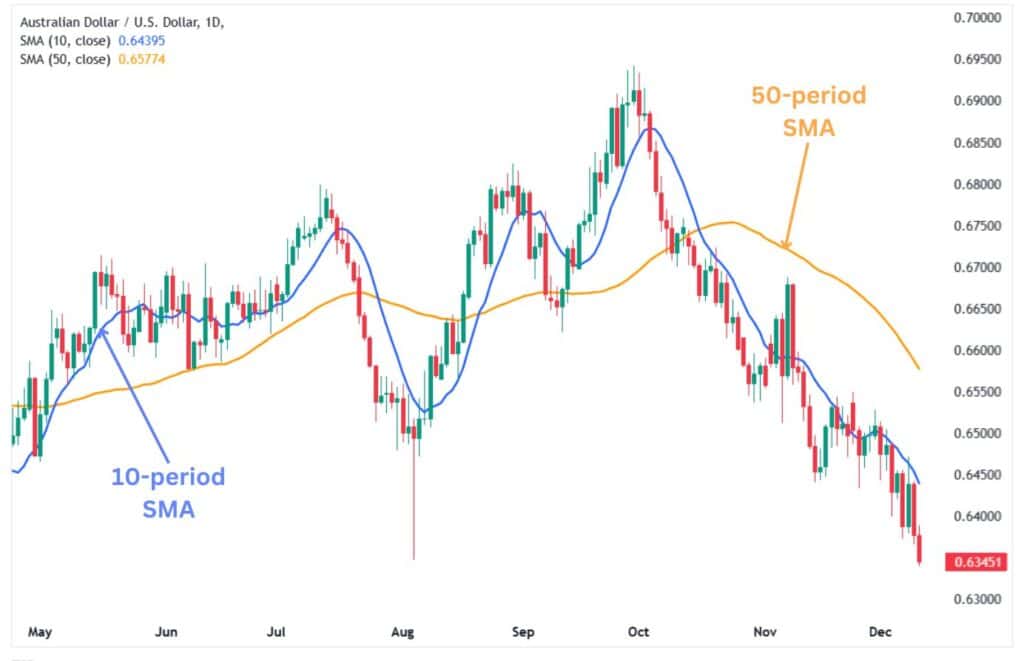
On the other hand, longer SMAs, like a 50-day or 200-day average, move at a steadier pace. They’re like a marathon runner, focusing on the overall direction and filtering out minor fluctuations. This makes them ideal for understanding the big picture, but they may lag when the market shifts suddenly. Choosing between the two depends on your goals: if you’re tracking immediate changes, shorter SMAs are your ally; if you aim to understand the broader trend, longer SMAs provide better guidance.
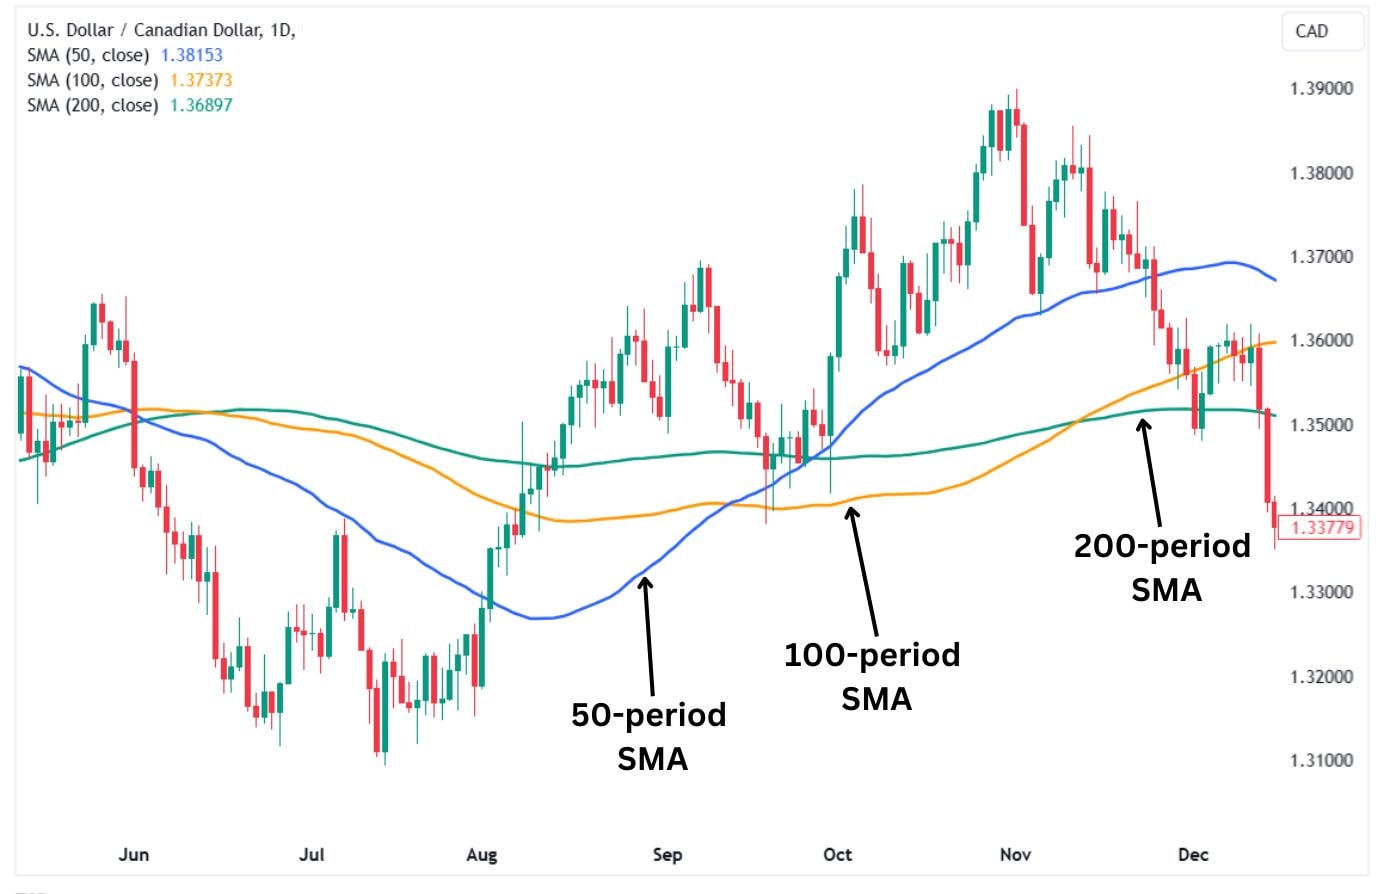
50-Day vs. 100-Day vs. 200-Day Simple Moving Average
The 50-day, 100-day, and 200-day SMAs are popular moving averages traders use to analyse price trends over different timeframes. Each serves a unique purpose, and selecting the right one depends on your trading strategy and goals. Here’s a breakdown in a table and a detailed explanation:
| Aspect | 50-day SMA | 100-day SMA | 200-day SMA |
| Timeframe focus | short- to medium-term trends | medium-term trends | long-term trends |
| Sensitivity | Highly responsive to price changes | Moderately responsive | Least responsive, very smooth |
| Use case | For active traders or short-term investors looking to capture quick market movements. | For swing traders wanting to assess medium-term trends and price stability. | For long-term investors, focusing on overall market direction and major shifts. |
| Market noise | Higher sensitivity makes it prone to more false signals. | Balances responsiveness and stability. | Reduces noise but may miss smaller trend changes. |
| Signal strength | Stronger in detecting early trend reversals. | Good for confirming trend strength. | Best for confirming long-term trends and key support or resistance levels. |
Which One Should You Choose?
50-Day SMA
If you’re an active trader or prefer short-term strategies, the 50-day SMA might be your go-to. It reacts quickly to price changes, helping you spot short-term opportunities or reversals. However, its sensitivity means it might generate more false signals in choppy markets.
100-Day SMA
This is a middle ground, perfect for swing traders who want to track medium-term trends without being overly influenced by daily price swings. It balances stability and responsiveness, making it versatile for most trading styles.
200-Day SMA
For long-term investors, the 200-day SMA is a reliable compass. It smooths out daily fluctuations and focuses on the big picture, ideal for identifying major trends and setting long-term strategies. While slower to react, it’s less likely to mislead you with false signals.
Combining SMAs
Many traders use these SMAs together to gain deeper insights. For example:
- When the 50-day SMA crosses above the 200-day SMA, it signals a golden cross (bullish trend).
- When the 50-day SMA crosses below the 200-day SMA, it signals a death cross (bearish trend).
This layered approach helps confirm trends and minimises the risk of relying on a single indicator. Whether you’re an intraday trader or a long-term investor, understanding the strengths of each SMA can significantly enhance your market analysis.
What Indicator Is Best To Trade With The Simple Moving Average?
The best indicator to pair with the simple moving average (SMA) depends on your trading goals. Still, some of the most effective ones include pairing the SMA with Bollinger bands, the MACD, the RSI, the Williams %R, and the McClellan oscillator. We will delve deeper into each of these indicators in the following sections.
Simple Moving Average with Bollinger Bands
Combining the simple moving average (SMA) with Bollinger Bands® can help you identify trends, spot reversals, and pinpoint trading opportunities. Bollinger Bands are built around an SMA and use standard deviations to create upper and lower bands reflecting market volatility.
To make the two indicators work harmoniously, you should understand that the SMA in Bollinger bands is the centre line and is typically the 20-period SMA. The upper and lower bands expand and contract based on market volatility. Together, they form a “channel” that shows price movement, trend direction, and potential turning points.
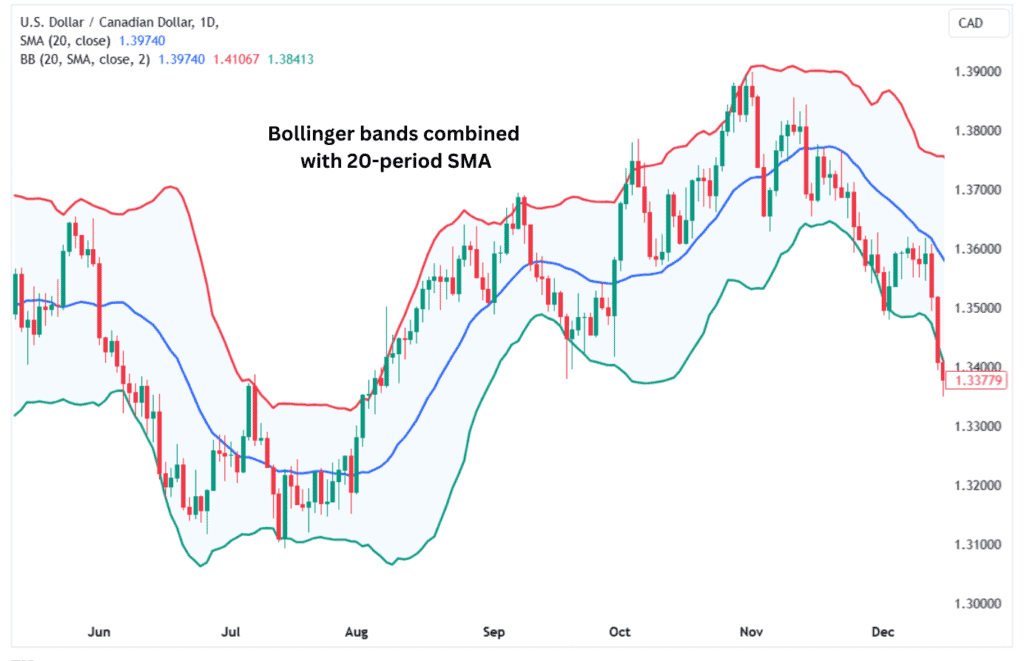
The SMA can help you determine if the price is in an uptrend, downtrend, or trading sideways. The price will continuously stay above the SMA in an uptrend, often touching or riding the upper band. The price will stay below the SMA in a downtrend, moving closer to the lower band. Prices tend to hover around the SMA and move within the bands without a clear direction in a sideways market.
If the price touches or breaks the lower band and then starts moving back toward the SMA, it could indicate a reversal to the upside, generating a buy signal. If the price touches or breaches the upper band and then starts moving back toward the SMA, it could signal a potential drop, generating a sell signal.
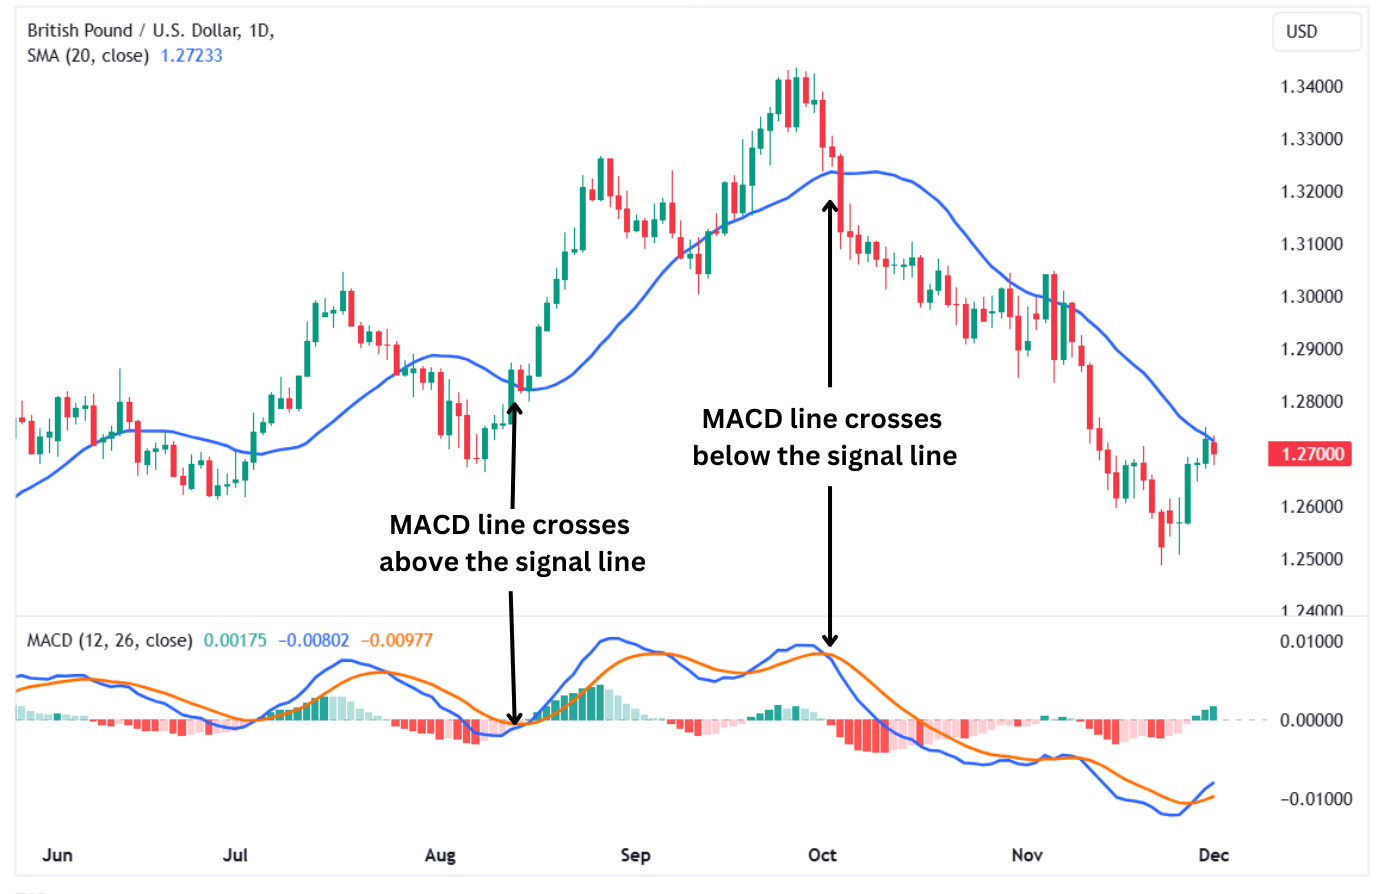
Simple Moving Average with MACD
Pairing the Simple Moving Average (SMA) with the Moving Average Convergence Divergence (MACD) is a smart way to combine trend-following with momentum analysis. Together, the two indicators help traders confirm trends and spot reversals and time their trades more effectively.
The MACD is composed of three components: the MACD line, which plots the difference between two EMAs, typically the 12-period and 26-period. The signal line is a 9-period EMA of the MACD line, while the histogram shows the difference between the MACD line and the signal line.
You can identify the trend using the Simple Moving Average (SMA). If the price is above the SMA, buyers are in charge; if below, sellers are. You can also confirm the momentum behind the uptrend if the price is above the SMA and the MACD Line crosses above the Signal Line; it’s a potential entry point. You can confirm the bearish momentum if the price is below the SMA and the MACD Line crosses below the Signal Line.
It would be best to watch out for bearish divergences where the price could be making higher highs, but the MACD is making lower lows, indicating that the uptrend could be weakening. For bullish divergences, the price is usually making lower lows. Still, the MACD is making higher highs, signalling that the bearish momentum could end and an upward reversal could come.
You could also time your exits using the MACD and SMA. If you’re in a long trade (buy position) and the MACD Line crosses below the Signal Line while the price dips toward the SMA, it might be time to exit. For a short trade, watch for the opposite: MACD Line crossing above the Signal Line as the price nears the SMA.
Simple Moving Average with McClellan Oscillator
The McClellan Oscillator plays a vital role in assessing market breadth, which measures the strength of advancing versus declining stocks. While the Simple Moving Average (SMA) focuses on price trends, the McClellan Oscillator goes deeper, showing whether the broader market supports those trends. Positive oscillator values indicate bullish momentum, with advancing stocks outpacing decliners, while negative values suggest bearish conditions.
In conjunction with the SMA, the McClellan Oscillator helps confirm the strength of a trend. For example, if the price is above the SMA (uptrend) and the oscillator is positive, it signals strong buying momentum across the market. Conversely, if the price is below the SMA (downtrend) and the oscillator is negative, it confirms that sellers are in control.
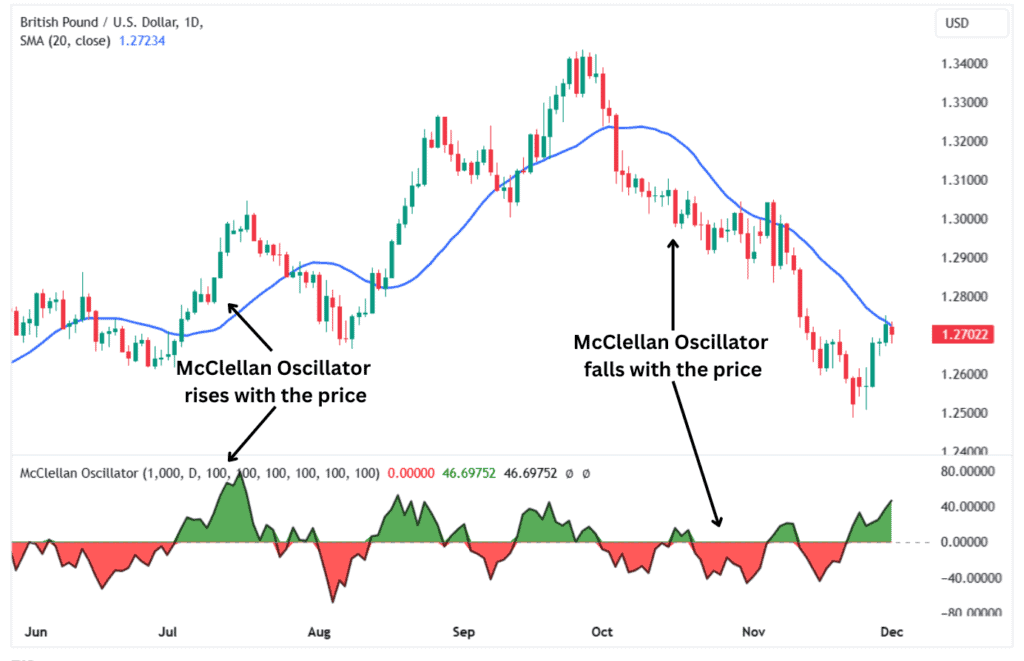
The oscillator is also useful for spotting divergences that can warn of trend changes. A bullish divergence occurs when the price is below the SMA, but the oscillator starts rising, signalling potential upward momentum. Similarly, a bearish divergence happens when the price is above the SMA, but the oscillator falls, hinting at a weakening uptrend. These insights help traders refine their entries and exits.
Simple Moving Average with Williams % R
The Simple Moving Average (SMA) works well with the Williams %R, which is a momentum indicator that determines how close the current price is to the high recorded in a specified period, such as 14 days. The Williams %R oscillates on a scale from 0 to -100; readings above -20 indicate that the price is near its recent highs, while readings below -80 indicate the price is near its recent lows.
The two indicators work together to confirm trend as the SMA identifies whether the price is in an uptrend, downtrend, or sideways trend. The Williams %R confirms if the price is overbought or oversold within the current trend. The two indicators work best in trending markets as opposed to range-bound markets. The Williams %R is a fast indicator that moves around a lot; hence, the much slower SMA indicator also acts as a filter for the signals generated by the Williams %R.
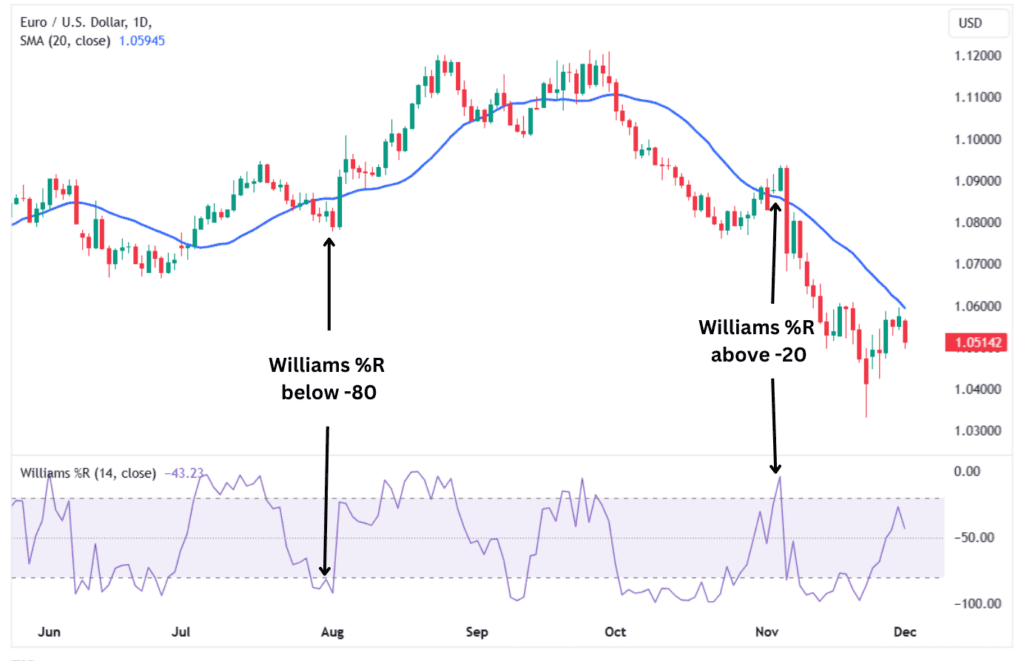
You can find trade entry points using the two indicators. If the price is in an uptrend (above the SMA) and the Williams %R dips to -80, this could present an excellent bullish trade entry point as it could indicate that the price is about to rebound. Conversely, if the price is in a downtrend (under the SMA) and the Williams %R indicator surges to -20, it signals that the price may be about to reverse lower, presenting a solid bearish trade entry location.
Simple Moving Average with RSI
The Simple Moving Average (SMA) and the relative strength index (RSI) work well together since they are complementary. As a momentum oscillator, the RSI measures how quickly prices rise or fall. Plotted on a scale from 0 to 100, RSI readings above 70 indicate overbought conditions, while readings below 30 signal oversold conditions.
The two indicators work seamlessly together as the SMA tracks the overall trend direction, while the RSI tells you whether a trend will likely keep going or if it could reverse course. You can use the two indicators to identify potential trade entry points. For example, if the RSI dips into oversold territory during an uptrend, it signals that the price may be about to bounce higher, which is a bullish trade entry signal.
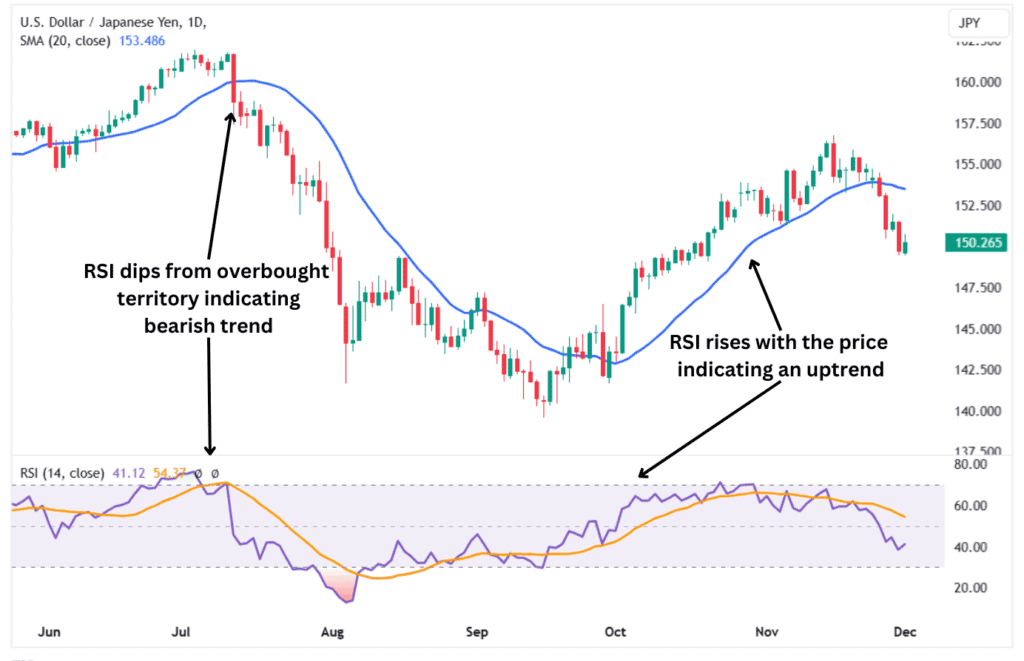
Conversely, if the RSI surges to 70 and above during a downtrend (price below the SMA), it could signal a bearish trade entry as the price reverses from the overbought region. Traders could use this opportunity to enter bearish trades. The SMA consistently serves as a reliable trend filter, assisting you in avoiding erroneous signals produced by the RSI.
FAQ
What is the best time frame to use for the simple moving average?
The best time frame depends on your trading style and goals. Day traders might prefer shorter SMAs like 10 or 20 periods to catch quick trends, while swing or long-term traders lean on 50 or 200 periods for a broader perspective. Experimenting with time frames helps tailor the SMA to your strategy.
What is the psychology behind the simple moving average?
The SMA reflects collective market behaviour by smoothing out price swings, giving traders a “crowd consensus.” It shows the average sentiment over a period, highlighting where buyers or sellers dominate. This aids traders in making decisions free from the influence of short-term fluctuations.
How reliable is the simple moving average?
The SMA is reliable for spotting overall trends but isn’t excellent for predicting sudden price moves. Its strength lies in showing the bigger picture, but it can lag in fast-moving markets. Using it with other tools or indicators boosts its effectiveness.
Is simple moving average leading or lagging?
The SMA is a lagging indicator because it relies on past prices, which means it follows market movements rather than predicting them. It’s best for confirming trends and smoothing out price data. While it can’t forecast, it’s excellent for keeping you aligned with the overall trend.