What Are Support and Resistance?
Support and resistance are fundamental pillars in technical analysis that help traders identify price levels where assets may reverse or consolidate. Technical analysts use these levels to predict market behaviour by analysing historical price movements, market psychology, and patterns of supply and demand.
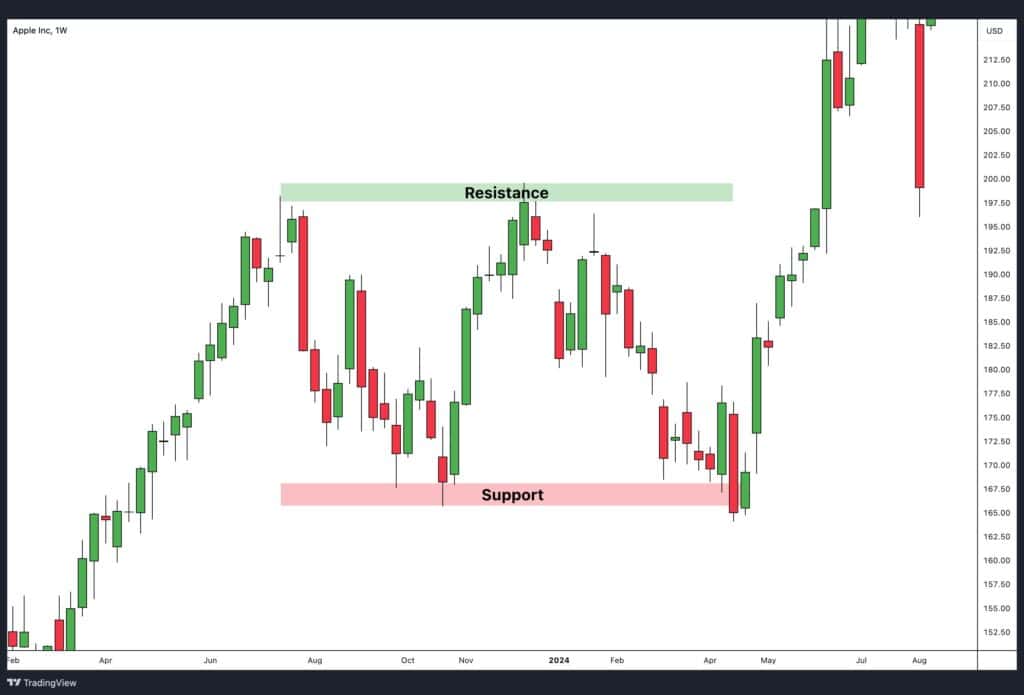
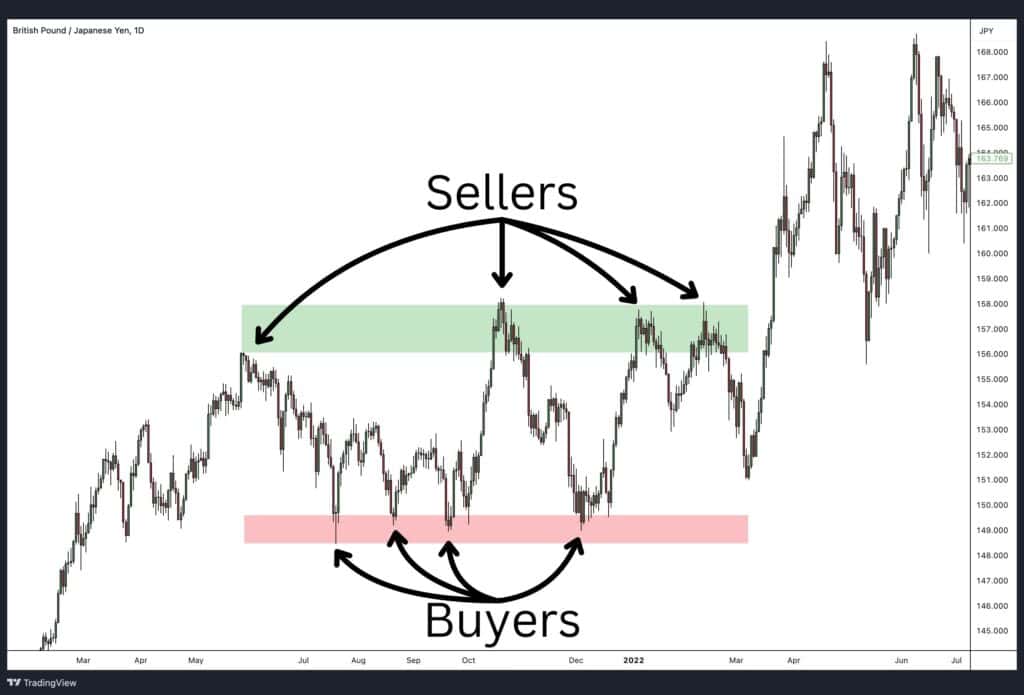
Support refers to a price level where buying interest is strong enough to prevent further decline, while resistance indicates a price level where selling pressure can halt a price increase. Together, they form the backbone of many trading strategies, guiding decisions on entry, exit, and risk management.
What Is Support?
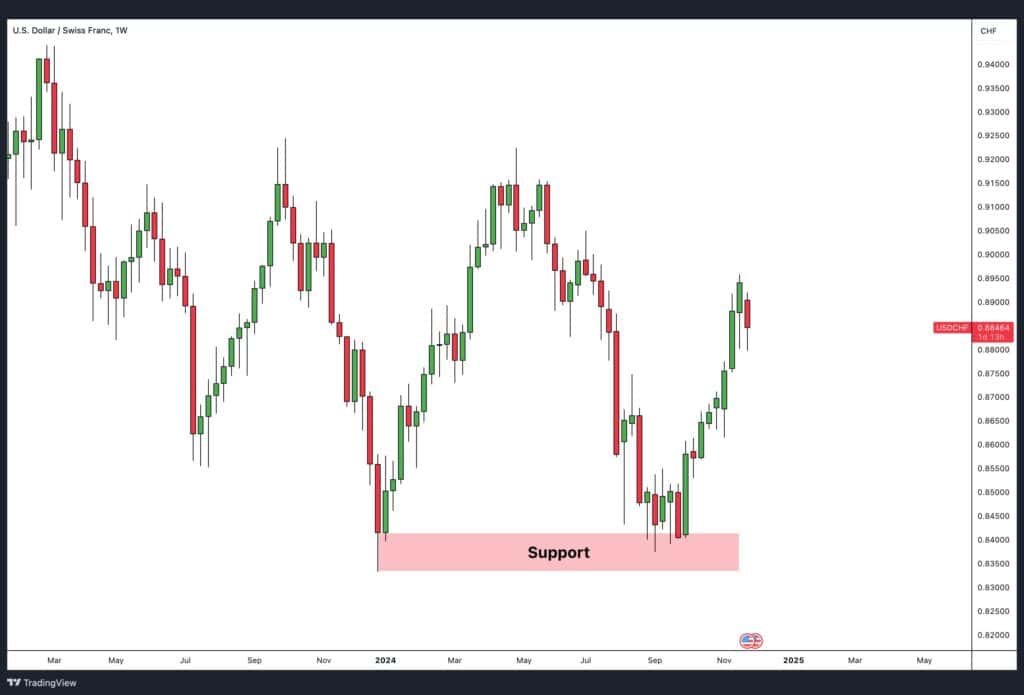
Support is a price level at which an asset tends to stop falling and may reverse upward due to increased buying interest. Support occurs when a downtrend is anticipated to pause due to increased demand. It acts like a “floor” for the price, where demand outweighs supply. Traders often identify support levels by observing historical price action, where the market consistently reacts to a certain level with upward momentum.
How Support Forms
Support is formed when:
- Market participants perceive value: At a certain price level, buyers find the asset undervalued and begin purchasing.
- Previous price history: Historical lows often act as benchmarks for future price reactions.
- Psychological factors: Round numbers, such as 1.000 or 100.00, often serve as strong support due to their significance in human psychology.
Key Characteristics of Support Levels
- Stability: The more times a price tests a support level without breaking it, the stronger the support becomes.
- Timeframes: Support is more significant in higher timeframes like daily or weekly charts compared to intraday charts.
What Is Resistance?
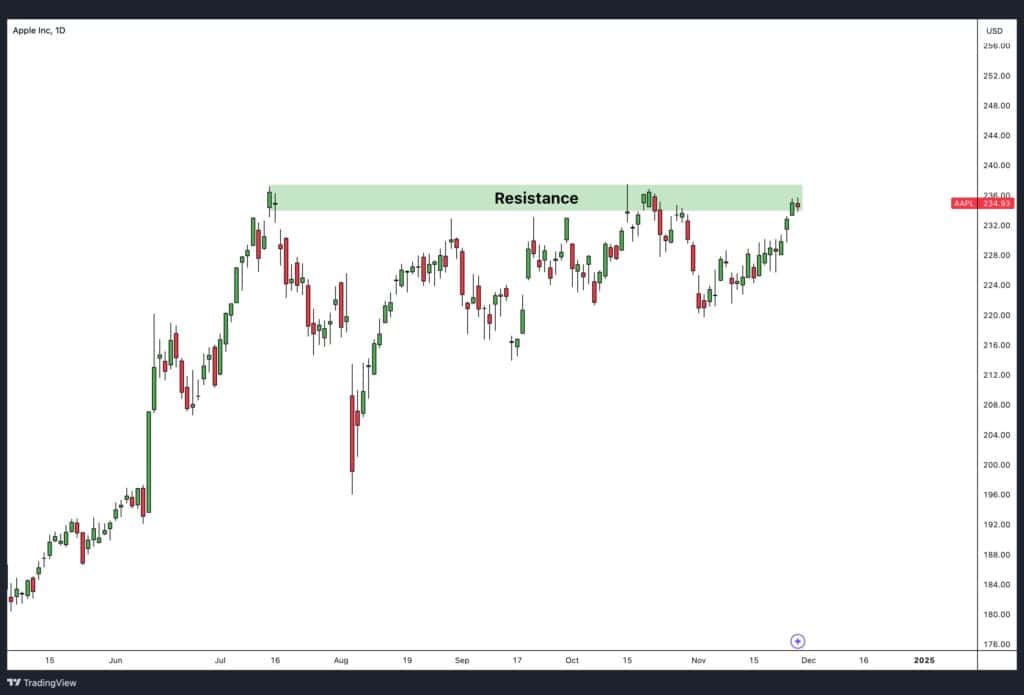
Resistance is the opposite of support—it represents a price level at which an asset faces selling pressure, preventing it from rising further. Resistance occurs when an uptrend is anticipated to pause due to increased supply. It acts like a “ceiling” for the price, where supply outpaces demand.
How Resistance Forms
Resistance develops when:
- Market participants find the price overvalued: Sellers are enticed to offload their holdings, curbing upward momentum.
- Historical highs: Past peaks often become resistance levels as traders view them as barriers to further gains.
- Psychological factors: Like support, round numbers can also act as resistance due to their psychological impact.
Key Characteristics of Resistance Levels
- Strength: Repeated failures to break through a resistance level solidify its importance.
- Timeframe Relevance: Resistance on longer timeframes is more reliable for predicting significant price reversals.
Understanding support and resistance is a cornerstone of successful trading, enabling traders to anticipate market movements and execute informed strategies with precision. These levels, derived from a blend of technical factors and human psychology, serve as critical decision points in financial markets.
Why Do Support and Resistance Form?
Support and resistance levels form due to the fundamental principles of supply and demand, deeply rooted in both market behaviour and economic theory. These levels represent key areas where buying and selling pressures interact, influencing the direction of price movements. When the balance between supply and demand shifts, it creates noticeable patterns in price action that traders use to predict future movements.
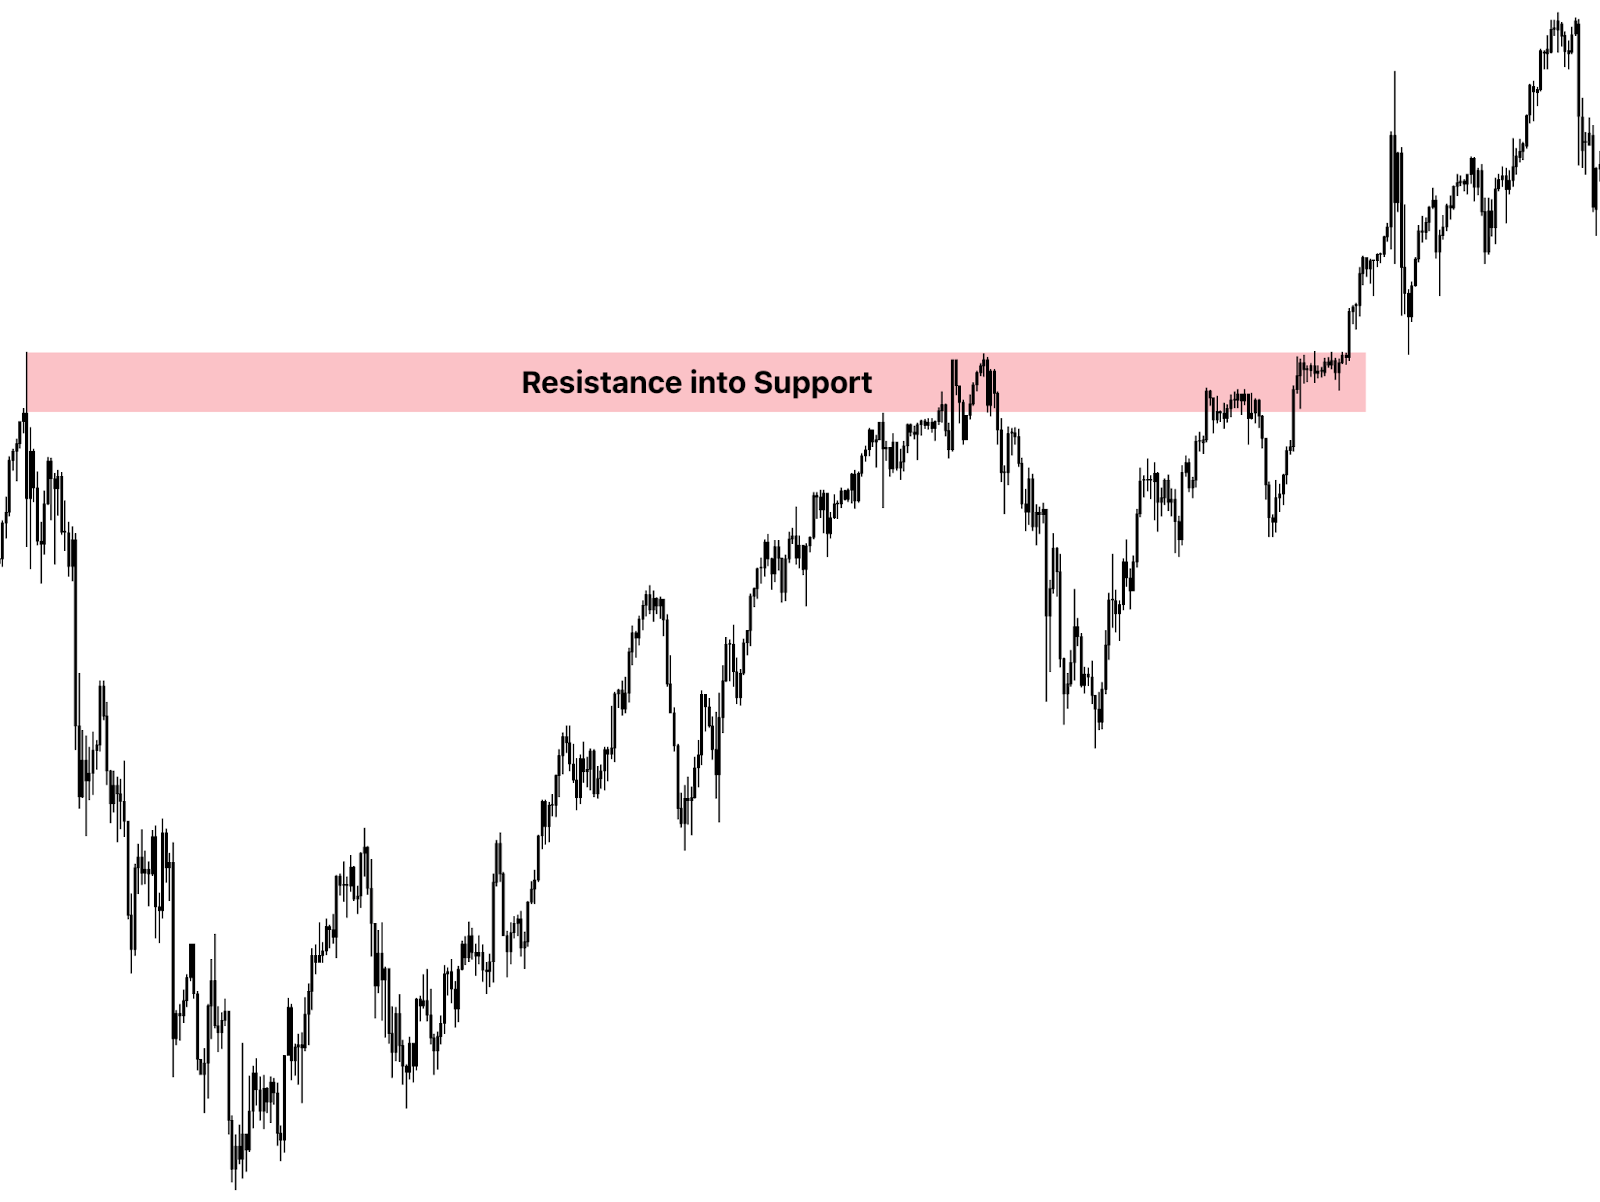
When the price falls below a previously established support level, it often becomes resistance.
The Role of Supply and Demand in Support and Resistance
- Support: The Zone of High Demand
Support forms at price levels where demand outweighs supply. When prices fall to a certain point, buyers perceive the asset as undervalued and step in to purchase, increasing demand. This influx of buying interest creates a “floor,” preventing the price from declining further. Economically, this reflects the principle that lower prices attract more demand, stabilising the market at these levels.
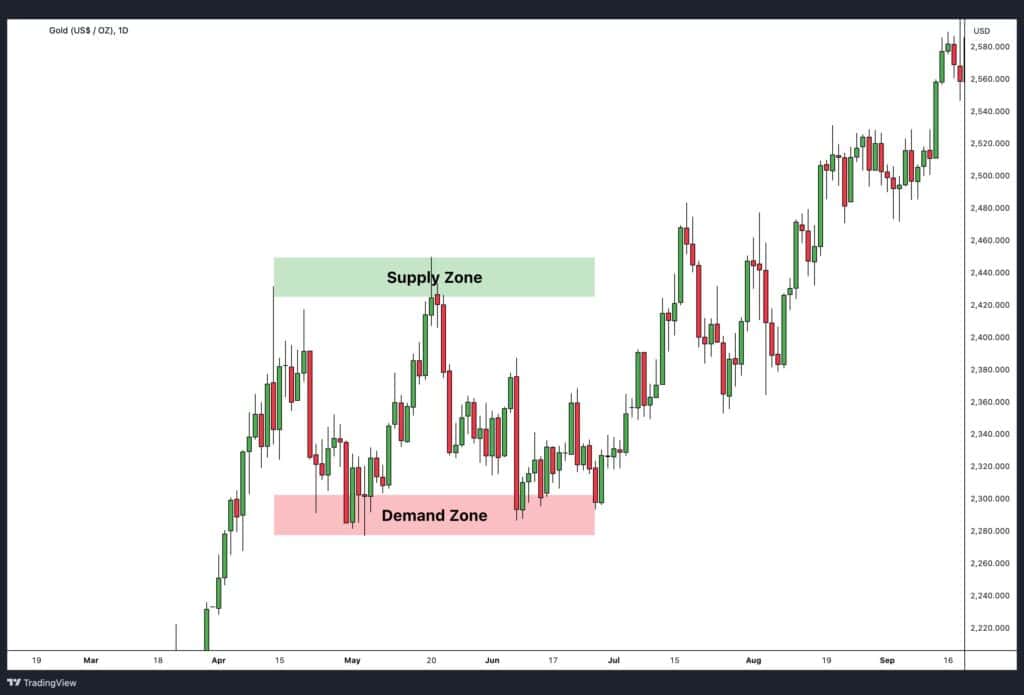
- Example: The gold chart above highlights a demand zone (marked in pink), showcasing a price level where buyers stepped in repeatedly to prevent further declines. This area acts as support because it represents a region of high demand—buyers perceive the asset as undervalued at this level. Each time the price reaches this zone, it bounces back upward due to increased buying pressure, stabilising the market.
- Example: The gold chart above highlights a demand zone (marked in pink), showcasing a price level where buyers stepped in repeatedly to prevent further declines. This area acts as support because it represents a region of high demand—buyers perceive the asset as undervalued at this level. Each time the price reaches this zone, it bounces back upward due to increased buying pressure, stabilising the market.
- Resistance: The Zone of High Supply
Resistance forms at price levels where supply surpasses demand. As prices rise, sellers view the asset as overvalued and begin offloading their holdings, increasing supply. This creates a “ceiling” that restricts further upward movement. Economically, this aligns with the law of supply, where higher prices incentivise more selling activity.
- Example: In contrast, the supply zone (highlighted in green) on the chart demonstrates a price level where selling pressure consistently outweighs buying interest. Each time the price approaches this area, it reverses downward because sellers perceive the price as overvalued and offload their holdings, increasing supply.
Market Psychology and the Formation of Levels
Support and resistance also stem from psychological factors. Traders and investors often rely on past price behaviour to make decisions, creating self-fulfilling patterns:
- Memory of Key Levels: Traders remember significant highs and lows, treating them as reference points for future buying or selling decisions.
- Herd Behaviour: When a large number of market participants react to these levels, it reinforces their significance.
For example, if a stock bounces off $50 multiple times, traders watching the same chart are likely to anticipate a reversal at this level in the future.
The Economic Connection
The formation of support and resistance mirrors broader economic dynamics:
- Price Elasticity: Like products in the market, assets have “price points” where demand or supply reacts strongly. Support reflects a highly elastic demand at lower prices, while resistance reflects elastic supply at higher prices.
- Market Equilibrium: Support and resistance levels mark temporary zones of equilibrium, where the forces of supply and demand balance before tipping toward a new trend.
Practical Implications for Traders
Understanding why support and resistance form provides traders with a powerful tool for predicting price behaviour. These levels are not random; they reflect the interplay of economic forces and trader psychology. Recognising this allows traders to make informed decisions on entry, exit, and risk management while navigating the financial markets.
Importance of Support and Resistance
Price Reactions at Support and Resistance Levels
The significance of support and resistance lies in how prices behave when they interact with these levels:
- When Price Bounces Off These Levels
Example:
- If GBP/JPY repeatedly bounces off a support level at 150.000, it indicates strong buying interest. Traders use this as a signal to enter long trades, anticipating upward movement.
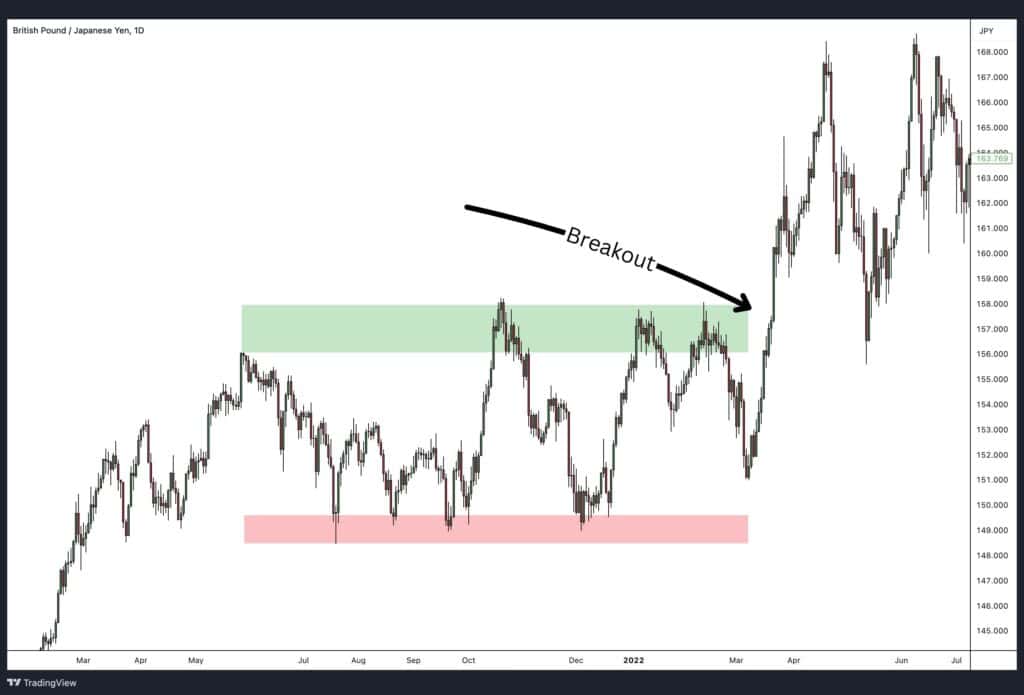
- When the Price Breaks Through These Levels
- A break below support indicates that sellers have overwhelmed buyers, and the asset’s price is likely to fall further. This typically creates a bearish outlook, with traders looking for shorting opportunities.
- A break above resistance signals that buyers have overpowered sellers, suggesting bullish momentum and potential for further price increases. Traders use these breakouts as opportunities to enter long positions.
- Breakouts often attract additional market participants, further intensifying the new trend.
Example:
- If GBP/JPY breaks through resistance at 158.000, it often triggers a flurry of buying activity, as traders anticipate a sustained bullish run.
How Can Identifying Support and Resistance Levels Help Traders?
Recognising and accurately identifying support and resistance levels equip traders with valuable insights into market dynamics, enabling them to:
- Make Informed Entry and Exit Decisions: By pinpointing these levels, traders can determine optimal points to enter or exit trades, aligning with potential price reversals or continuations.
- Set Effective Stop-Loss Orders: Understanding where support and resistance lie allows traders to place stop-loss orders just below support or above resistance levels, effectively managing risk.
- Identify Market Trends: Observing how prices interact with these levels helps traders discern whether the market is trending, ranging, or poised for a breakout, facilitating strategic planning.
- Enhance Predictive Accuracy: Incorporating support and resistance analysis with other technical indicators can improve the accuracy of predicting future price movements.
In essence, mastering the identification of support and resistance levels empowers traders to navigate the markets with greater confidence and precision, leveraging historical price behaviours to forecast future trends.
How Does the Support and Resistance Work?
Support and resistance are critical tools for understanding how markets behave, providing traders with clear levels to make strategic decisions. These levels form when market forces, such as supply and demand, interact with key psychological price points or historical data. Here’s how support and resistance work, explained through specific methods and examples:
1. Historical Support and Resistance
Historical price levels that have consistently acted as support or resistance often influence future price movements. Traders analyse these levels to anticipate where the price may reverse or consolidate.
Example: NVIDIA Corporation
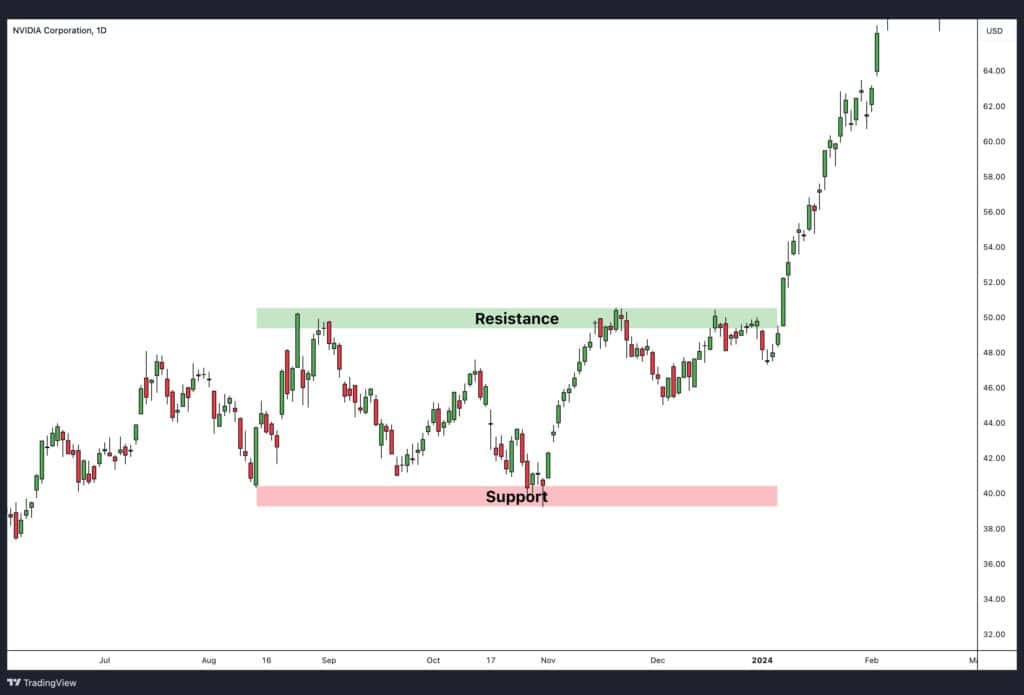
In the chart, the red zone represents historical support, where prices consistently bounced upward. The green zone marks resistance, where prices faced selling pressure and reversed downward. Eventually, the price broke through the resistance, signalling a bullish breakout and continued upward movement.
As the price rises from the support level, it indicates strong buying interest and potential for further upward movement.
- How It Works:
When the price interacts with these levels repeatedly, they become significant because market participants expect similar reactions.- A bounce off support signals strong demand.
- A rejection at resistance highlights dominant selling pressure.
2. Trendlines as Support and Resistance
Trendlines are diagonal lines drawn to connect a series of price highs or lows, creating dynamic support or resistance. These lines are particularly useful in trending markets.
Example: Advanced Micro Devices
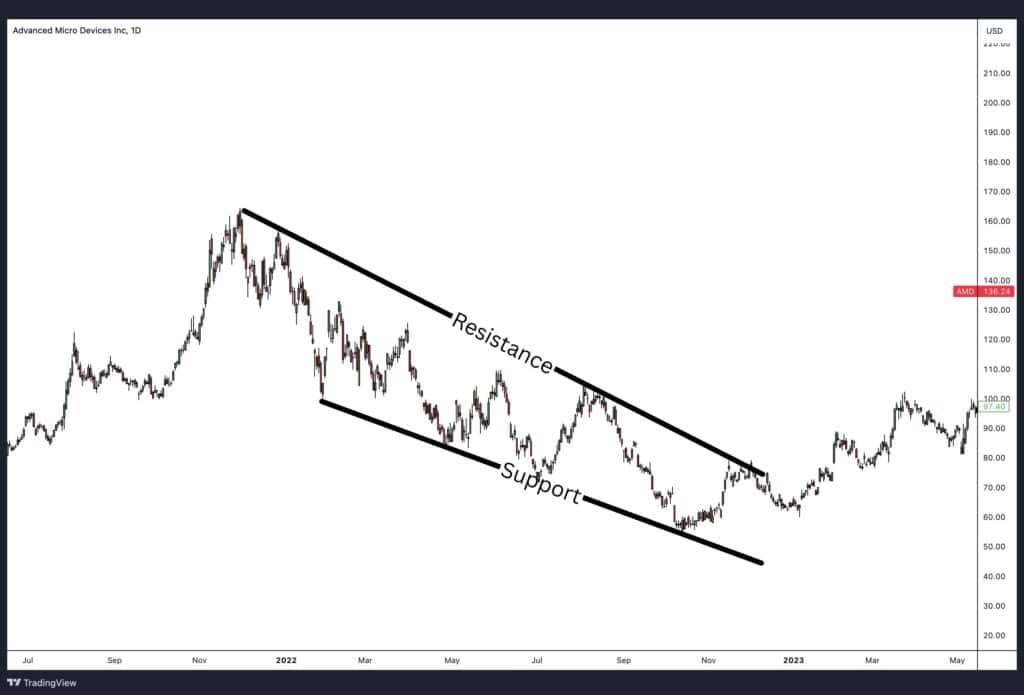
The chart showcases a downtrend where the price repeatedly respects the downward-sloping trendline as resistance. Similarly, the lower trendline acts as support, with prices bouncing upward upon touching it.
- How It Works:
Trendlines work by representing the market’s overall direction while providing levels where price corrections are likely to pause.- In a downtrend, traders watch for price to approach the resistance line to enter short positions.
- In an uptrend, traders monitor the support line for potential buying opportunities.
3. Moving Averages as Support and Resistance
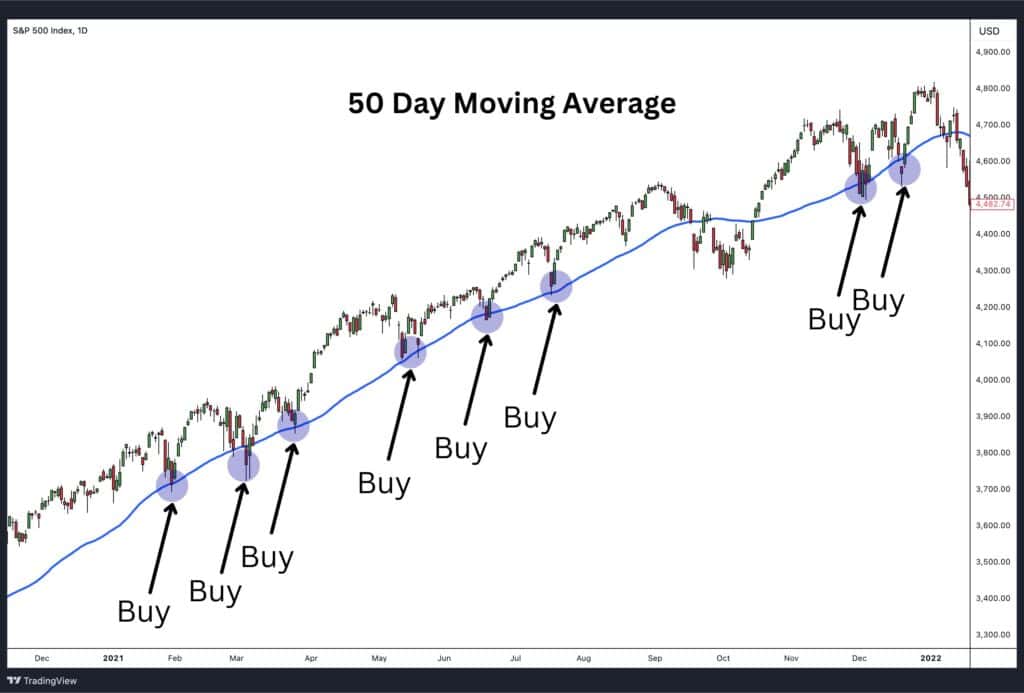
Moving averages (MAs) are dynamic tools that smooth out price fluctuations and act as support or resistance. Long-term moving averages, such as the 200-day MA, are particularly significant.
Example: Apple Inc.
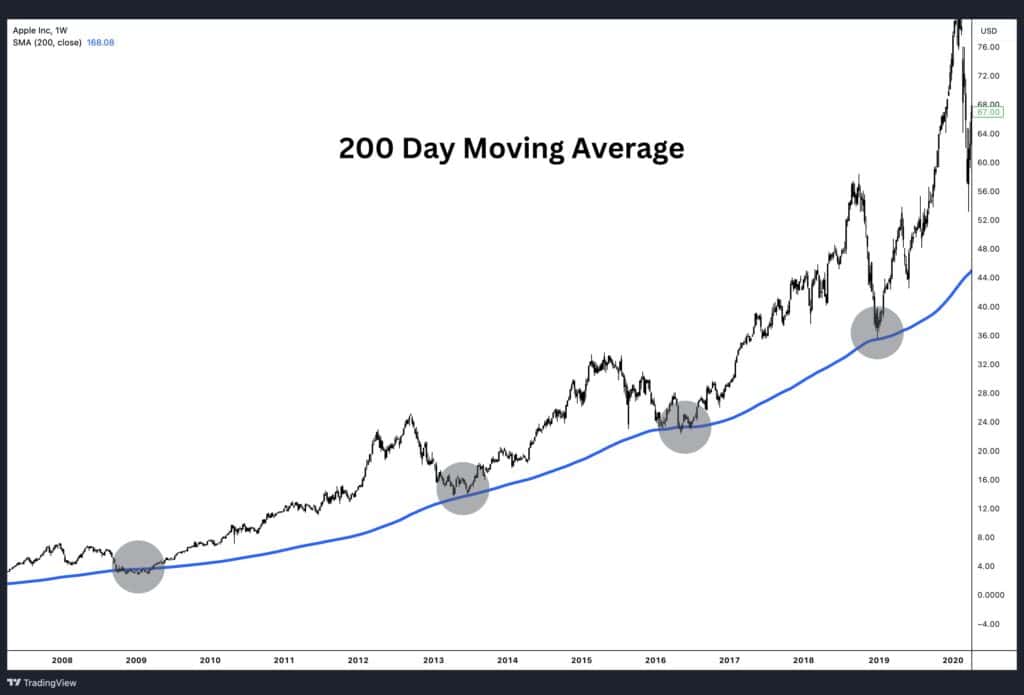
In the Apple chart, the 200-day Moving Average (blue line) acts as a strong support level over several years. The price bounces off this moving average multiple times, reaffirming its importance.
- How It Works:
- When the price is above the moving average, the moving average acts as support, and traders consider the market bullish.
- When the price is below the moving average, it acts as resistance, signalling bearish sentiment.
Moving averages are widely used because they dynamically adjust with price trends, offering flexibility across different market conditions.
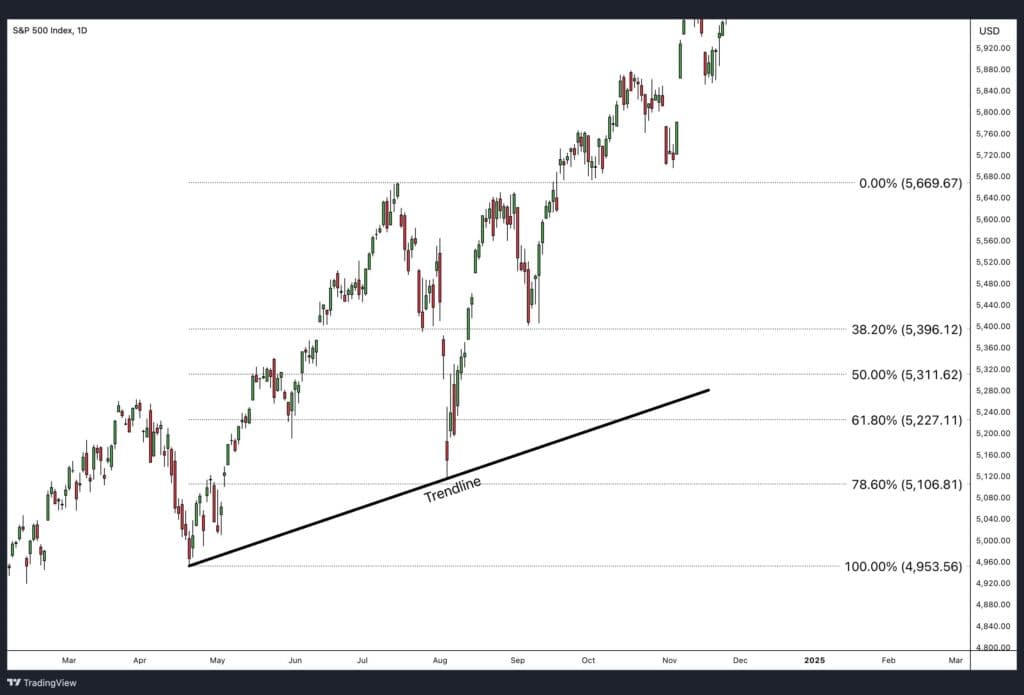
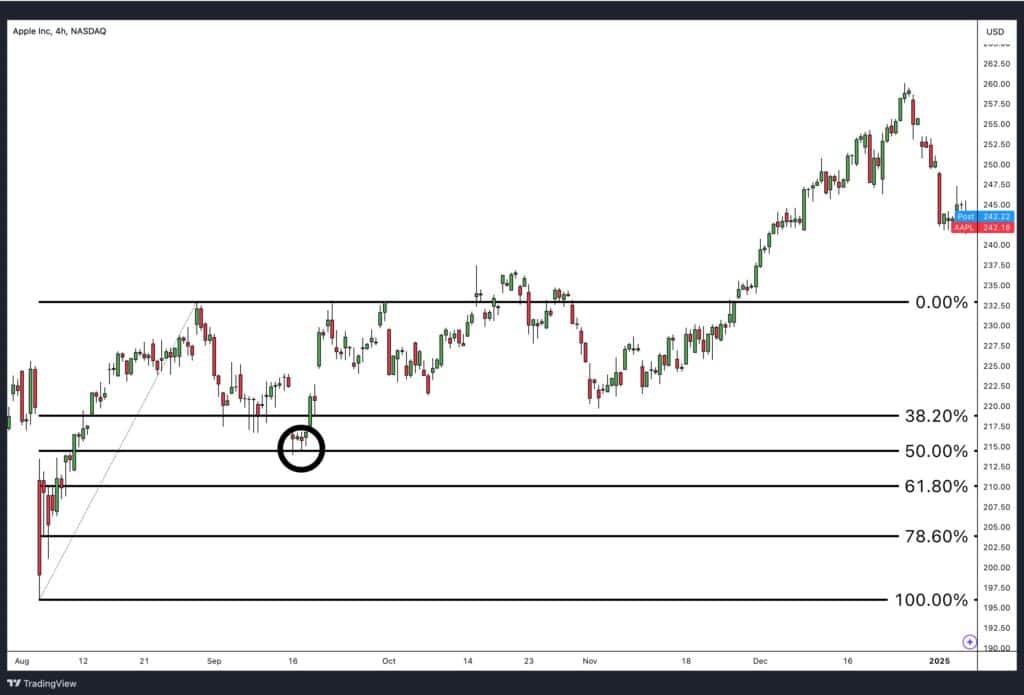
4. Support and Resistance with Fibonacci Retracement
Fibonacci retracement is a technical tool that identifies potential support and resistance levels based on key percentages derived from the Fibonacci sequence. These levels, such as 38.2%, 50%, and 61.8%, represent potential reversal zones.
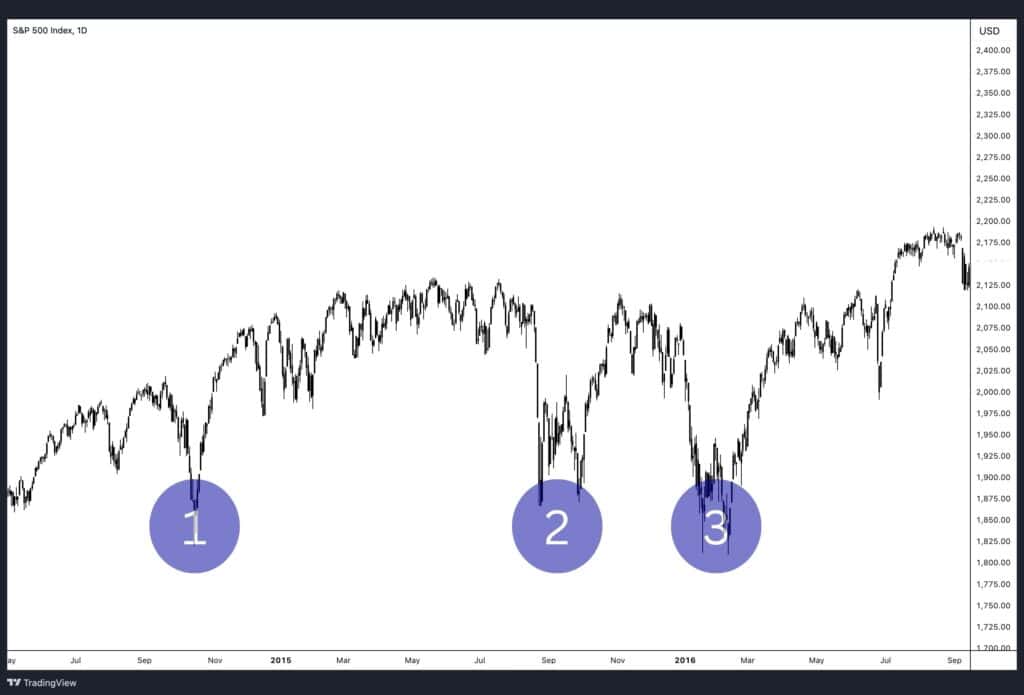
Example: S&P 500 Index
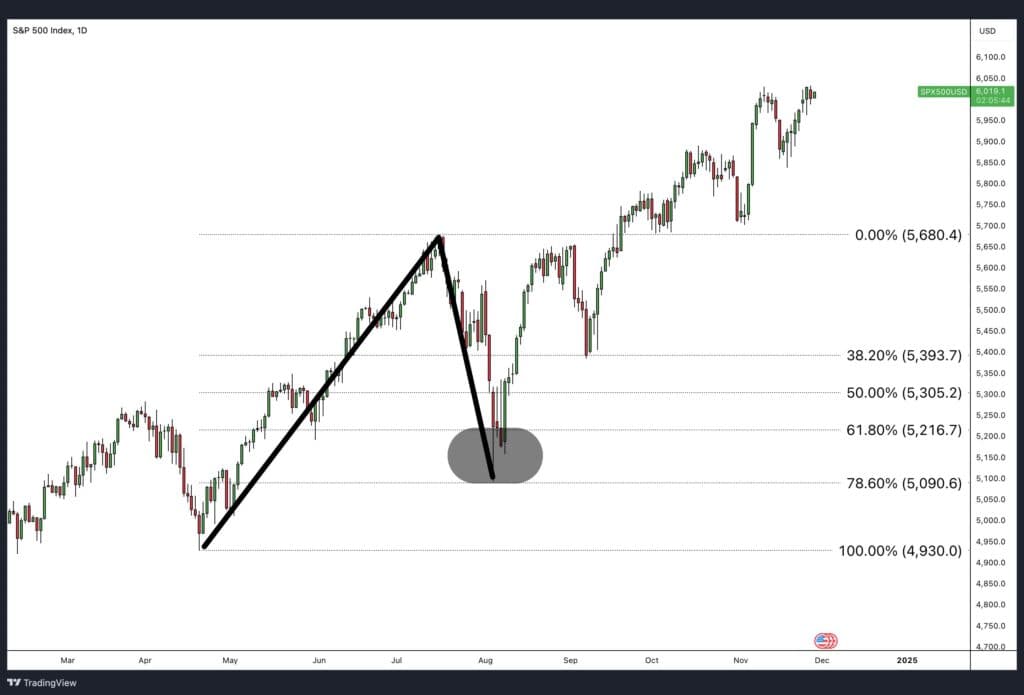
The chart shows a Fibonacci retracement applied to a strong upward move. After the price peaks, it retraces to key levels (highlighted as horizontal lines). Notice how the price finds support near the 61.8% level, indicated by the grey oval, before continuing upward.
- How It Works:
- Fibonacci levels are calculated from a high-to-low price move.
- These levels act as support during pullbacks in an uptrend or resistance during corrections in a downtrend.
Traders use these levels to identify potential zones for entering trades, placing stop-losses, or taking profits.
Why These Methods Work Together
Support and resistance levels are effective because they reflect the behaviour and psychology of market participants. Whether they are horizontal levels from historical data, diagonal trendlines, or dynamic indicators like moving averages, these tools all serve to provide actionable insights.
By combining methods such as Fibonacci retracement with trendlines or moving averages, traders can increase their confidence in predicting future price movements.
Strength of Support and Resistance
The strength of support and resistance levels determines how reliable they are for predicting price movements. Strong levels are those that the market respects consistently, making them more trustworthy for identifying entry, exit, and stop-loss points. Several factors contribute to the strength of support and resistance, including the number of touches, round numbers, volume at certain price levels, and the timeframe in which they are observed.
1. Number of Touches in Support and Resistance
The number of times a price interacts with a support or resistance level is a key indicator of its strength. More touches signify greater importance, as they show that market participants repeatedly react to that level.
Two Points: A Potential Level
- A horizontal support or resistance level can be identified with just two touches of price action.
- However, such a level is not yet fully validated, as it might be coincidental or temporary.
- Traders consider it a potential level, needing further confirmation through additional price interactions.
Three Points or More: A Reliable Level
- A support or resistance level becomes reliable when it is touched at least three times by price action.
- This repetition demonstrates that the level is being respected by the market as either a floor (support) or a ceiling (resistance).
- Example: A stock price that bounces off $50 on three separate occasions signals strong demand, making $50 a solid support level.
The more times a level is tested without breaking, the stronger it becomes, as it reflects consistent behaviour from buyers or sellers at that price.
2. Round Numbers in Support and Resistance
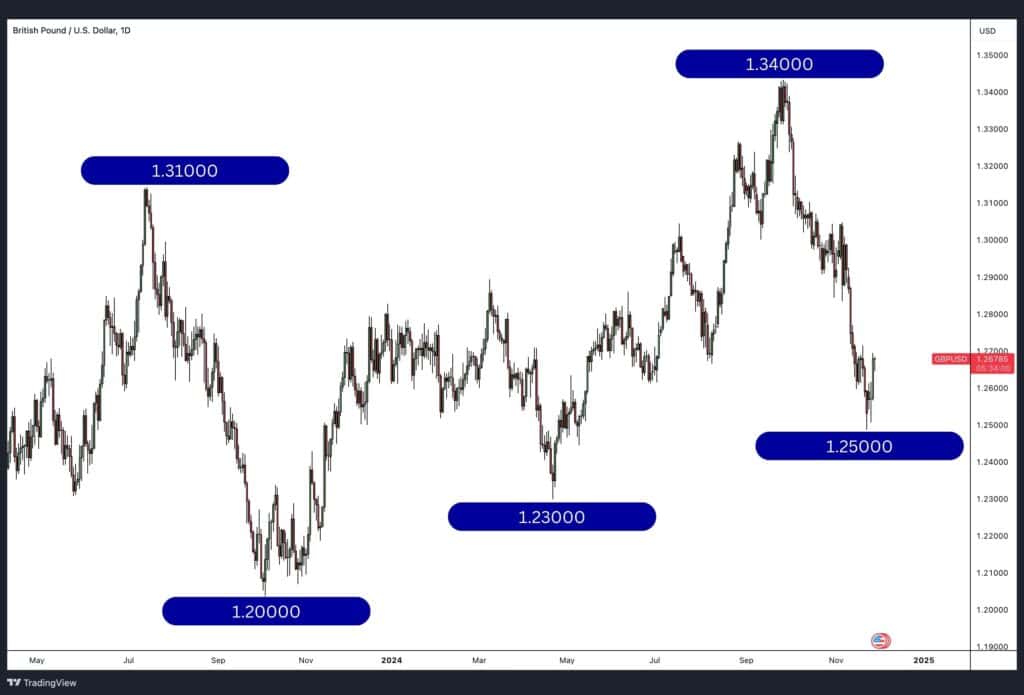
Round numbers often serve as psychologically significant support and resistance levels. These levels attract attention because they are easy reference points for traders and investors.
- Why Round Numbers Work:
- Traders tend to place buy or sell orders at rounded figures (e.g., $10, $100, $1,000).
- These orders create clusters of activity around these levels, reinforcing their importance.
- Round numbers are particularly relevant in forex, where levels like 1.0000 or 1.2000 often act as strong psychological barriers.
- Example: A stock that struggles to rise above $100 demonstrates that the market perceives this price as overvalued. If the price eventually breaks through $100, it often results in a significant move due to the removal of this psychological barrier.
3. Volume at Certain Price Levels
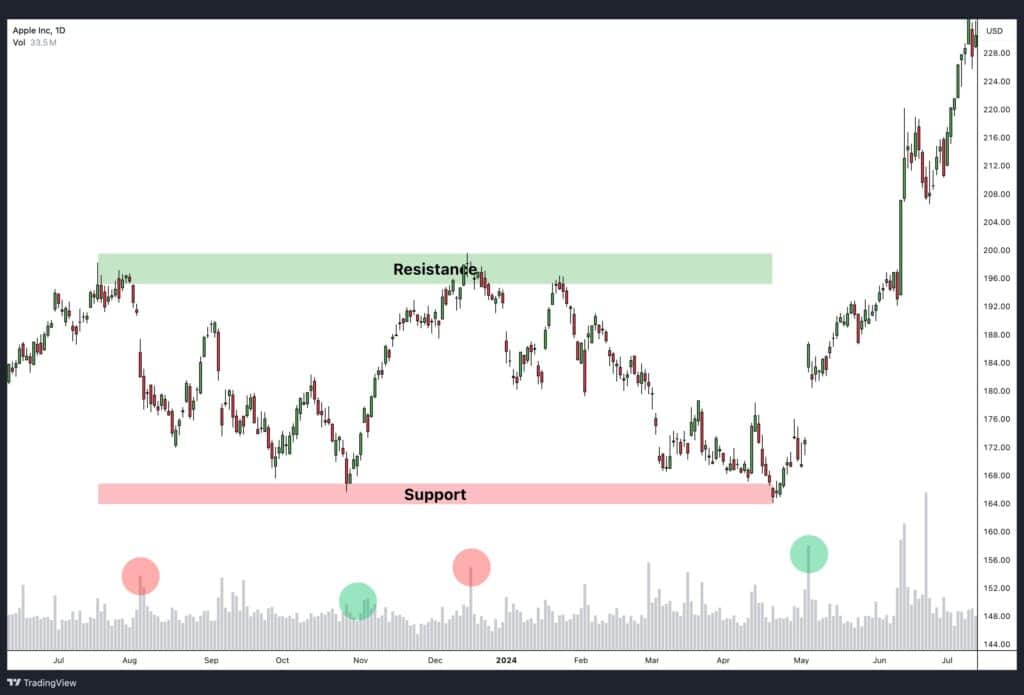
Volume plays a critical role in determining the strength of support and resistance. High trading activity at a specific price level indicates that buyers and sellers strongly agree on the asset’s value, reinforcing the importance of that level.
- Volume at Support Levels:
- Large buy orders at support levels show strong demand, preventing prices from falling further.
- If the volume diminishes at support, it signals weakening demand and a potential breakdown.
- Volume at Resistance Levels:
- High volume at resistance reflects strong selling interest, which prevents the price from climbing further.
- A breakout above resistance with high volume indicates conviction in the move, making it more likely to sustain.
- Example: If a stock repeatedly trades around $200 with significant volume, that level becomes a key reference point for traders watching future price action.
4. Timeframes of Support and Resistance
Support and resistance are flexible concepts that apply across all timeframes. However, the higher the timeframe, the stronger the support and resistance levels tend to be.
Why Timeframe Matters
- Higher timeframes, such as daily, weekly, or monthly charts, carry more weight because they reflect broader market consensus and significant price action.
- Support or resistance levels on lower timeframes (e.g., 1-hour or 15-minute charts) are useful for short-term trading but are generally weaker due to the influence of noise and volatility.
Practical Guidance for Traders
- Day Traders: Focus on intraday support and resistance on 15-minute or 1-hour charts, but keep an eye on higher timeframes for overall market context.
- Swing Traders: Rely on daily or weekly support and resistance levels to identify major turning points.
- Long-Term Investors: Use monthly or quarterly charts to identify key levels that can influence trends for months or years.
Support Can Become Resistance
One of the most important concepts in technical analysis is the idea that support can turn into resistance and vice versa. When price breaks through a support level, that same level often acts as resistance during a retracement. This phenomenon occurs because market participants who were previously buyers at the support level may now become sellers when price retests the same area from below.
Why Does Support Become Resistance?
- Change in Market Sentiment:
- When support fails and price breaks below it, it signals a shift in market sentiment. Buyers who previously supported the level may now believe the price will fall further, causing them to exit positions or turn into sellers.
- Trader Psychology:
- Traders who bought at support but failed to exit before the breakdown may look to “get out” at breakeven when the price retraces back to that level. This creates selling pressure, turning the previous support into resistance.
- Stop-Loss Triggering:
- When a support level breaks, it often triggers stop-loss orders placed just below the support. This increases selling pressure and reinforces the level as new resistance when price retests it.
Example 1: Support Turning into Resistance
Let’s say a stock has strong support at $50, where buyers repeatedly stepped in to prevent the price from falling further. However, after multiple tests, the price breaks below $50 and falls to $45. Later, as the price returns to $50, the same level now acts as resistance.
- What’s Happening?
- Traders who bought near $50 before the breakdown may use this retracement as an opportunity to sell and minimise their losses.
- New sellers enter the market, expecting the $50 level to hold as resistance, reinforcing the price rejection.
Outcome: The price hits $50 but fails to break above, confirming that the previous support has now become resistance.
Example 2: Resistance Turning into Support
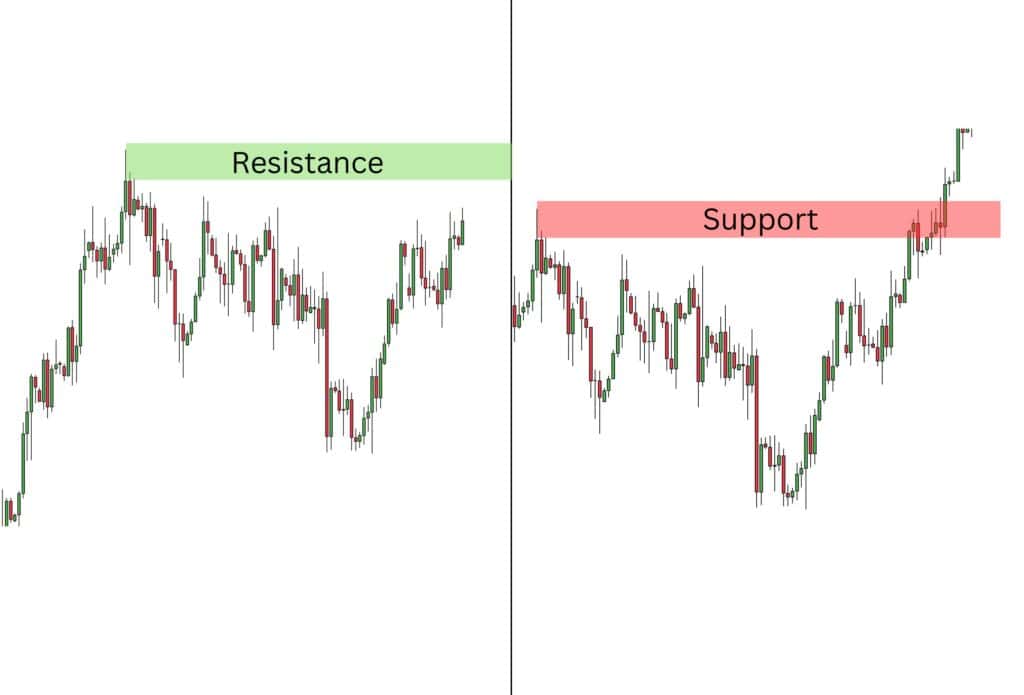
Conversely, when price breaks through a resistance level, that level can turn into support. For instance, a stock repeatedly struggles to rise above $100 (resistance). After a strong breakout, the price surges to $110 before retracing back to $100. This time, $100 acts as support because:
- Traders who missed the initial breakout may enter buy positions when the price retraces to $100.
- Sellers who previously dominated the level may exit their positions, reducing supply and supporting the price.
Outcome: The price tests $100, but buyers step in to defend it, causing the price to bounce upward.
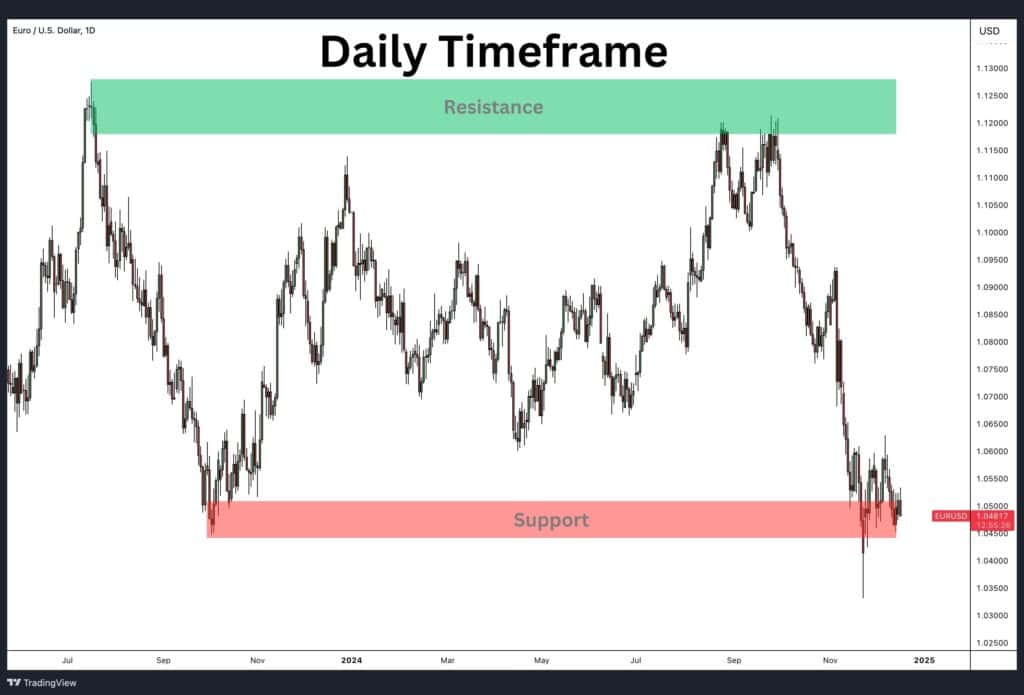
How to Identify Strong Support and Resistance Levels
Identifying strong support and resistance levels is a key skill for traders looking to predict price movements, manage risk, and make strategic decisions. Strong levels are areas where price repeatedly reacts, showing a balance between buyers and sellers. By recognising these levels, traders can better identify potential reversals, breakouts, and trends. Below are the key methods to identify strong support and resistance levels.
1. Observe Historical Price Reactions
The most reliable support and resistance levels are those that have been tested multiple times in the past. These levels represent areas where buying or selling pressure has consistently caused price reversals or pauses.
- How to Identify:
- Look for horizontal levels where price repeatedly reverses or stalls.
- Identify areas where multiple candlestick wicks or bodies align.
- Why It Works:
- Significant highs and lows are remembered by traders and create self-fulfilling price barriers.
Example: If a stock consistently rebounds near $50, this price becomes a strong support zone. Conversely, if the price struggles to rise above $100 multiple times, that level establishes a resistance zone.
2. Identify Psychological Levels
Round numbers and key psychological price points often act as strong support or resistance. These levels attract attention because traders and investors place buy or sell orders at these prices.
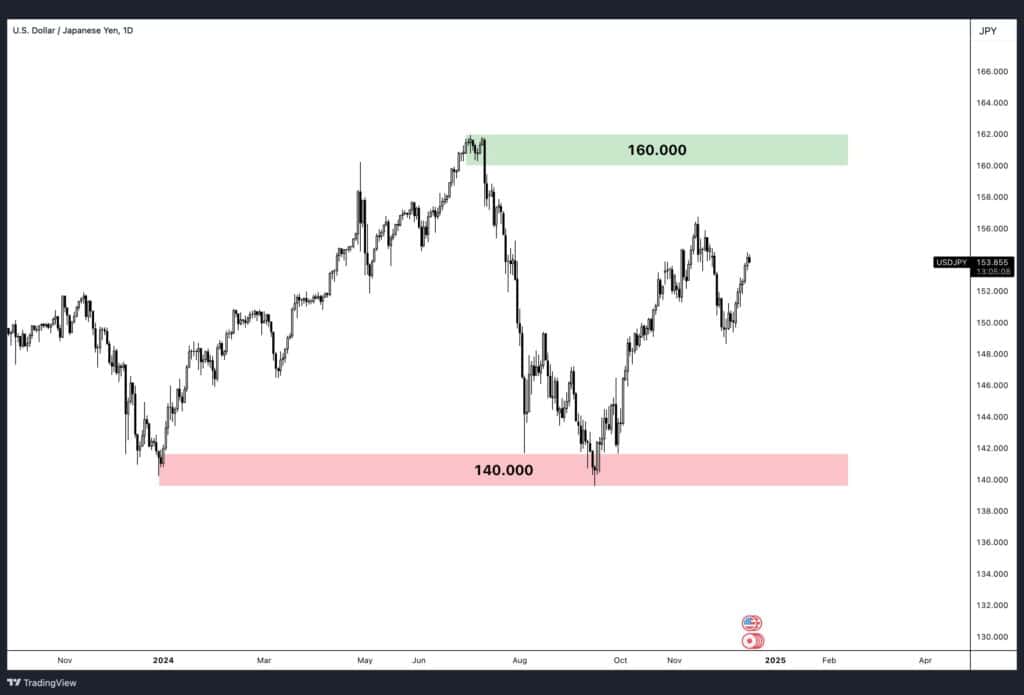
- Examples of Psychological Levels:
- $10, $50, $100 in stock prices.
- 140.000, 160.000 in forex markets.
- Why It Works:
- These levels are easy for traders to identify and remember. Large orders often cluster around them, increasing their importance.
Practical Tip: Pay close attention to how price behaves around round numbers, as they often act as strong barriers for support or resistance.
3. Analyse the Number of Price Touches
The more frequently price tests a level without breaking it, the stronger the level becomes. Each touch indicates the level is being respected by market participants.
- Key Guidelines:
- A level with 2 touches is considered a potential support or resistance but requires further confirmation.
- A level with 3 or more touches is considered strong and reliable.
Example: If a commodity price tests a resistance level of $150 three times without breaking, it indicates strong selling pressure. Likewise, repeated bounces at $120 show solid buying interest, confirming it as support.
4. Use Higher Timeframes
Support and resistance levels observed on higher timeframes (daily, weekly, or monthly charts) carry more significance than those on shorter timeframes (15-minute or 1-hour charts).
- Why Higher Timeframes Are Stronger:
- Higher timeframes reflect larger market trends and the actions of institutional traders with significant capital.
- Levels on daily or weekly charts are respected by a broader group of traders, making them more reliable.
- Practical Strategy:
- Identify major support and resistance zones on the weekly or daily chart.
- Use shorter timeframes to fine-tune trade entries and exits.
Example: A support level at $100 on a weekly chart is more significant than a short-term level on a 15-minute chart, as it reflects longer-term market behaviour.
5. Watch for Breakouts and Retests
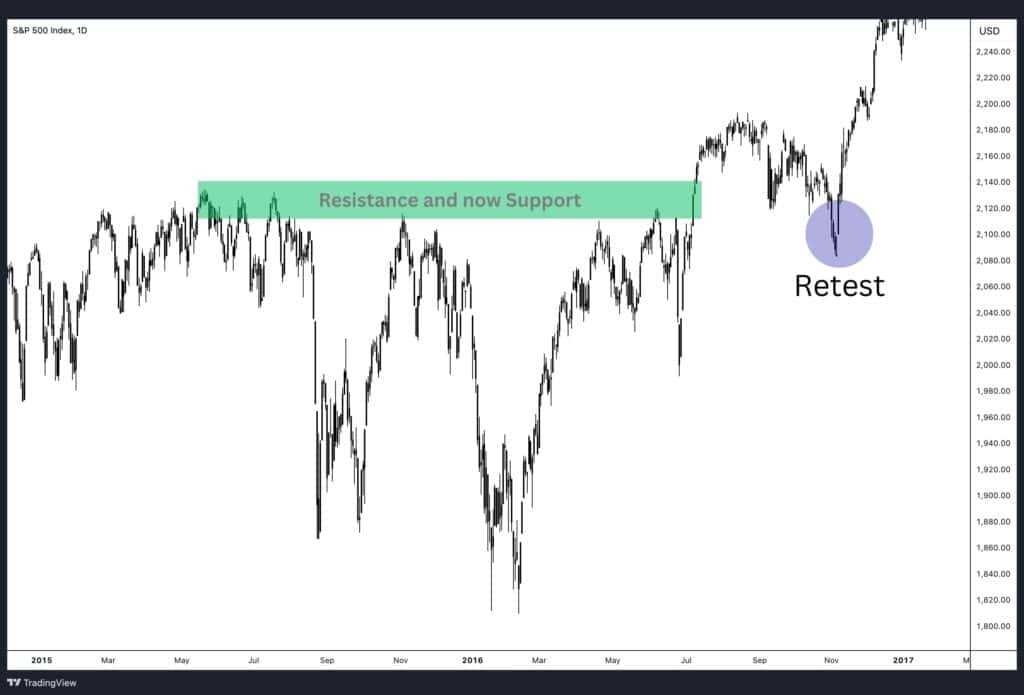
A strong support or resistance level is further validated when price breaks through it and then retests the same level. Breakouts followed by a retest confirm that the level is significant.
- How It Works:
- A break below support often turns it into new resistance when retested.
- A break above resistance often turns it into new support when retested.
What to Look For:
- Strong breakouts with momentum.
- A price retracement back to the level, followed by rejection or bounce.
Types of Support and Resistance
Support and resistance levels can be categorised into three main types based on their behaviour and adaptability to price movements: fixed, dynamic, and semi-dynamic levels. Understanding these distinctions helps traders use the right levels for their specific trading strategies.
1. Fixed Support and Resistance Levels
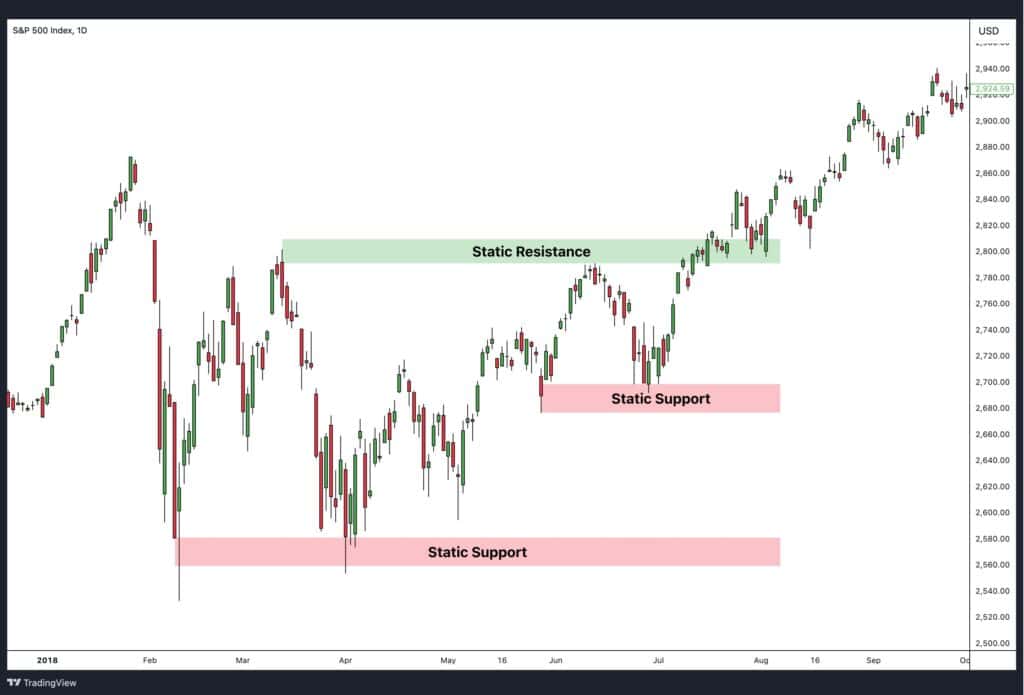
Fixed levels are static price zones that do not change over time. These levels are horizontal and are usually derived from significant highs, lows, or key psychological price points.
- Characteristics:
- They remain constant regardless of market conditions or price movements.
- Derived from historical price reactions, such as swing highs, swing lows, or round numbers.
- When to Use:
- Ideal for identifying clear support or resistance zones where price has reversed multiple times.
- Commonly used in range-bound markets or when planning entry and exit points.
Example: An index, such as SPX, that consistently finds support at $2560 and resistance at $2800 creates fixed levels that traders monitor for bounces or breakouts.
2. Dynamic Support and Resistance Levels
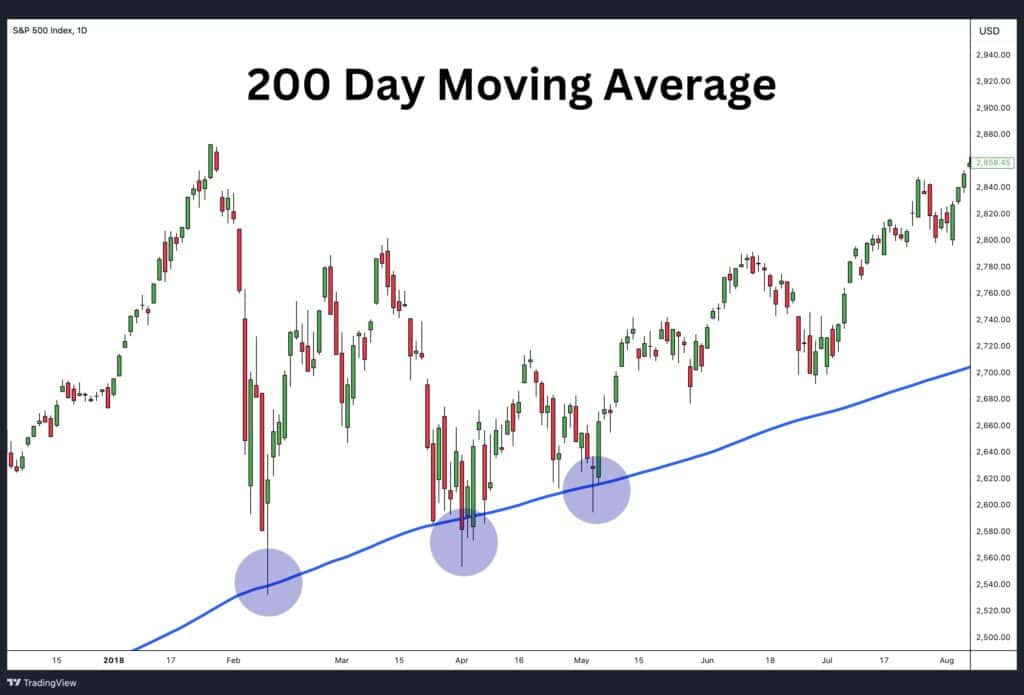
Dynamic levels change over time, moving in tandem with the price. These are typically created using technical indicators, such as moving averages.
- Characteristics:
- They adjust as price moves, providing flexible and real-time support or resistance zones.
- Commonly used in trending markets where price action respects indicators like the 50-day or 200-day moving average.
- When to Use:
- Suitable for identifying support and resistance in trending markets.
- Used to spot pullback opportunities within an uptrend or downtrend.
Example: In a rising market, the 200-day moving average often acts as a dynamic support level, where price pulls back, finds buyers, and continues upward. (See the SPX chart example above, where the blue moving average consistently provided support).
3. Semi-Dynamic Support and Resistance Levels
Semi-dynamic levels are partially fixed but can shift over time based on market conditions. These levels are often derived from tools like trendlines and Fibonacci retracement levels.
- Characteristics:
- They are initially drawn based on price action but may evolve as trends develop.
- While they are not horizontal like fixed levels, they are not as fluid as dynamic levels.
- When to Use:
- Useful for identifying diagonal support and resistance in trending markets.
- Ideal for spotting price retracements or reversals at key levels.
Examples:
- Trendlines: A diagonal line connecting higher lows in an uptrend or lower highs in a downtrend acts as semi-dynamic support or resistance.
- Fibonacci Retracement: Price often respects retracement levels (e.g., 38.2%, 50%, 61.8%) as support or resistance during pullbacks.
How to Draw Support and Resistance
Drawing support and resistance levels is a practical skill that helps traders identify key price zones for decision-making. By using peaks, troughs, previous timeframes, moving averages, and trendlines, traders can accurately mark these critical levels.
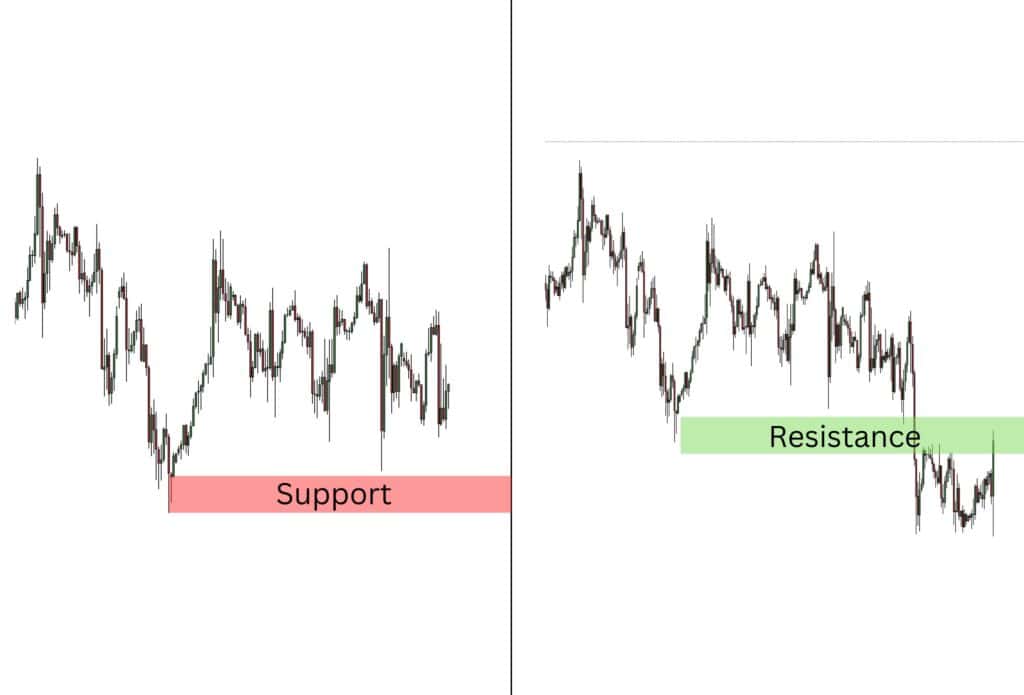
1. Peaks and Troughs
Support and resistance levels are often identified by swing highs (peaks) and swing lows (troughs) on a price chart.
- How to Draw:
- Draw a horizontal line at the price points where the market has repeatedly reversed (highs for resistance, lows for support).
- Focus on areas where multiple peaks or troughs align.
Tip: Look for clear price reactions, such as bounces or rejections, to validate the level.
2. Support and Resistance from a Previous Timeframe
Levels from higher timeframes (e.g., daily, weekly) are often more reliable when trading on lower timeframes.
- How to Draw:
- Start with the daily or weekly chart to mark significant support and resistance zones.
- Switch to a smaller timeframe (e.g., 1-hour or 15-minute) to refine these levels and observe current price action.
3. Moving Averages
Moving averages, such as the 50-day or 200-day moving average, act as dynamic support and resistance as they follow the price.
- How to Draw:
- Apply a moving average indicator to the chart.
- Observe how price interacts with the moving average—it often acts as support in uptrends and resistance in downtrends.
4. Trendlines
Trendlines provide diagonal support and resistance in trending markets.
- How to Draw:
- Connect two or more swing lows (for support) or swing highs (for resistance).
- Extend the line forward to identify where price might interact with it in the future.
Tip: The more times price touches a trendline, the stronger it becomes as support or resistance.
Support and Resistance Examples
The charts below illustrate real-world examples of support and resistance in action. Each example highlights how price reacts at key levels, providing traders with opportunities to identify reversals, breakouts, and market structure.
Example 1: Crude Oil – Strong Support Zone
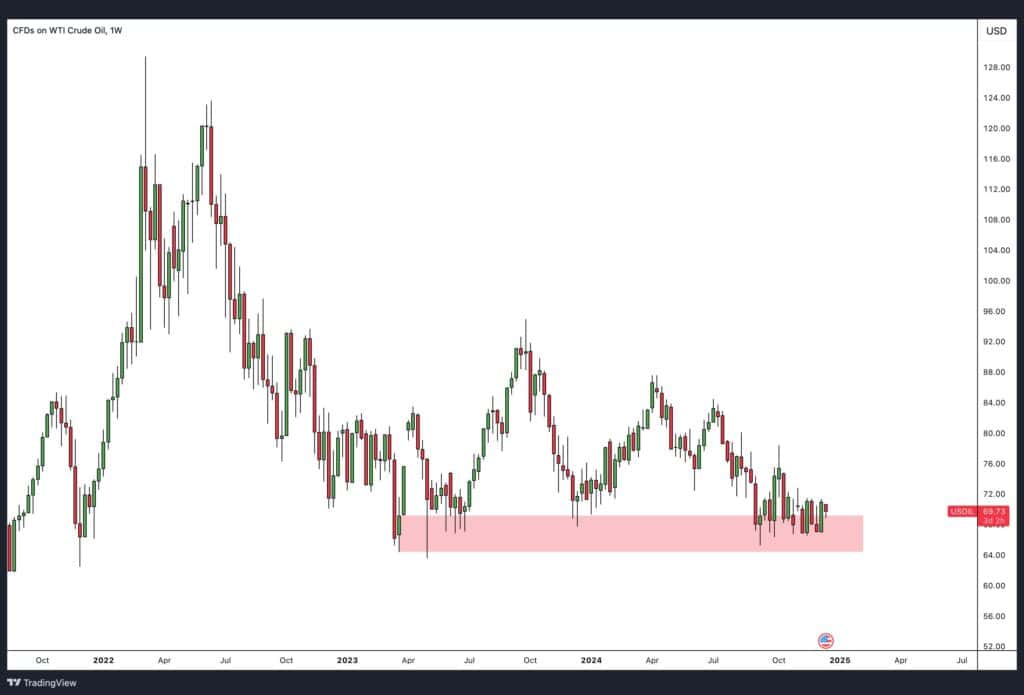
In the WTI Crude Oil chart (Image 1), the price repeatedly tests the highlighted support zone (red area) near $67–$70. Each time the price approaches this level, it finds buyers, preventing further declines.
- Key Insight:
- This area acts as a floor where demand is strong, stopping price from falling further.
- The multiple bounces off this zone confirm it as a reliable support level.
Example 2: USDCAD – Ascending Support and Horizontal Resistance
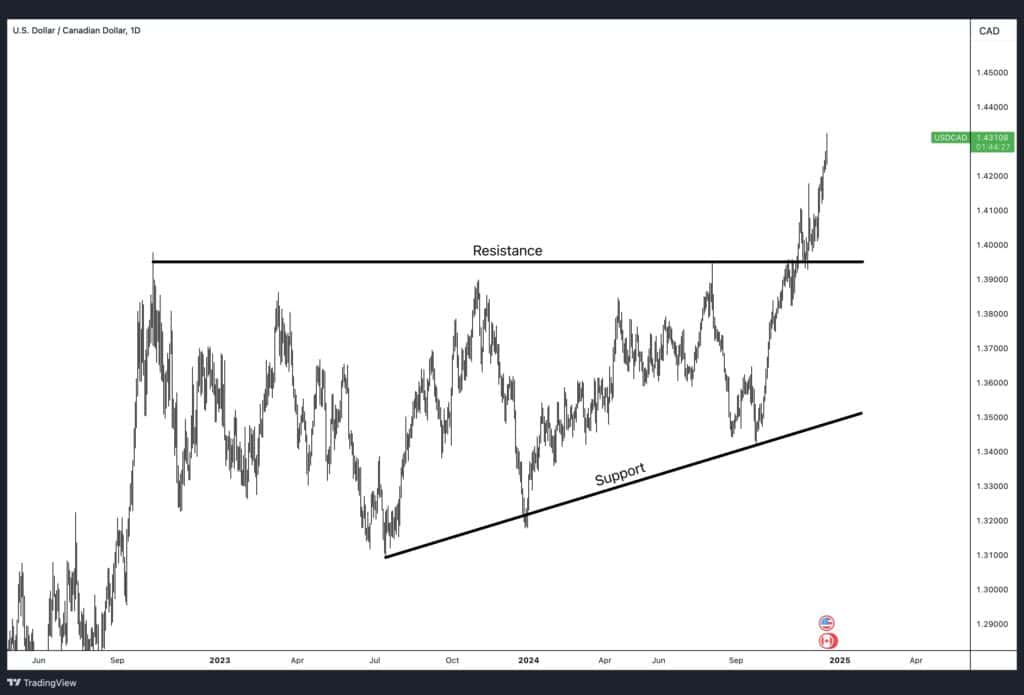
The USD/CAD chart (Image 2) shows price respecting two distinct levels:
- A rising support trendline, where price consistently finds buyers at higher lows.
- A horizontal resistance level near 1.3950, where price struggles to break above for a long time.
- Key Insight:
- The support trendline demonstrates upward momentum as buyers step in at higher prices.
- The horizontal resistance reflects strong selling pressure, capping further gains.
Example 3: Bitcoin – Breakout Above Resistance
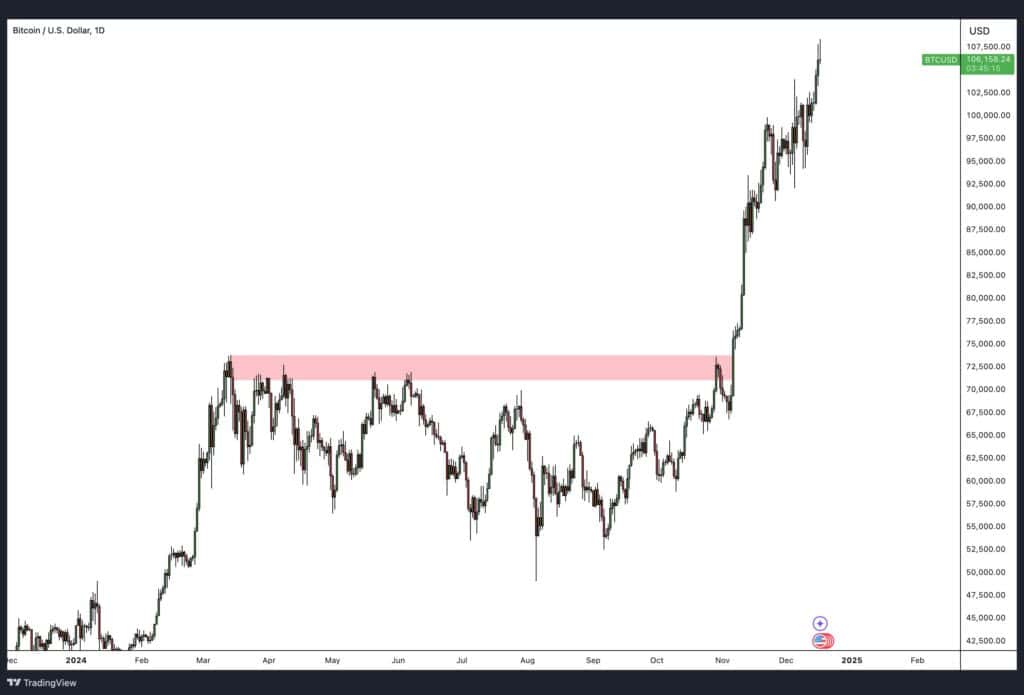
In the Bitcoin chart (Image 3), price repeatedly tests the resistance zone (red area) near $72,000. After consolidating for some time, price finally breaks above this level and surges higher.
- Key Insight:
- The resistance zone initially prevents upward movement.
- A clean breakout above resistance signals strong buying momentum, leading to a sharp upward trend.
Example 4: Tesla – Resistance Becomes Support
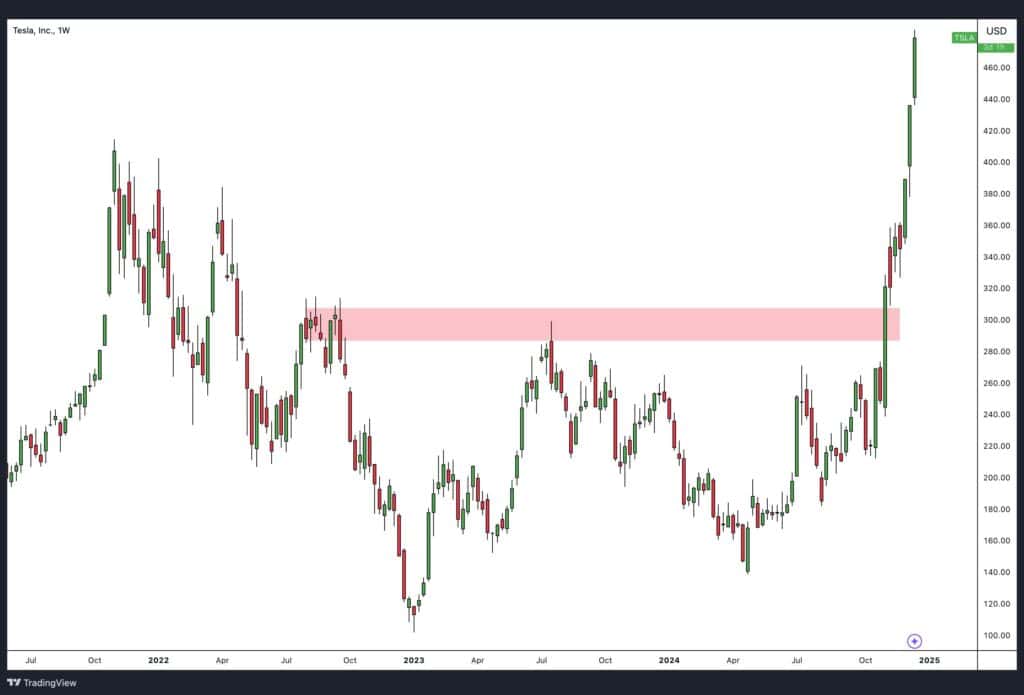
In the Tesla chart (Image 4), the price initially faces resistance around $300, as shown by the red zone. However, once price breaks above this level, the resistance zone turns into a support area during future price retracements.
- Key Insight:
- Resistance levels can turn into support once price breaks above, showing a shift in market sentiment.
- Traders often look for retests of former resistance to confirm its new role as support.
Support and Resistance Trading Strategies
Support and resistance levels provide traders with actionable strategies to capitalise on price movements. Below are the most common strategies and how to effectively use them in trading.
1. Trade Price Action Signals
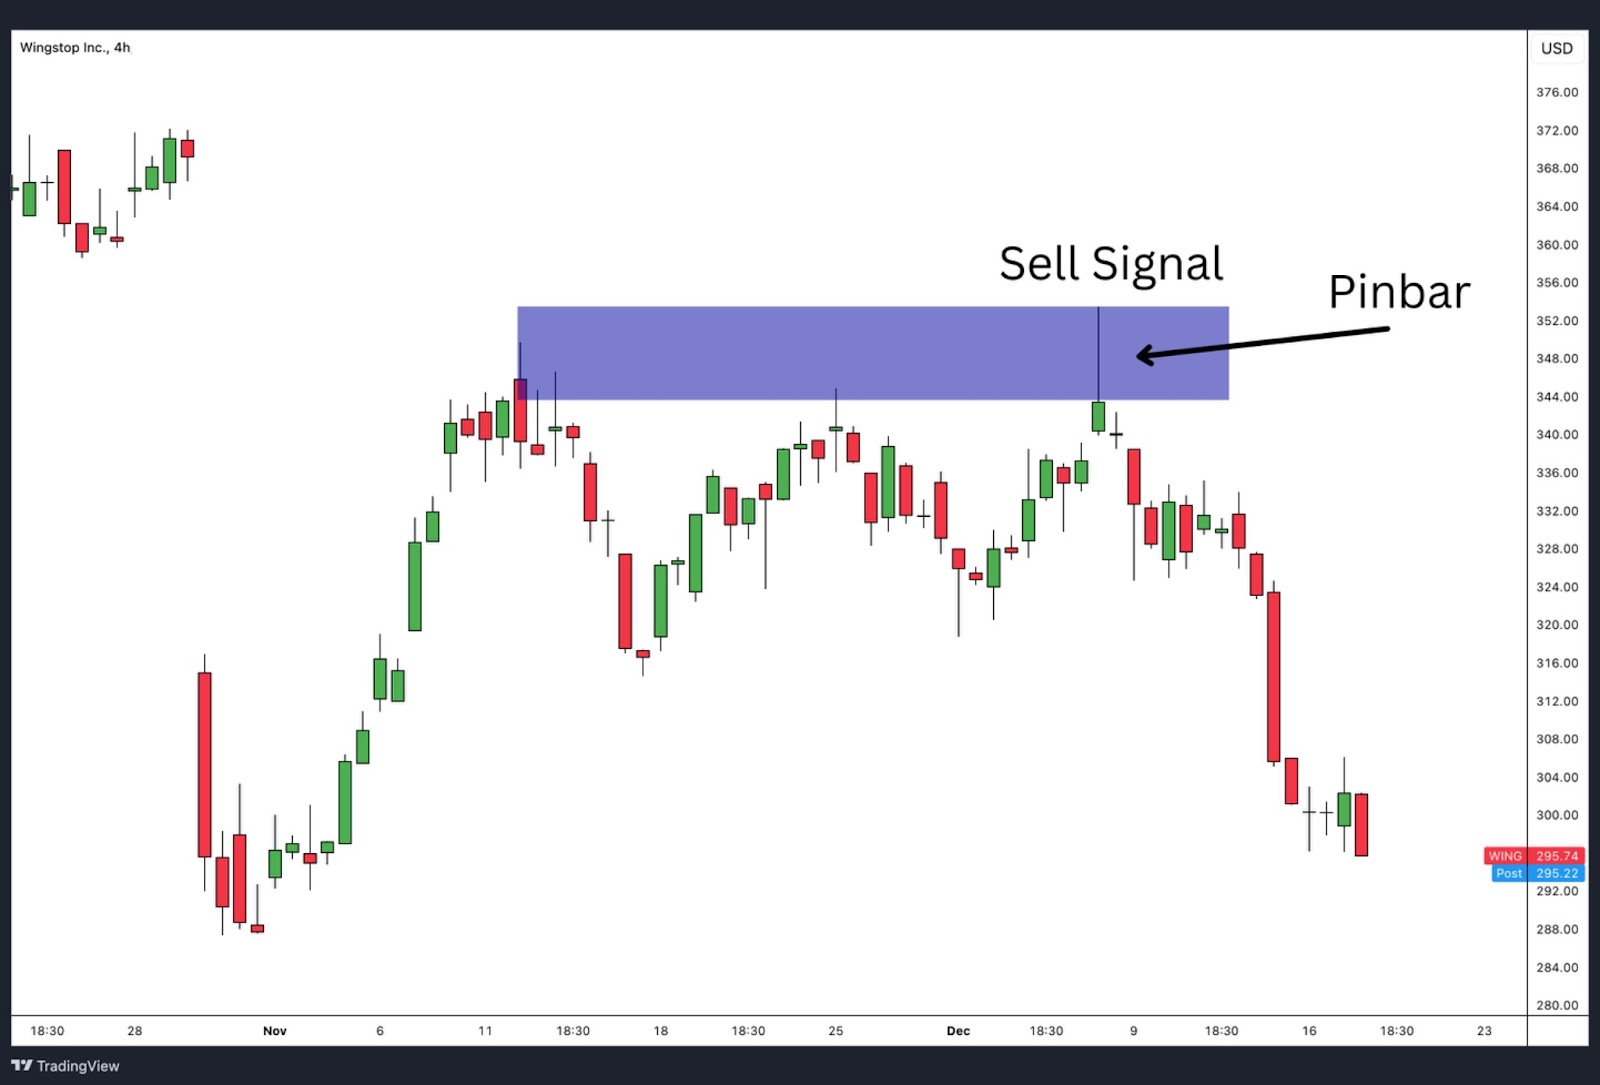
Trading based on price action involves observing candlestick formations or patterns near support and resistance levels. These patterns help traders confirm reversals or continuations without relying on indicators.
- How to Use:
- Watch for signals like pin bars (long wicks), engulfing candles, or doji candles when price reaches support or resistance.
- Enter trades after a clear rejection from the level, using a stop-loss just beyond the support or resistance zone.
Example: A bullish pin bar at support signals strong buying interest, making it an ideal entry point for a long position.
2. Range Trading
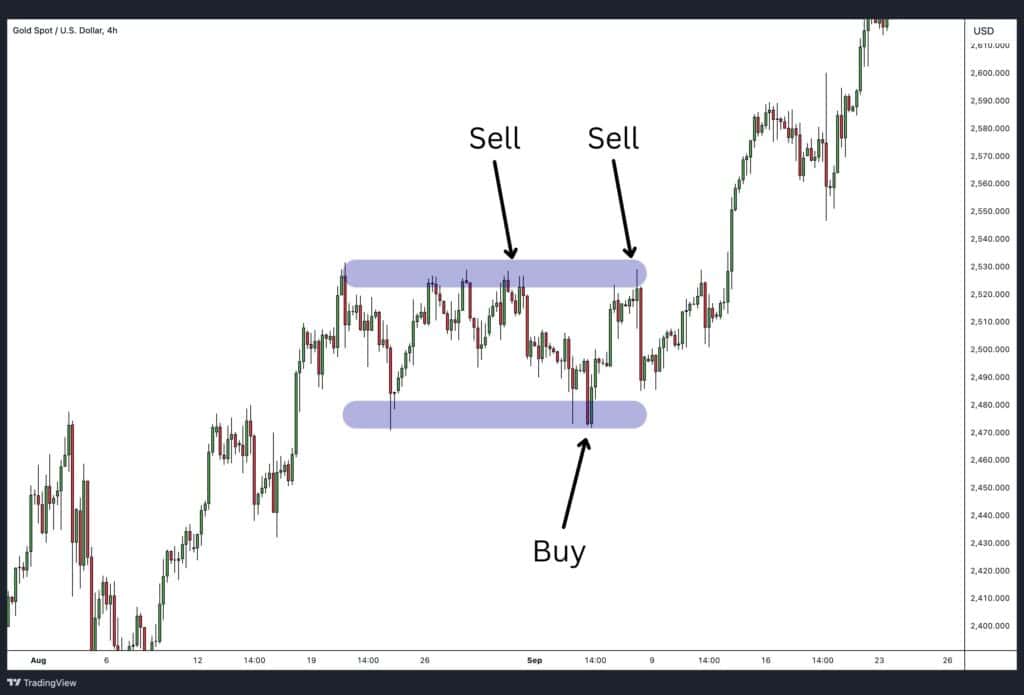
Range trading involves buying at support and selling at resistance when price moves sideways within a defined range.
- How to Use:
- Identify a range where price repeatedly bounces between a horizontal support and resistance level.
- Go long near support with a stop-loss below it.
- Go short near resistance with a stop-loss above it.
Tip: This strategy works best in low-volatility, range-bound markets where no clear trend exists.
3. Breakout Trading
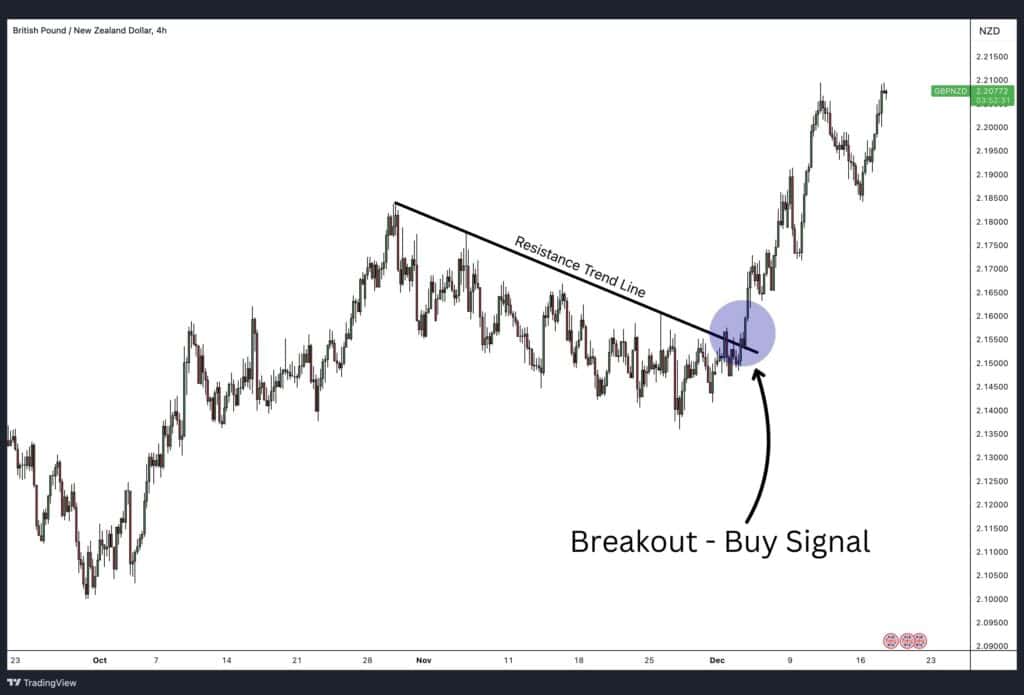
Breakout trading focuses on entering trades when price breaks through a support or resistance level with strong momentum.
- How to Use:
- Wait for a clear breakout, indicated by a strong candlestick closing above resistance or below support.
- Confirm momentum with follow-through price movement.
- Place trades in the breakout direction and set stop-losses near the broken level.
Example: If price breaks above resistance with strong momentum, enter a long position targeting the next key level above.
4. Trendline Trading
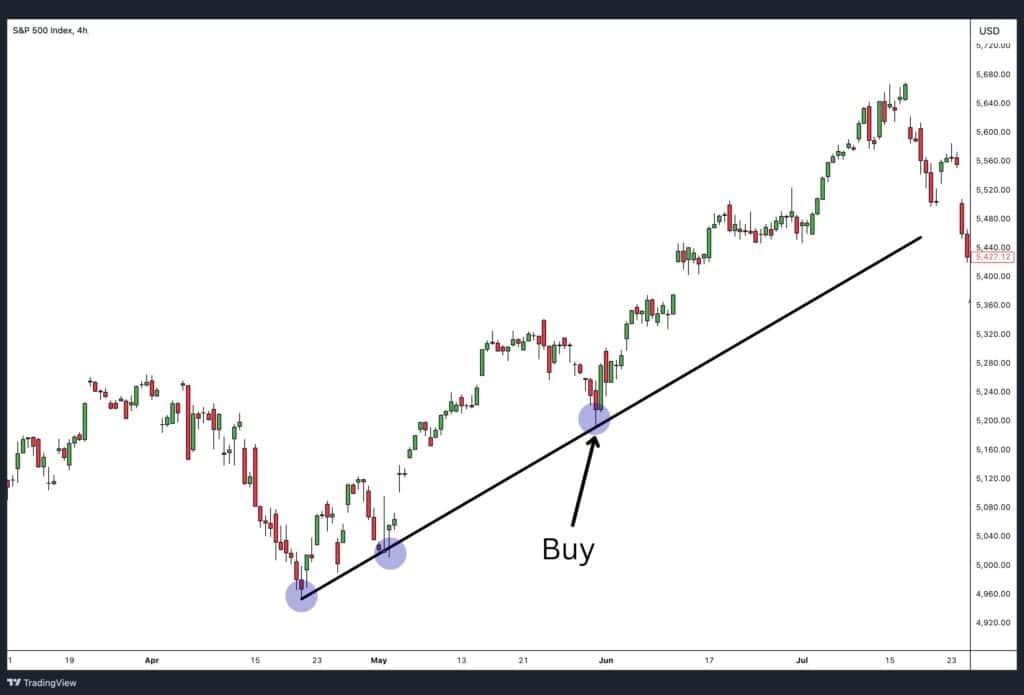
Trendline trading involves trading in the direction of the trend, using trendlines as dynamic support or resistance.
- How to Use:
- In an uptrend, draw a trendline connecting higher lows. Enter long positions each time price bounces off the trendline after the 2nd bounce.
- In a downtrend, draw a trendline connecting lower highs. Enter short positions when price touches the trendline and rejects it after the 2nd time.
Tip: Use multiple touches on the trendline as confirmation of its reliability before entering trades.
5. Moving Average Trading
Moving averages can act as dynamic support or resistance in trending markets. Traders can use them for bounce trades or momentum-based entries.
- How to Use:
- Bounce Strategy: In an uptrend, enter long positions each time price pulls back and bounces off the moving average. In a downtrend, short when price rejects the moving average from below.
- Momentum Strategy: Enter trades in the direction of the trend as long as price stays above (uptrend) or below (downtrend) the moving average.
Tip: The 50-day and 200-day moving averages are popular choices for identifying reliable trade opportunities.
6. Support and Resistance Reversals
Reversal strategies focus on trading price reactions at significant support or resistance levels, especially those identified on higher timeframes (e.g., daily or weekly charts).
- How to Use:
- Monitor price as it approaches a major support or resistance level.
- Look for confirmation signals like candlestick patterns, double tops (at resistance), or double bottoms (at support).
- Enter trades anticipating a reversal, with stop-losses placed just beyond the key level.
Example: If price reaches a strong weekly support level and forms a bullish reversal candle, it signals a buying opportunity.
7. Fibonacci Retracement: Using Levels as Support or Resistance
In an uptrend, Fibonacci retracement levels such as 61.8%, 50%, and 38.2% act as support, providing areas where traders can look to buy during pullbacks. In a downtrend, these same levels act as resistance, where traders can consider entering short positions on price retracements.
- How to Use:
- Draw the retracement tool from the swing low to the swing high in an uptrend or the swing high to the swing low in a downtrend.
- Focus on the 38.2%, 50%, or 61.8% levels, as they often represent strong support or resistance.
- Wait for confirmation with candlestick patterns (e.g., pin bars or engulfing candles) to validate the level.
Example Strategy: In an uptrend, if price retraces to the 50% Fibonacci level, traders can enter a long position, anticipating a bounce back to the previous high or beyond. A Bullish Engulfing Pattern forming at this level further confirms the likelihood of a reversal.
8. Fibonacci Extension: Targeting Resistance and Support Beyond the Trend
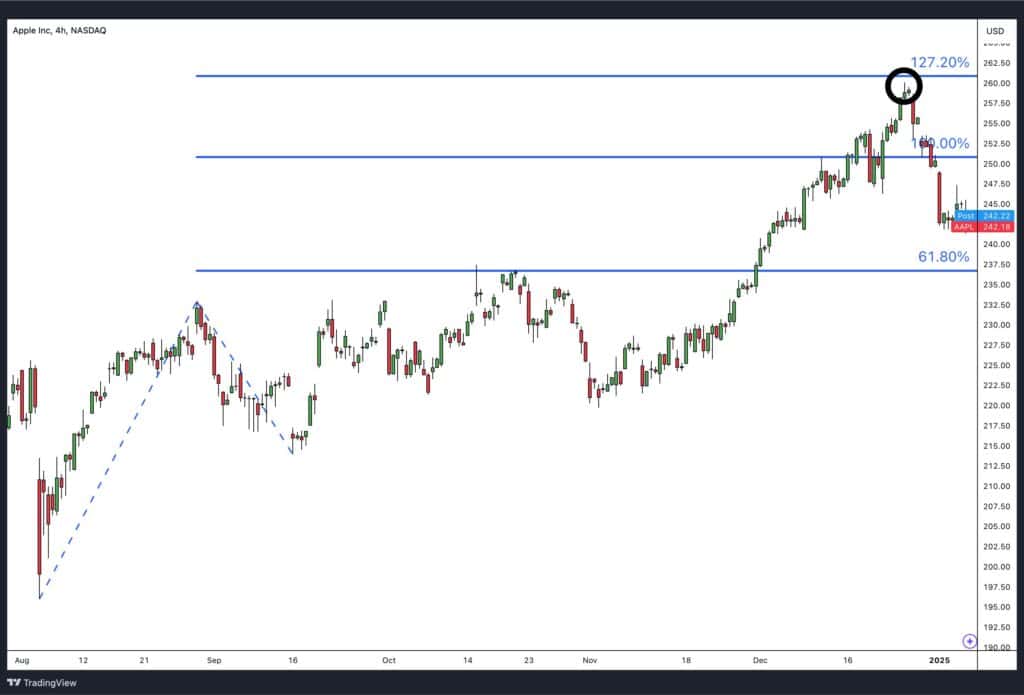
Fibonacci extension levels such as 1.272, 1.618, and 2.618 are used to identify potential resistance levels in an uptrend and support levels in a downtrend. These levels act as logical profit targets or areas where price may reverse.
- How to Use:
- Draw the Fibonacci extension tool by connecting the swing low, swing high, and retracement point in an uptrend or the swing high, swing low, and retracement point in a downtrend.
- Use 1.272 as the first target for profit-taking and 1.618 as the next major level to watch for price reactions.
- Monitor price behaviour at these levels for breakout confirmation or potential reversals.
Example Strategy: In a bullish market, after price breaks above the previous high, traders can use 1.272 and 1.618 Fibonacci extensions as resistance levels for setting profit targets. If price approaches 1.272 and stalls, it may indicate an opportunity to secure partial profits while leaving room for continuation to 1.618.
Advantages of The Support and Resistance
- Simple and Easy to Use:
Support and resistance levels are straightforward to identify and apply, making them suitable for traders of all experience levels. - Works Across All Timeframes:
These levels are effective on intraday, daily, weekly, and monthly charts, providing flexibility for both short-term and long-term traders. - Identifies Entry and Exit Points:
Traders can use support levels for buying opportunities and resistance levels for selling or shorting. - Improves Risk Management:
Support and resistance allow for logical stop-loss placements, helping traders manage risk efficiently. - Reinforces Trade Confidence:
Repeated price reactions at support or resistance confirm the strength of these levels, providing confidence to enter trades. - Effective in Range-Bound Markets:
Support and resistance strategies work well when the market is consolidating within a defined range. - Applicable Across Assets:
Support and resistance analysis can be used in stocks, forex, commodities, cryptocurrencies, and indices.
Disadvantages of The Support and Resistance
- False Breakouts:
Price can break through a support or resistance level briefly and then reverse back, leading traders into false trades. - Subjectivity in Drawing Levels:
Traders may interpret support and resistance differently, leading to inconsistencies in identifying key levels. - Less Effective in Strong Trends:
During strong bullish or bearish trends, price can break through support or resistance without hesitation, making the levels less reliable. - Lagging Nature:
Support and resistance are based on historical price action, meaning they do not always account for sudden market changes or news events. - Requires Confirmation:
These levels often need additional signals (e.g., price action, volume) to confirm their strength, which can complicate decision-making. - Not Foolproof in Volatile Markets:
In highly volatile markets, price can fluctuate rapidly around support and resistance, reducing their reliability.
How Can Market Psychology Influence Support and Resistance Levels?
Support and resistance levels are not just lines on a chart—they are a reflection of collective human emotions, behaviours, and decision-making in the markets. At their core, these levels represent how traders and investors interpret value, fear, greed, and expectations, turning abstract price points into psychological battle zones. Understanding market psychology helps explain why prices react, reverse, or break through these key levels.
Human Emotions and Behavior
The financial markets are driven by human emotions, particularly fear, greed, and indecision. Support and resistance form because these emotions repeatedly influence decision-making:
- Fear of Loss: At support levels, traders who fear missing out (FOMO) or locking in losses may step in to buy, believing the price will rebound. Conversely, at resistance levels, sellers may exit to avoid further risk, creating a ceiling.
- Greed for Gains: Traders at resistance often take profits when the price approaches previous highs, while buyers at support act on the belief that they are purchasing at a discount.
- Herd Mentality: The repeated behaviour of market participants reinforces these levels. If enough traders perceive a price level as support or resistance, it becomes a self-fulfilling prophecy.
Example: When a stock nears $100 (a key psychological price), traders may react strongly—buyers pile in, believing $100 is a fair price, while sellers see it as a good opportunity to exit.
Emotional Price Levels
Certain price levels hold deep psychological significance, shaping the way traders behave:
- Round Numbers: Humans naturally gravitate toward round numbers like $50, $100, or 1.000 in forex markets. These levels often act as magnets for orders because traders anchor their expectations to simple, memorable prices.
- Historical Highs and Lows: Traders remember significant highs or lows as “anchors” for future price movements. When price revisits these levels, emotions like confidence (on rebounds) or anxiety (on breaks) drive decisions.
Why It Matters: Traders view these levels as markers of value. A round number or historical low provides a sense of security to buyers, while a new high tempts sellers to take profits, creating resistance.
How Anchoring Plays Into Support and Resistance Levels
Anchoring is a cognitive bias where individuals rely heavily on the first piece of information they receive (the “anchor”) when making decisions. In the financial markets, anchoring manifests in the following ways:
- Historical Price Points: Traders “anchor” their decisions to previous highs or lows. For example, if a stock once peaked at $150, traders will treat $150 as a key level, even if market fundamentals change.
- Entry Price Bias: Traders anchor to their entry price. If someone buys at $70, they may hesitate to sell until the price revisits that level, even if conditions suggest a new trend.
- Breakout Anchors: When support or resistance is broken, traders anchor to the previous level as a benchmark for future price moves (e.g., a former resistance turning into support).
Philosophical Insight: Anchoring reveals the market’s reliance on memory and expectation. Traders often respond not to what is happening now but to what happened before, projecting past significance onto present price levels.
Support and Resistance Indicators
Support and resistance levels are a key pillar to most any one’s trading strategy. However, with so many support and resistance levels out there, how do we know which levels are likely to hold and which ones are likely to break?
You can use support and resistance indicators to help validate key levels.
Support and Resistance with Bollinger Bands®
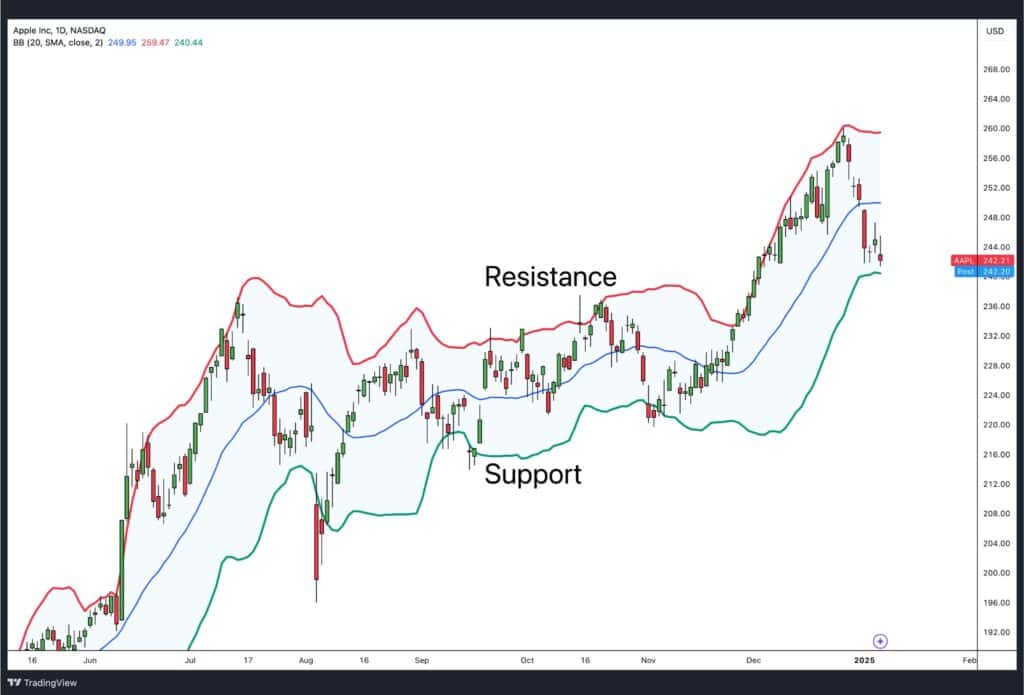
Bollinger Bands® help identify dynamic support and resistance levels by using the upper, middle, and lower bands as reference points. In an uptrend, the middle band (20-period moving average) often acts as support, while the upper band serves as resistance. In a downtrend, the lower band becomes support, and the middle or upper bands can act as resistance.
Traders watch for price bouncing off the bands or closing outside of them for potential reversals or breakouts. For example, a price rejection at the upper band near a resistance level may signal a reversal, while a breakout through the band indicates strong momentum and possible continuation.
Support and Resistance with MACD
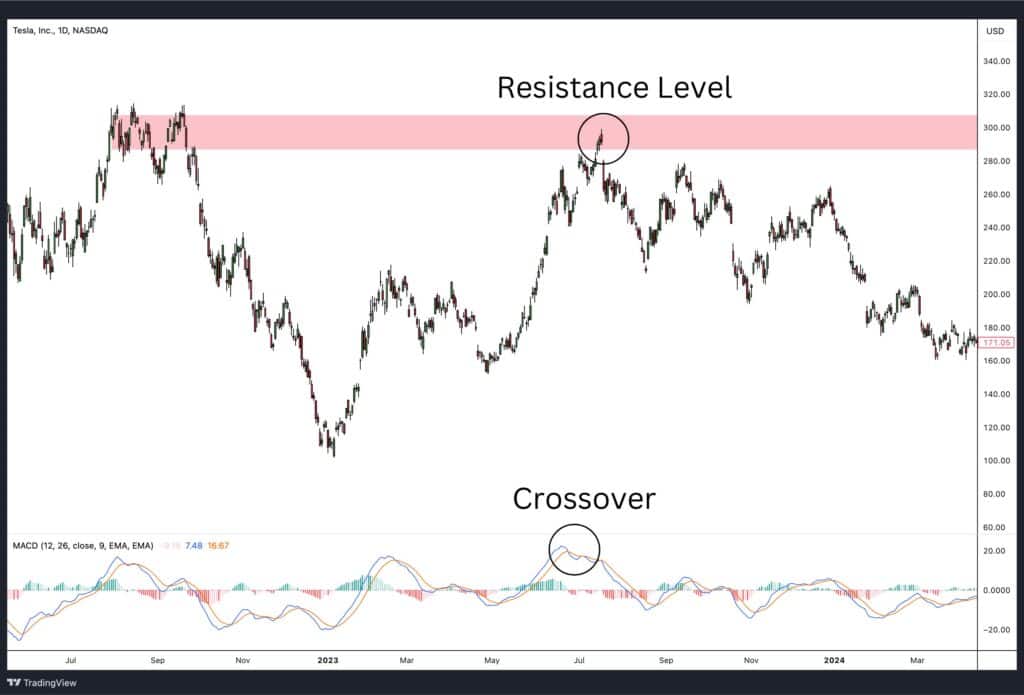
The MACD indicator helps validate support and resistance levels through its signal line crossovers. When the MACD line crosses above the signal line near a support level, it confirms bullish momentum, suggesting the support level may hold. Conversely, a bearish crossover below a resistance level signals a potential reversal or rejection of that level.
Traders use MACD in combination with price action to gain confirmation for entries and exits. For instance, a bullish MACD crossover near a well-tested support level reinforces a buy signal, aligning momentum with price structure.
Support and Resistance with RSI
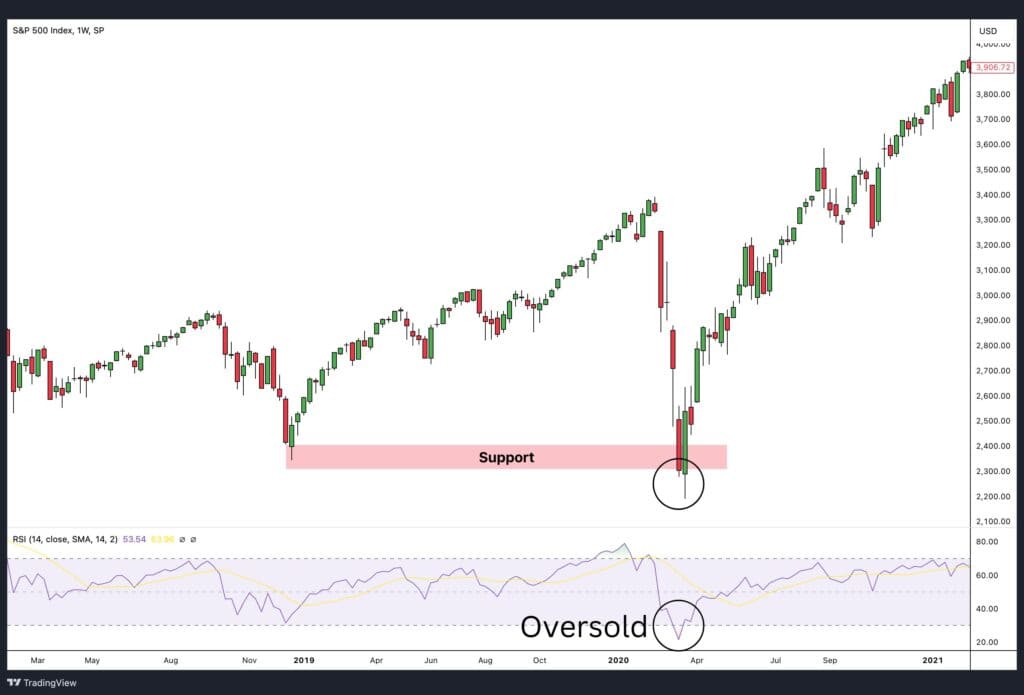
The Relative Strength Index (RSI) helps validate support and resistance by identifying overbought and oversold conditions. A cross above 30 near a support level signals oversold conditions resolving into a bounce, confirming the level’s strength. Similarly, a cross below 70 near resistance indicates overbought conditions and potential rejection.
For example, if price is testing a support level and the RSI moves above 30, traders interpret this as increased buying momentum, validating the level. Conversely, RSI dropping below 70 near resistance confirms selling pressure.
Support and Resistance with Stochastics
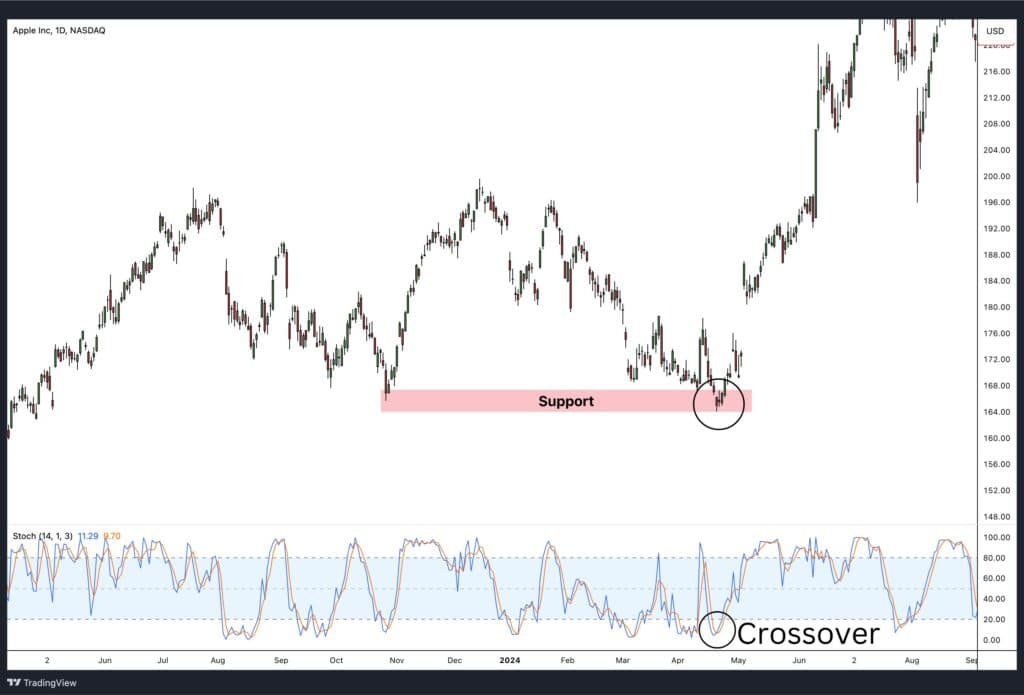
The Stochastic Oscillator validates support and resistance using its %K and %D line crossovers. A bullish crossover near a support level (%K crossing above %D) signals upward momentum and a likely bounce. Conversely, a bearish crossover near resistance (%K crossing below %D) indicates downward momentum and potential rejection.
Traders use Stochastics to refine entries and exits. For instance, if price is holding at resistance and the Stochastic lines cross downward from overbought levels, it signals weakening buying pressure and aligns with a reversal.
Support and Resistance with Keltner Channels
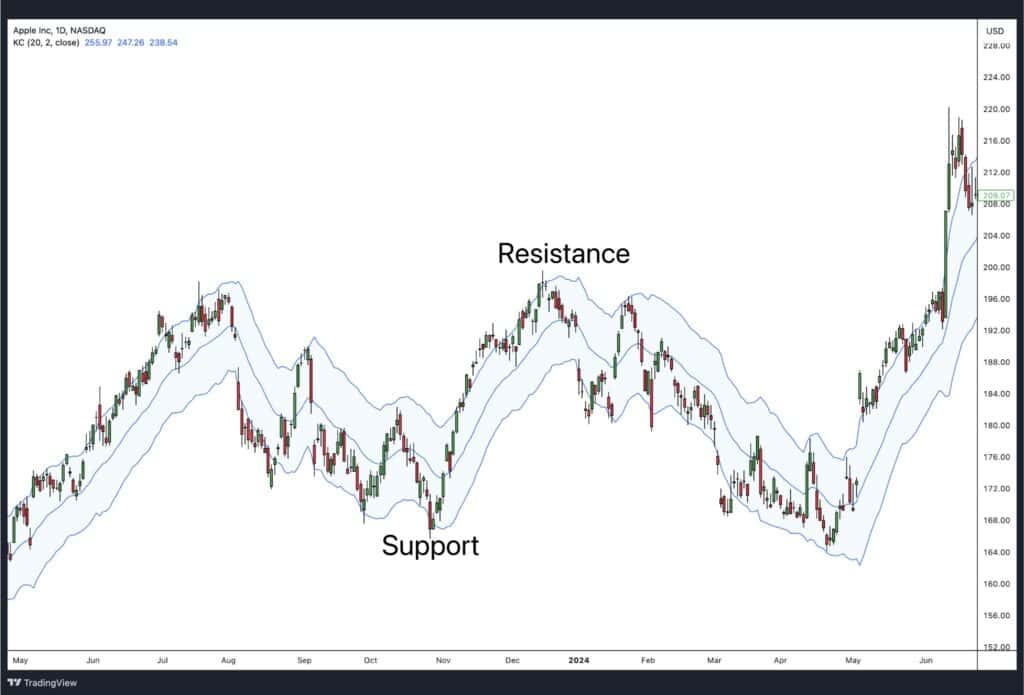
Keltner Channels (KC) provide dynamic support and resistance through their upper, middle, and lower bands, similar to Bollinger Bands®. The middle band (an exponential moving average) often acts as support in an uptrend and resistance in a downtrend, while the upper and lower bands provide additional levels to watch for price interaction.
When price approaches the upper or lower band near a static support or resistance level, traders look for signs of rejection or breakout. For example, a price rejection at the upper KC band near resistance suggests selling pressure and potential reversal.
Support and Resistance with Donchian Channels
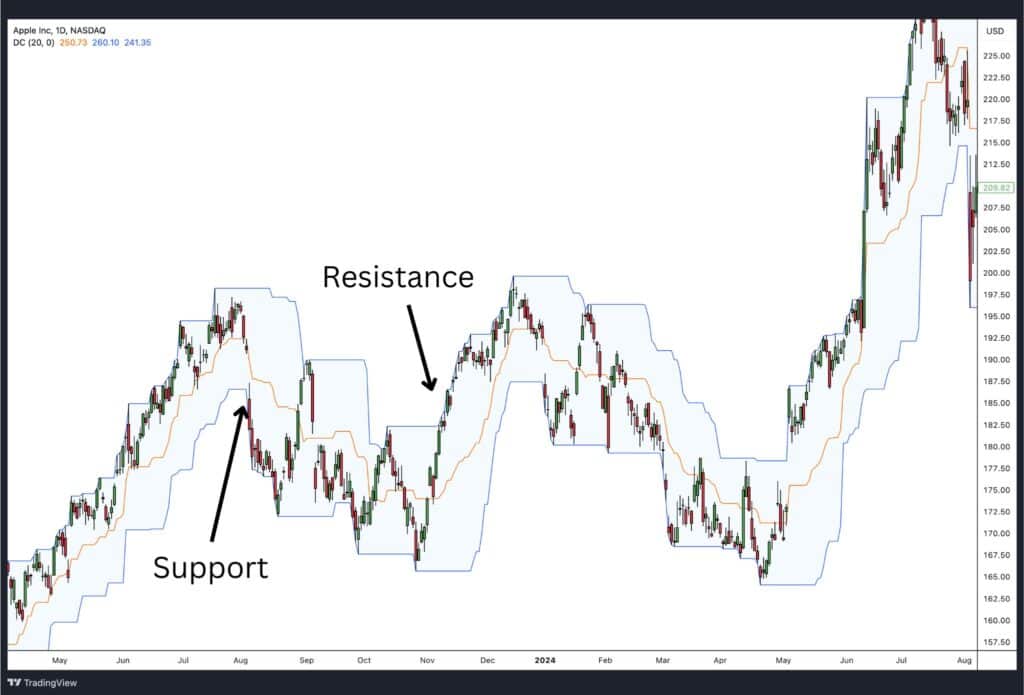
Donchian Channels define support and resistance using the highest high and lowest low of a set period. The upper boundary acts as resistance, while the lower boundary serves as support. Breakouts beyond these levels signal potential continuation, making them ideal for breakout strategies.
For instance, a breakout above the upper channel confirms bullish momentum, while a move below the lower channel confirms bearish momentum. Traders can combine Donchian Channels with horizontal support and resistance to confirm breakout entries.
Support and Resistance with Ichimoku Cloud
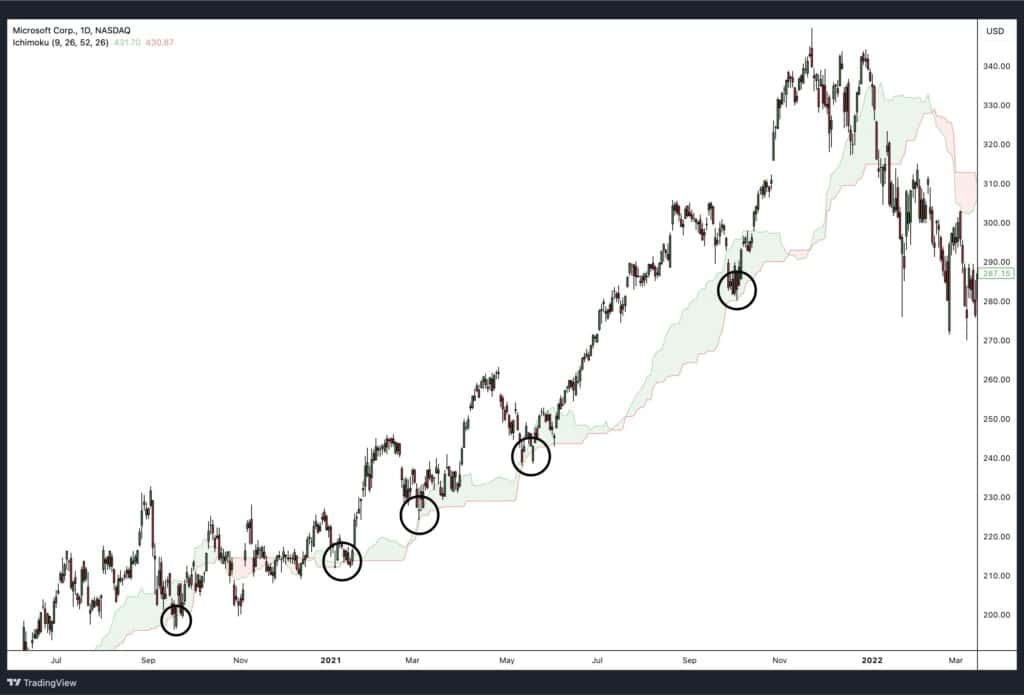
The Ichimoku Cloud provides dynamic support and resistance through the Kumo (cloud). In an uptrend, the cloud’s upper boundary acts as support, while in a downtrend, the lower boundary provides resistance. Price bouncing off the cloud confirms these levels, while a break through the cloud signals a potential trend reversal.
For example, if price pulls back into the cloud during an uptrend and holds, it reinforces the support level. Conversely, a break below the cloud indicates bearish momentum, suggesting a potential breakdown of support.
FAQ
Which time frame is best for support and resistance trading?
The best time frame depends on your trading style. For long-term trades, daily or weekly charts provide strong, reliable levels. For intraday or short-term trading, 1-hour or 15-minute charts are suitable, but higher timeframes like the daily should still be referenced for key levels.
How reliable is support and resistance?
Support and resistance are reliable tools, but their strength depends on factors like the number of price touches, volume, and timeframes. Levels with multiple confirmations on higher timeframes are more trustworthy. However, they are not foolproof and can fail in volatile or strongly trending markets.
What common mistakes should traders avoid when using support and resistance?
- Misidentifying levels due to lack of confirmation (e.g., using only two touches).
- Ignoring false breakouts and overreacting to minor price moves.
- Focusing only on lower timeframes without referencing major levels on higher charts.
- Entering trades without confirmation signals, like price action or volume spikes.
What happens if a price breaks through its support or resistance?
If price breaks through support, it signals bearish momentum, and the broken support often becomes new resistance. If price breaks through resistance, it signals bullish momentum, and the resistance can turn into support. Traders often look for follow-through or retests to confirm the breakout.
How to confirm if support or resistance levels are broken?
A level is confirmed broken when:
- Price closes decisively above resistance or below support.
- The breakout is accompanied by high volume, indicating strong conviction.
- The price successfully retests the broken level and continues in the breakout direction, further validating the move.
Which support and resistance levels are the best?
The best support and resistance levels are those on higher timeframes (daily or weekly) with multiple price touches and strong historical significance. Levels with high trading volume or round numbers also tend to be more reliable.
What are the best support and resistance indicators?
The most effective indicators include moving averages (e.g., 50-day, 200-day), trendlines, and tools like Fibonacci retracement for dynamic levels. These indicators adapt to price movement and complement traditional horizontal levels.