SPX (S&P 500) and BTCUSD (BTC) are taking a heavy loss at the moment, following several rapid news announcements — i.e. Trump’s increased Tariffs on China, and Blackrock selling their Bitcoin. Critical supports revealed below.
SPX (S&P500 Index) Analysis
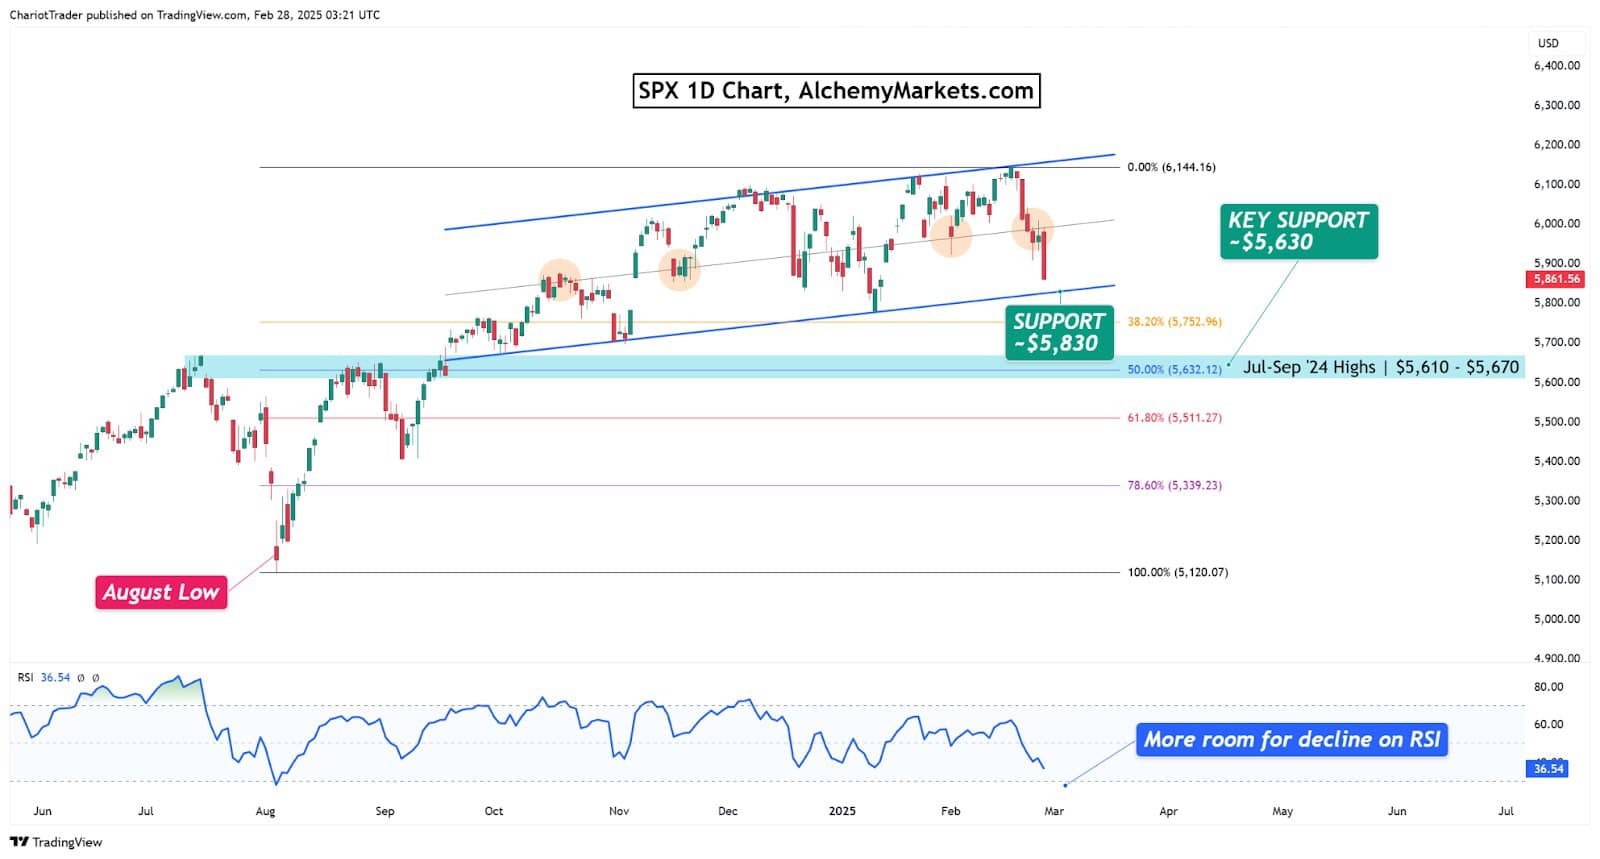
S&P 500 is inside a rising parallel channel. We know this because the price is respecting the middle band of the channel (highlighted by orange circles). The upcoming support is at approximately $5,830.
However, if this support fails, the most critical level is at approximately $5,630, where the previous all-time highs lie, and also aligning with the 50% Fibonacci Retracement level at $5,632.
The daily RSI suggests further room for downside in the coming days. A dip into the oversold levels would also mean this would be the first time in 7–8 months that S&P500 became oversold; making it a healthy correction!
VIX At Resistance: But Critical Levels Lie Ahead
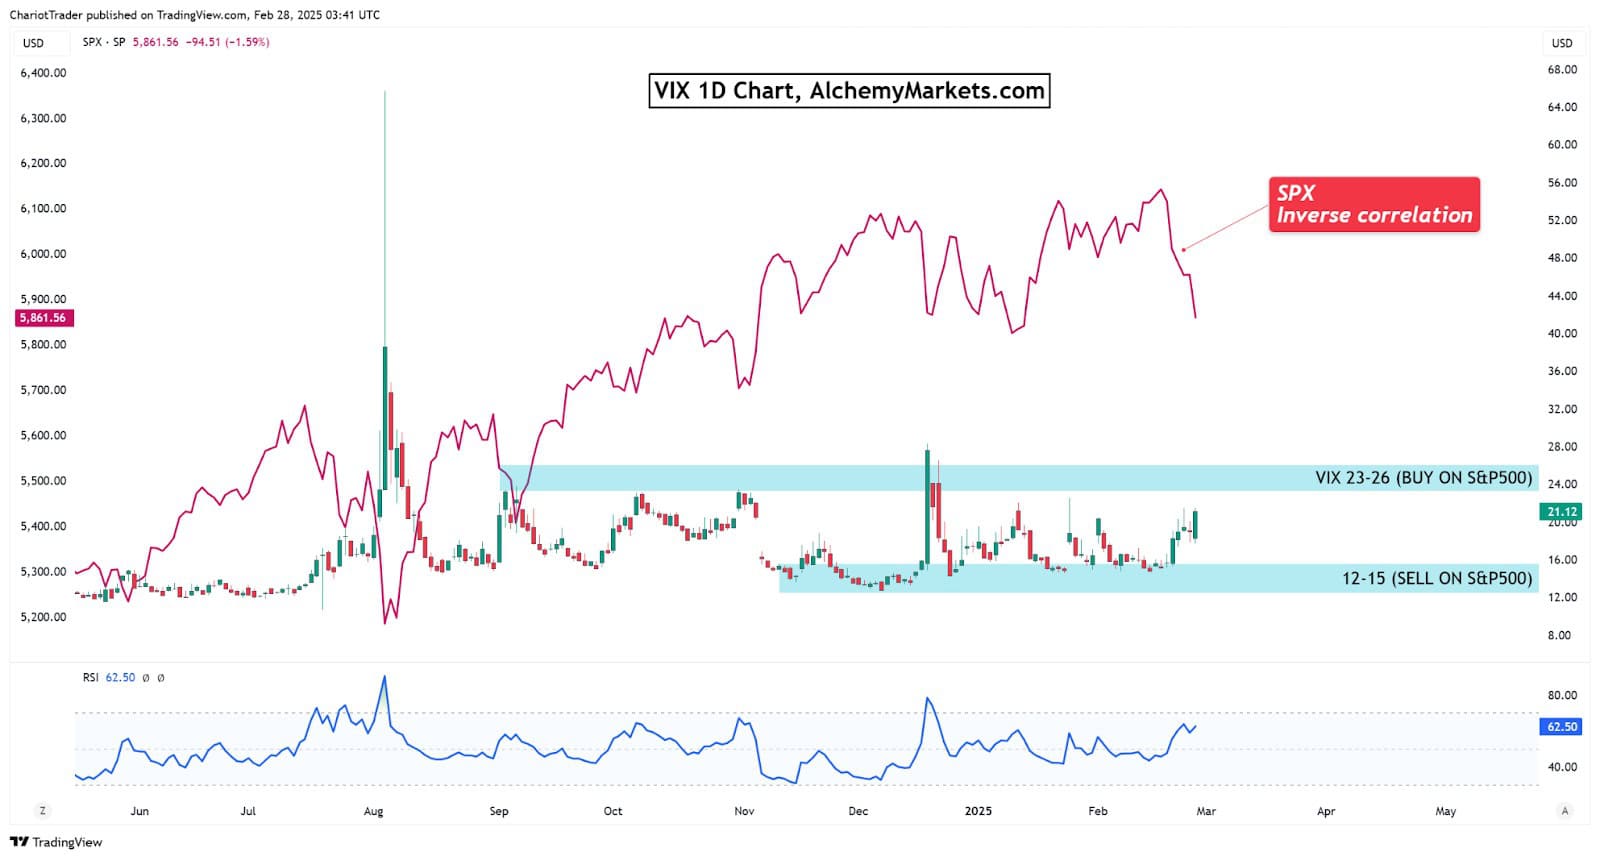
According to the VIX (SPX Volatility) chart, it’s likely to see further downside on S&P 500. This chart is inversely correlated with the SPX, which is painted by the red line on this chart. Notice how everytime the VIX spikes, the S&P500 drops? By charting out the support and resistance on the SPX, then observing the price action on the SPX, we can add extra confluence to our analysis.
Currently, the VIX is at resistance (20), but these levels have been tapped into for the past three times in 2025—weakening its power. The true critical resistance would lie between 23–26, which, if the VIX rejects from, would be a bullish sign for the SPX.
The RSI indicates further upside on the VIX is possible, but does not guarantee that a spike higher would occur.
BTC (Bitcoin) Analysis
The Bitcoin price is currently struggling from crashing new lows since December 2024.
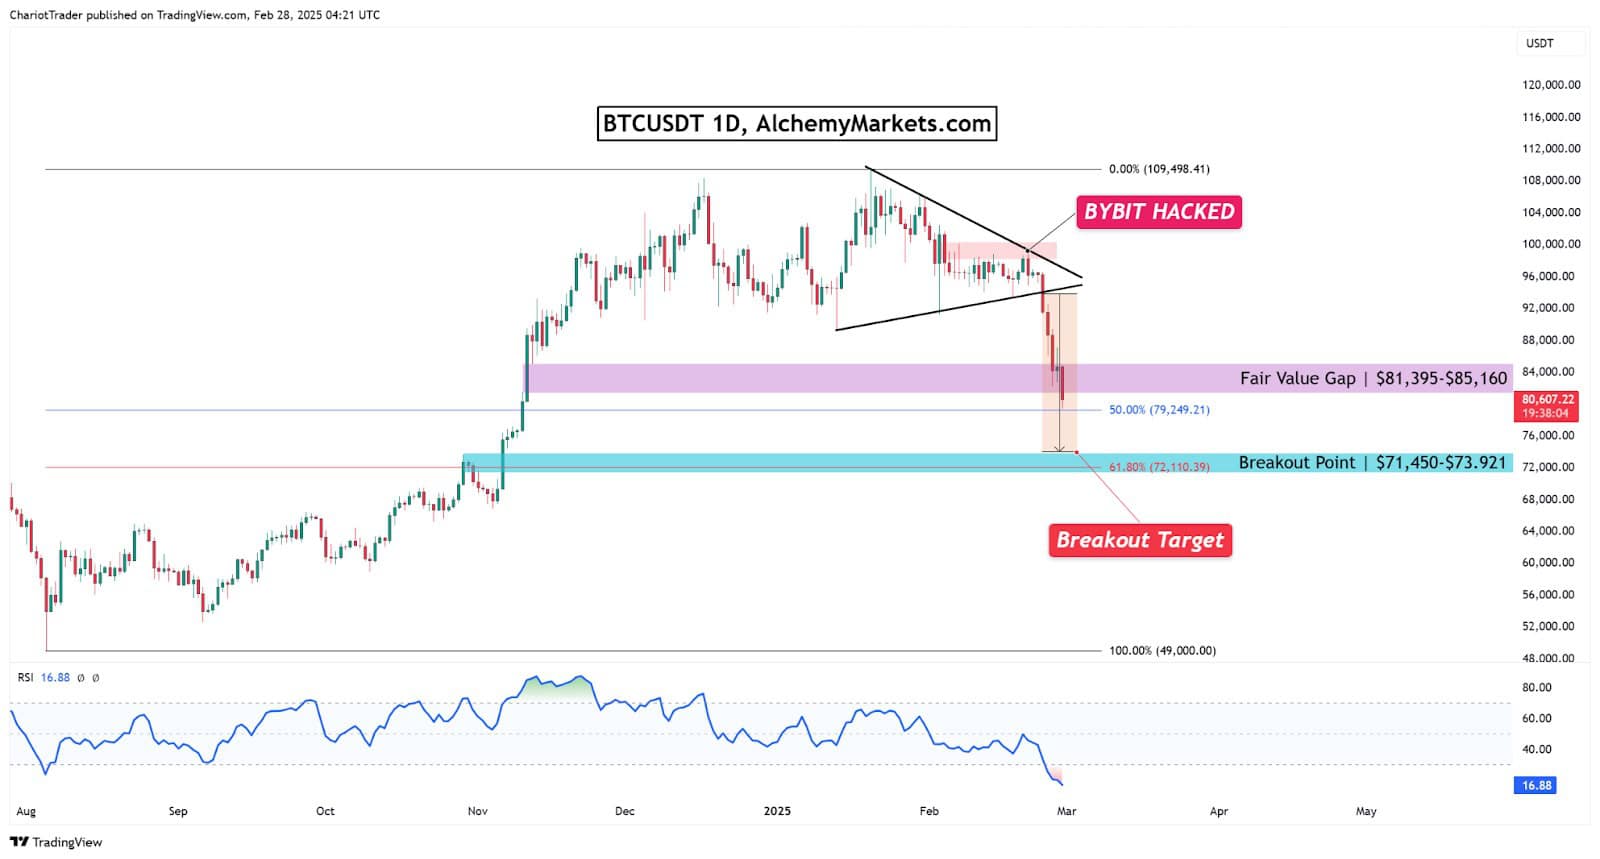
This move comes after the Bybit hack fiasco, and the fair value gap support between $81,395-$85,160 is currently seeing a breakdown. The daily candle must not close below $81,395 for this level to hold.
Critical support levels lie at the 50% Fibonacci Retracement of $79,249, and at the 61.80% Fib of $72,110.39, which aligns with two other support levels: the support zone at $71,450–$73,921, and the breakout target of the triangle pattern.
Alternative View: Double Top
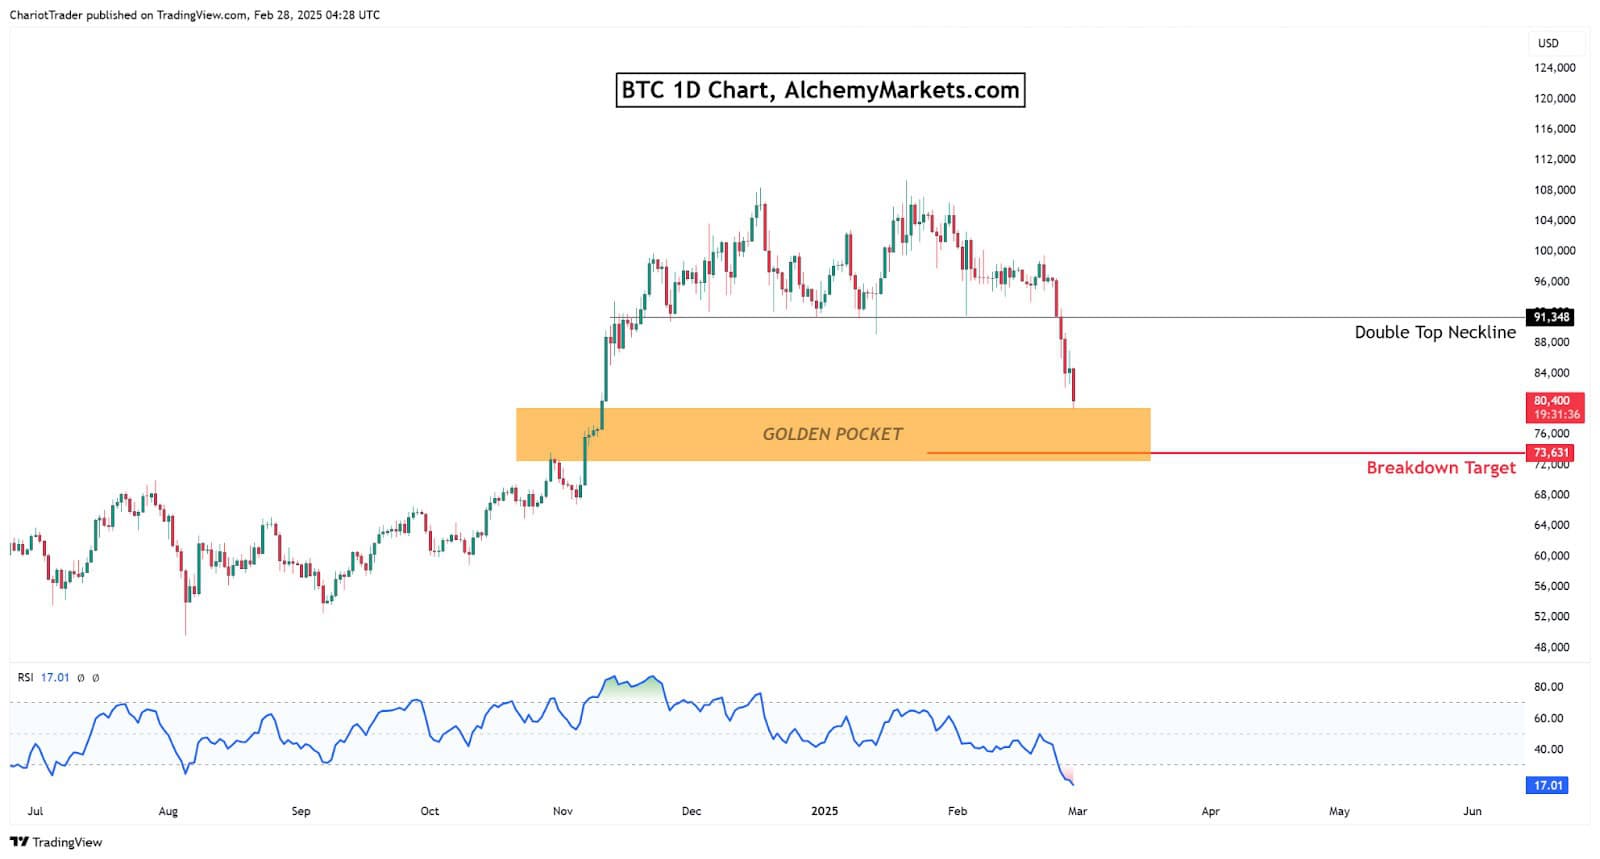
Alternatively, the Bitcoin chart could be experiencing a double top breakdown, which has a target of $73,631. This aligns with the golden pocket support zone, the area between the 50% and 61.80% Fibonacci Retracement.
The RSI has finally reached oversold levels, a point not reached since August 2024—indicating a healthy market reset.
USDT Dominance Chart At Critical Resistance
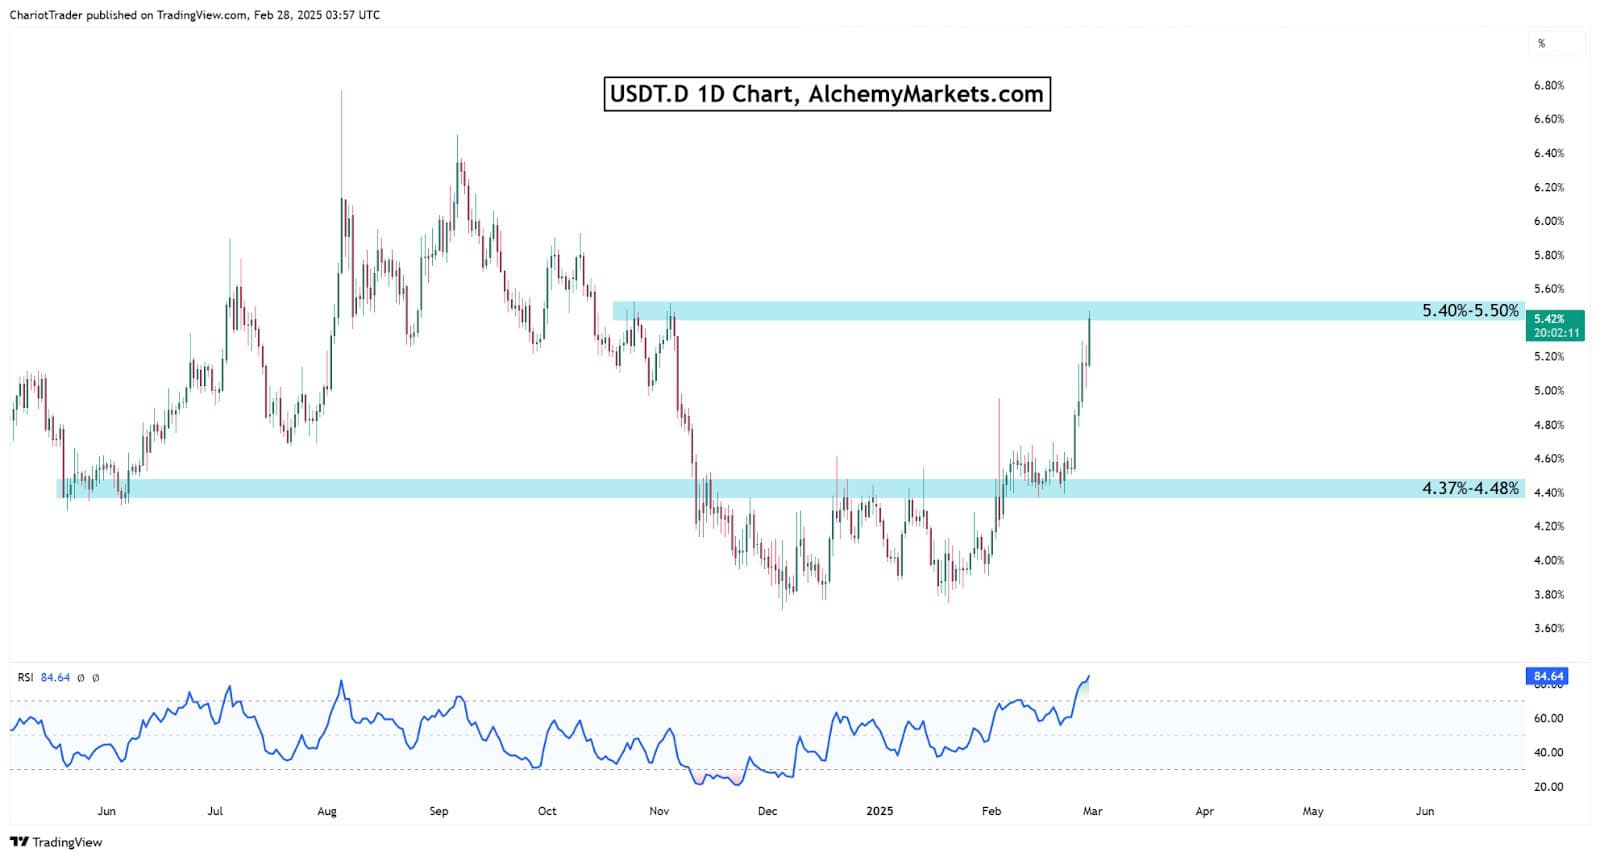
USDT.D is the USDT dominance chart, it reflects how much USDT market cap exists in the entire crypto market. Whenever USDT.D moves higher, it means investors are moving into USDT to seek safety (or derisk). Like the VIX, it inversely correlates with BTC.
Currently, the USDT.D chart is at critical resistances between 5.40% – 5.50%, where a rejection is highly likely. The RSI further reinforces this, as it is at overbought levels.
This rejection would in theory bump up the price of Bitcoin, unless that liquidity is flowing into alternative assets—which currently seems unlikely in the current crypto market.
Closing Thought
All and all, the VIX does suggest further upside is possible, which is going to put pressure on the S&P 500. If that happens, Bitcoin is likely going to decline along with the SPX. However, critical resistances are approaching for the inversely correlated indices (VIX and USDT.D), and critical support levels are just below for the SPX and BTC.
Both these indications suggest a bullish reversal on S&P and BTC is nearing.
- SPX tends to lead BTC price action.
- If S&P 500 is going to decline even further, Bitcoin will fall with it.
- VIX and USDT.D are at resistance, with VIX having further upside, and USDT.D being at critical resistance.
You may also be interested in: