Written by:

Reviewed by:

- December 15, 2024
- 24 min read
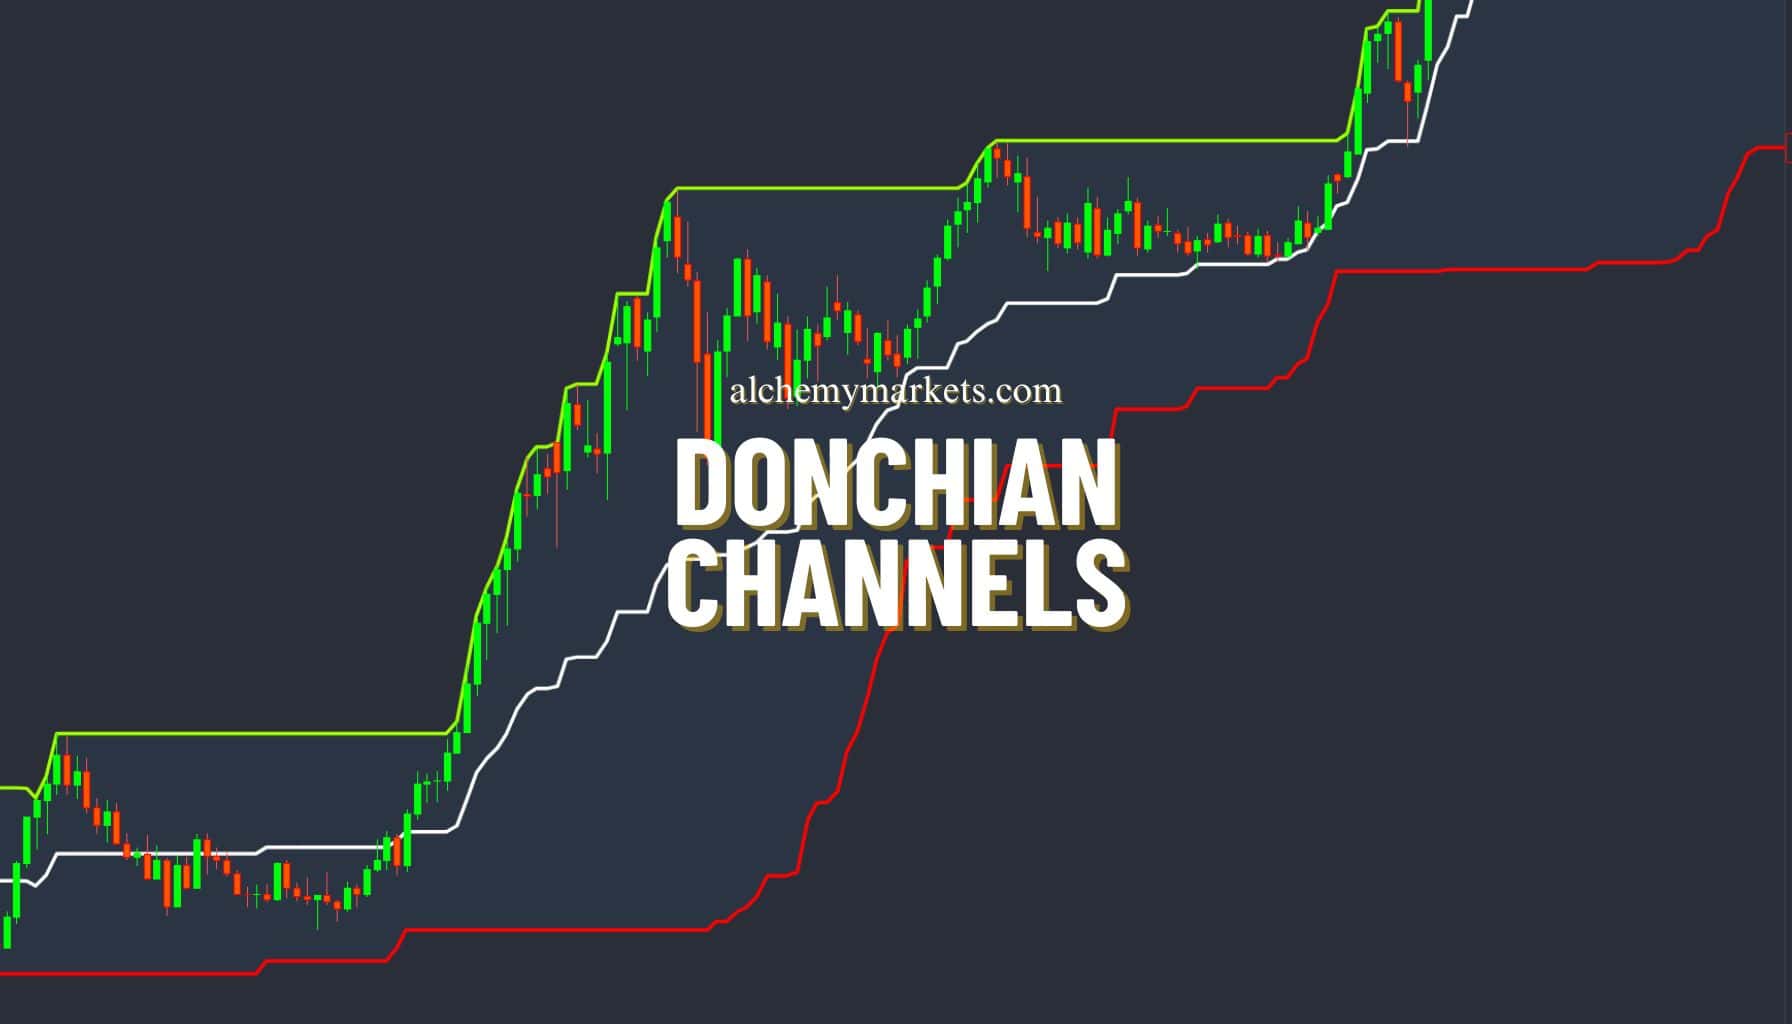
Donchian Channel Explained
What are Donchian Channels?
The Donchian Channel is a technical analysis indicator used by traders to identify the absolute highs, lows, and midpoint over a given period. Created by Richard Donchian, they are popular in trend-following strategies to catch large price movements.
By default, Donchian Channels track the last 20 bars or candles. So, on a daily timeframe, this indicator would visually display the highest, lowest, and midpoint prices over the past 20 days.
With its upper and lower bands, the Donchian Channels clearly visualise when a new high or low has been formed in the last 20 candles, making it an useful tool for various strategies.
What Do Donchian Channels Tell You?
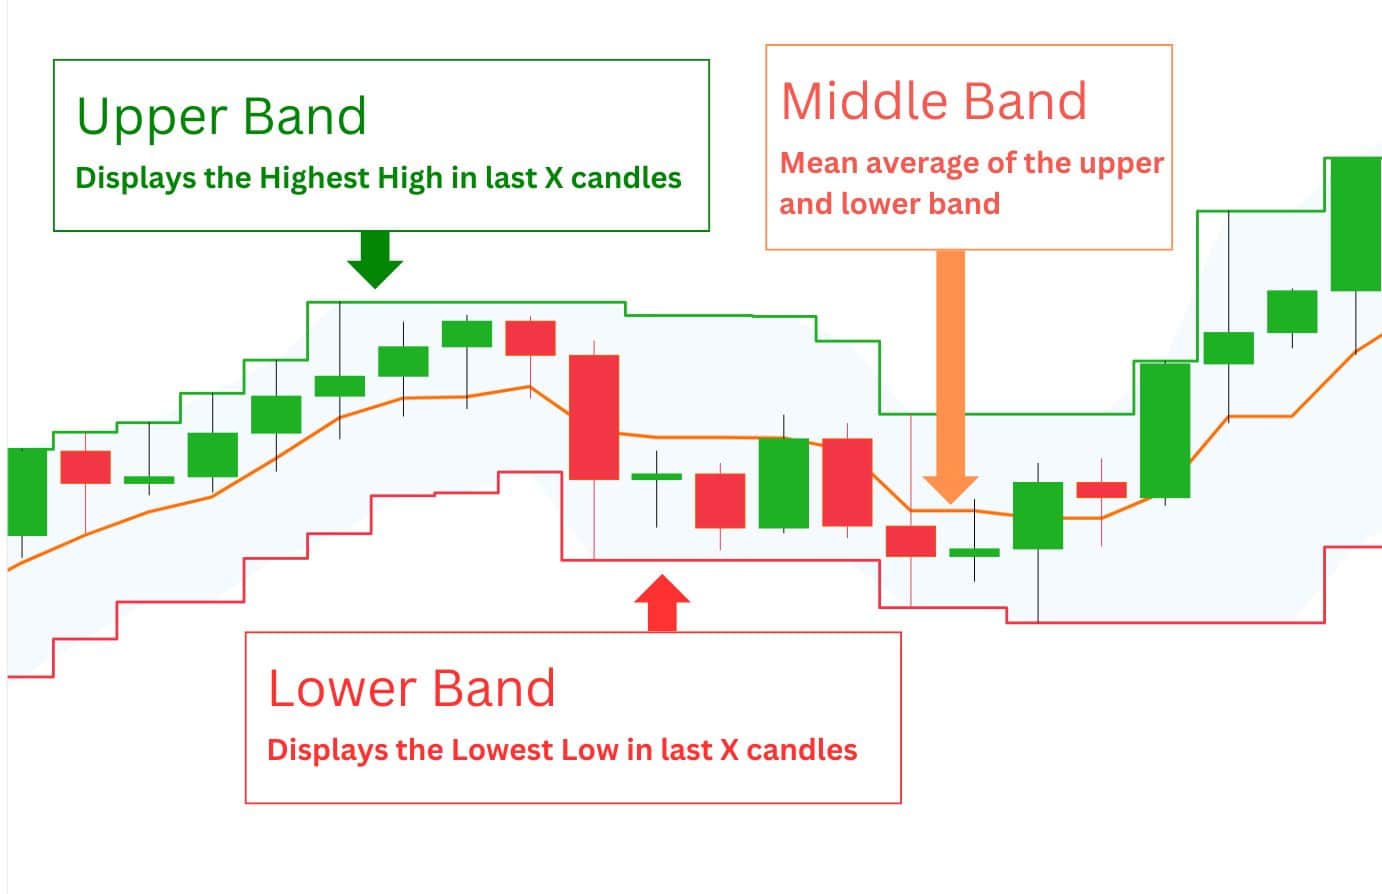
The key advantage of Donchian Channels is its ability to visually highlight when a new high or low has been formed within your chosen period:
- When the upper band moves higher, it signals that a new high has been set within X candles.
- When the lower band moves lower, it signals that a new low has been set within X candles.
The middle band, or middle line, represents the average between the highest and lowest prices. Unlike moving averages, there is no special smoothing calculation. So, the middle band simply takes the midpoint between the outer bands. Traders use this band for two purposes:
- As a trend filter: When the price is above the middle line, the asset is in an uptrend. When it is below the middle line, the asset is in a downtrend.
With the right strategic approach, Donchian Channels can help traders identify specific buy or sell signals.
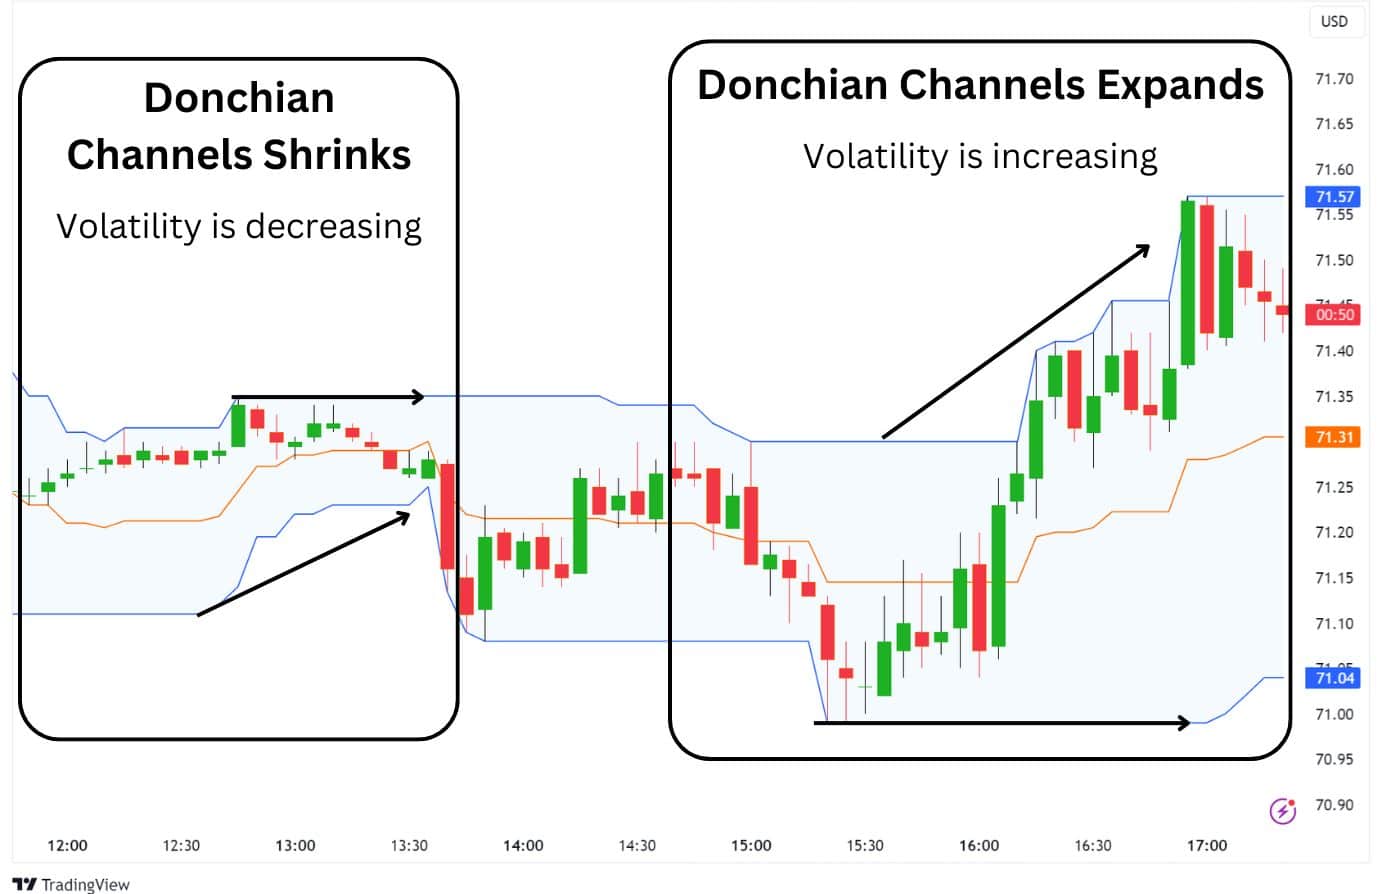
Assessing Volatility with the Donchian Channels
Additionally, the Donchian Channels can be used to assess market volatility. When the bands contract or distance between them shrink, it means that volatility is decreasing, indicating slowing momentum. This is noticeable during key economic news releases, like the Non-Farm Payrolls or when the CPI inflation has surprise readings.
Conversely, if the bands expand, it means volatility is increasing, indicating a potential new breakout is beginning. When the volatility is low, the price could be in a consolidation phase, which usually precedes a real breakout move.
Finding Support and Resistance Levels with Donchian Channels
The outer bands of the Donchian Channels tell us where the significant high and lows are in the past X candlesticks, making them a key support and resistance to watch.
Traders can use these highs or lows to trade reversals, should the price revisit these highs or lows. However, more astute traders will watch these areas for a potential breakout with the Donchian Channels.
Here is an example of how the Donchian Channels can identify support and resistances:
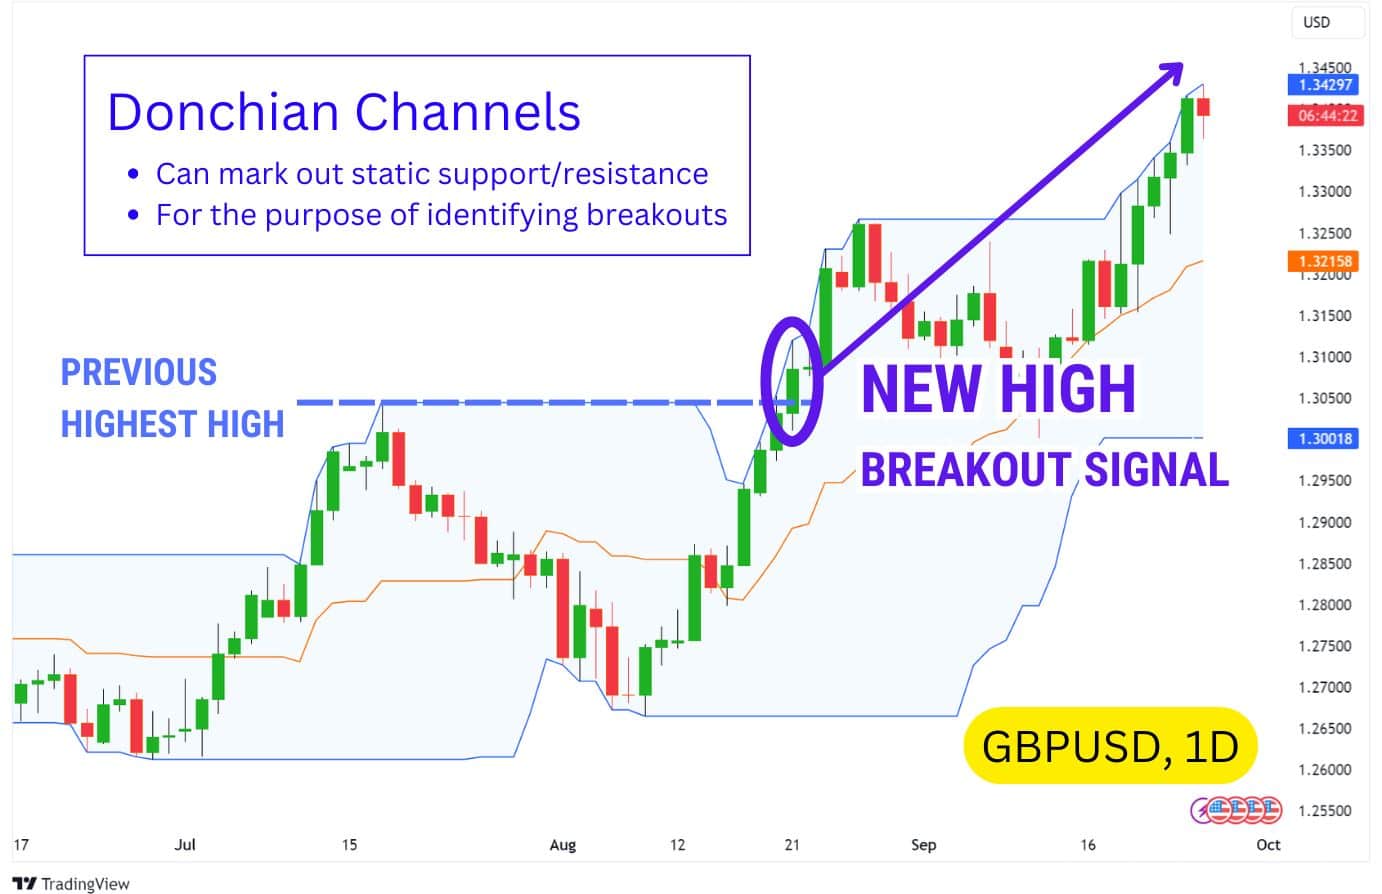
Identifying a Breakout with Donchian Channels
A breakout occurs when Donchian Channels mark a lowest low or highest high, and the price revisits that level, creating a higher high or lower low.
For example, in this USDSGD daily chart, the Donchian Channels hit a low around $1.345 SGD in May. By July, a new low at $1.340 signalled a potential breakdown, which later unfolded.
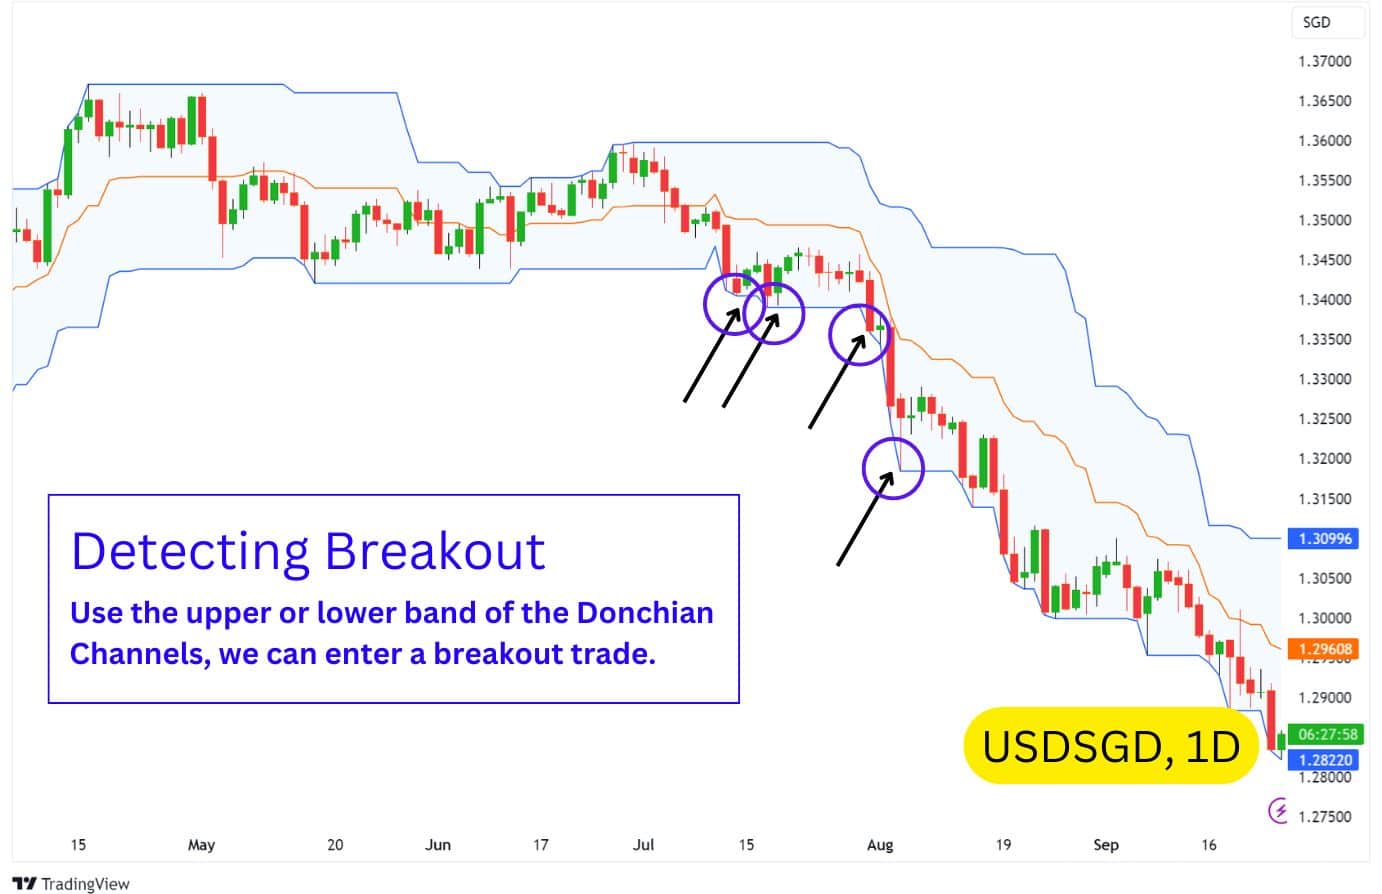
This method works because traders often buy at support and sell at resistance, following the classic “Buy Low, Sell High” principle. However, when price dips below support, stop losses are triggered, forcing more selling, which can lead to further price drops, forcing more stop losses and this cycle continues until all sellers are exhausted.
Donchian Channels are great for identifying potential breakouts due to this cascading effect that tends to happen when significant support or resistances are broken.
How Does the Donchian Strategy Work?
The Donchian Strategy works by identifying potential breakout signals whenever the price forms a new high, or a new low. The impact of a new high/low is stronger on higher chart time frames such as the 4-hour and daily timeframes, and therefore the Donchian Channel indicator is commonly used for swing trading.
The classic way of using the Donchian Strategy is to enter a buy or sell signal in the direction of the new high or new low, respectively. Then, you would use a trailing stop loss to follow the opposite band; exiting the trade when price taps into the band.
So, if you went long after the price taps the upper channel of the Donchian Channel, your stop loss would be the lower band of the Donchian Channel. Conversely, if you went short, the stop loss would be the upper channel.
An interesting and important note about Donchian Channels is that the indicator visualises the bands based on the absolute highest high or lowest low of the previous X number of candles.
This means the bands will always contain the price action, ensuring that candlesticks never close outside the Donchian Channels to signal a breakout. Instead, a breakout is indicated when the upper or lower band expands, reflecting a new high or low being formed, which marks the start of a potential trend.
Understanding this will be crucial to your execution of strategies when using the Donchian Channels. However, traders can also modify the Donchian Channel to indicate breakouts like Bollinger Bands®, if provided that their charting platform allows it.
How to Calculate Donchian Channels
Unlike Bollinger Bands or Exponential Moving Averages, Donchian Channels do not use any complex mathematical methods to calculate their middle line, upper band, and lower band. Instead, the Donchian Channel indicator identifies the highest high and lowest low over the last 20 candles or bars (or your custom time period) to define its upper and lower bands.
The middle line is then determined by simply taking the midpoint between the highest and lowest points, offering a straightforward visualisation of the channel. As new price data emerges, the channel automatically adjusts, expanding or contracting based on the current price extremes.
This simplicity makes Donchian Channels highly responsive to sudden price moves, helping traders quickly spot potential breakouts, reversals, or trend continuations.
Donchian Channels Example
To clearly demonstrate how the Donchian Channels work, we’ve set the length to calculate the highest high and lowest low over the last 5 candlesticks. Additionally, the bands are displayed in a step line format, making it easier to spot new highs and lows.
This example was on the AUDNZD Daily Chart, using a calculation length of 5 on the Donchian Channels.
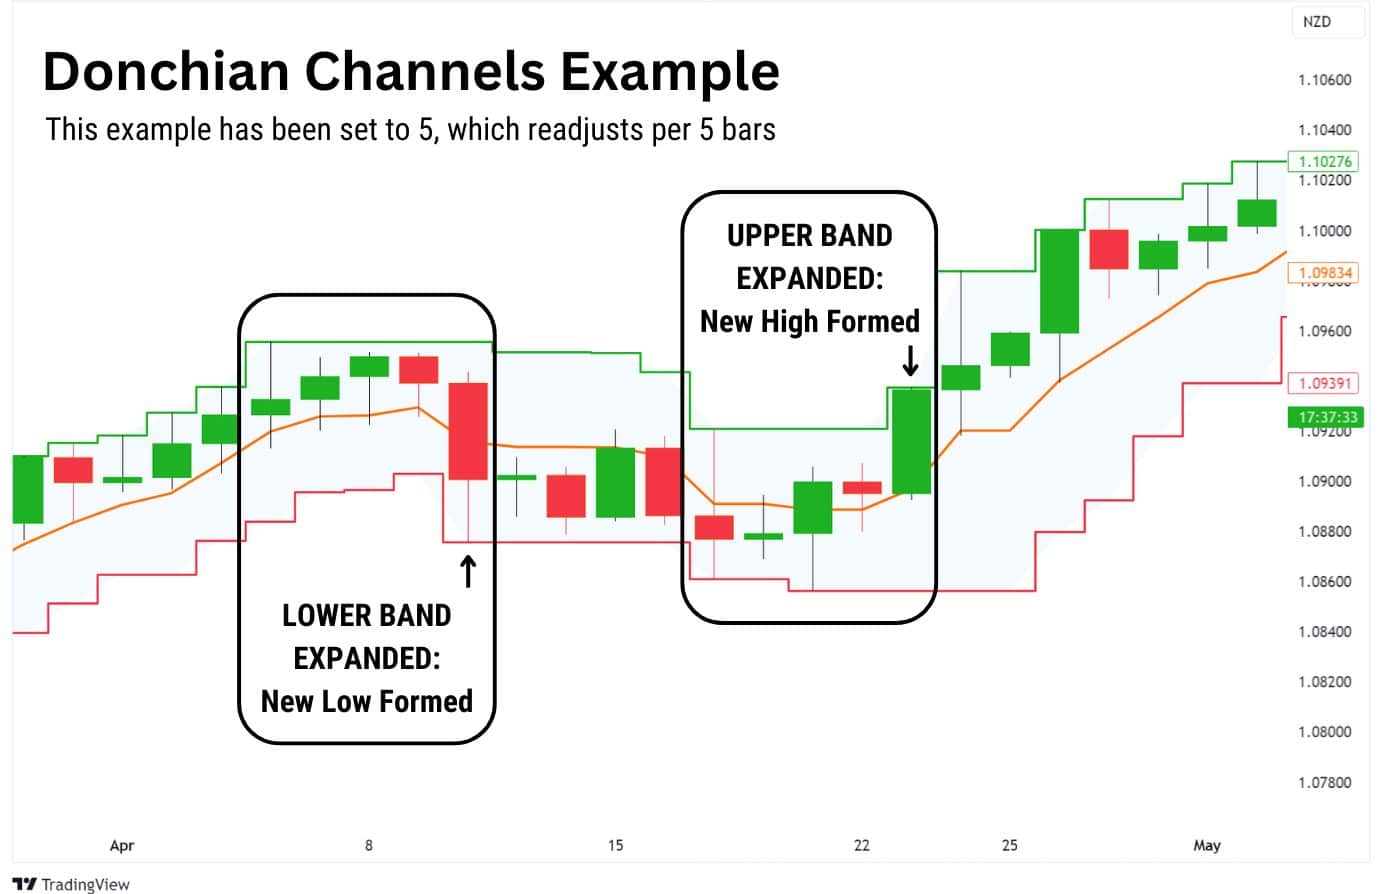
As highlighted in the boxes, you can see how the Donchian Channels track the 5 most recent candles to identify a new high, new low, and also middle price. Traders can use these insights as a signal to enter a breakout trade – or simply remark these levels as key levels of interest the next time price revisits it.
It should be noted that 5 trading days in traditional markets like forex, stocks, commodities, equals to a week’s price action – since the markets aren’t actively traded on the weekends.
However, the Donchian Channels are not a great tool for capturing a calendar’s week highs or lows because it is a ‘rolling’ 5 day review. So, on Tuesday, Donchian Channels would be figuring the highest high and lowest low from the previous Wednesday to Tuesday. Plus, public holidays and bank holidays in stocks are skipped.
Donchian Channel Formula
The Donchian Channel uses a simple approach to calculate its upper, lower, and middle bands. It identifies the highest and lowest prices within a defined calculation period, typically 20 candlesticks.
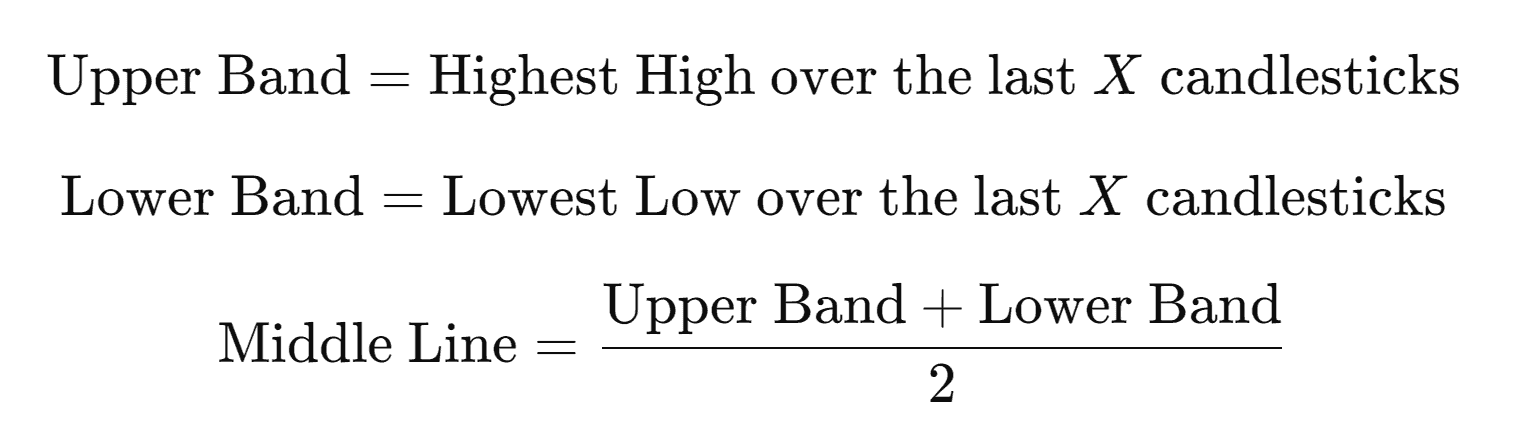
The Donchian Channel formula is straightforward and involves:
- Upper Band: The highest price over the last X candlesticks.
- Lower Band: The lowest price over the last X candlesticks.
- Middle Line: The average of the upper and lower band.
The middle line takes the mean average price of the highest and lowest prices, which would be calculated like so:
Donchian Channels Trading Strategies
Richard Donchian, the creator of the Donchian Channels, designed this indicator with a breakout system in mind. It was built to help traders identify key moments when price breaks out of a defined range, signalling the start of significant price movements.
Donchian believed that trading success came from capturing large, directional moves rather than relying on frequent small wins. As such, many of the strategies here will have an emphasis on trading breakouts, and share similar principles for finding entries and exits.
As with any strategy, there can be false signals. Breakout strategies tend to follow through when the market is trending or volatile. When the market conditions are quiet, then false signals tend to be more frequent.
Let’s begin.
Donchian Channels Breakout Trading Strategy
The channel breakout strategy was Richard Donchian’s original breakout strategy, often referred to as System 1 and System 2. The Donchian Channel breakout revolves around simple rules for entering and exiting trades based on new highs and lows.
Both of these systems involve entering trades when the price breaks out to a new high or low, which signals the possible start of a new trend.
Traders enter a long position when the price breaks above the upper band, or a short position when the price breaks below the lower band. Then, when the price moves against their trade direction and touches the opposite band, the position is closed.
These simple, yet effective, entry points help traders capture major market movements.
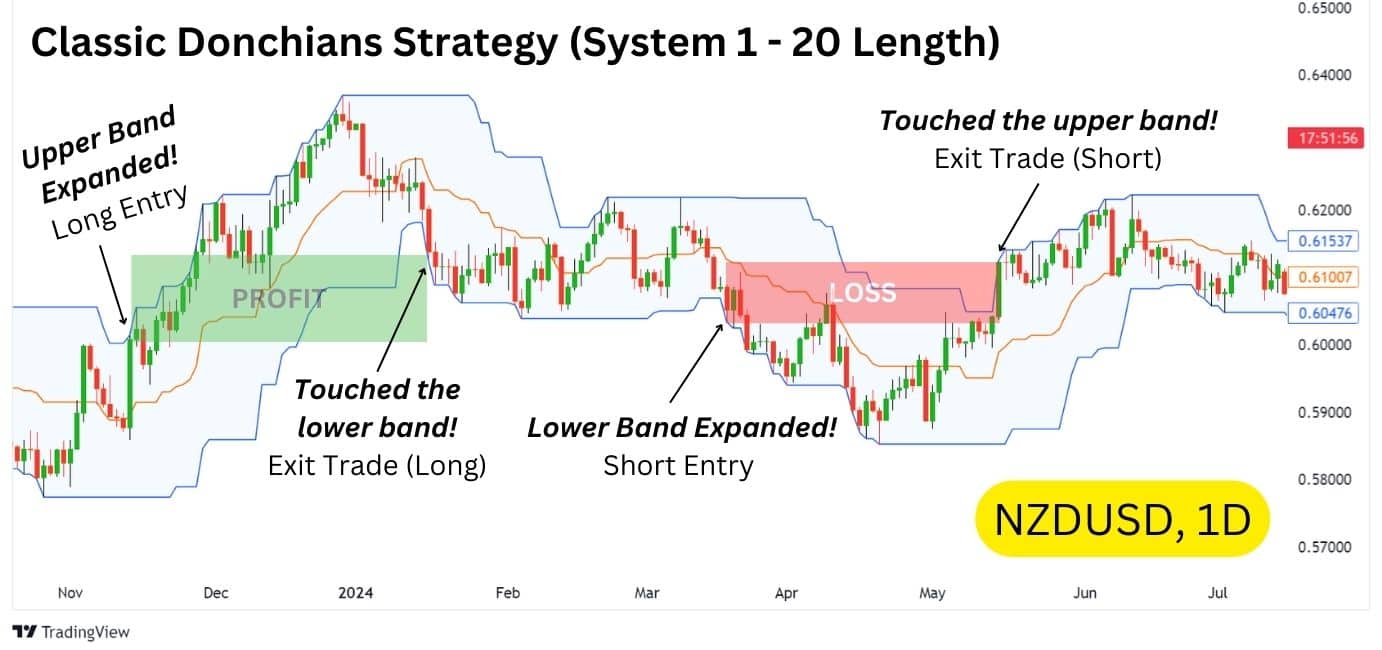
System 1: 20-Day Donchian Breakout
For System 1, Richard Donchian suggested using the 20-Day calculation period. This system is better suited for catching quicker breakouts and shorter trend shifts.
System 2: 55-Day Donchian Breakout
For System 2, Richard Donchian suggested using a 55-Day calculation period. This setting is better suited for capturing longer, sustained trends, which may result in slower exit signals, and leading to potentially larger gains and larger losses.
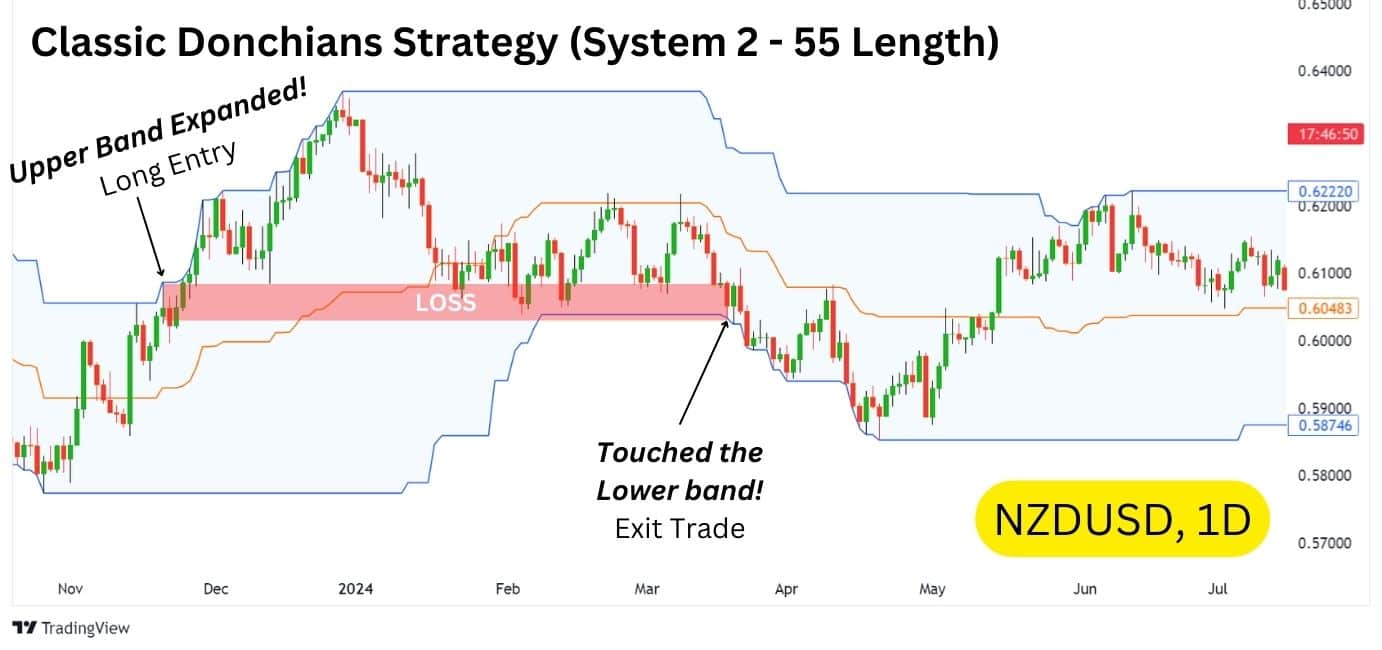
At first glance, System 2 may appear to be weaker than System 1, but as Richard Donchian proposed, the 55-Day is better at capturing long terms compared to 20-Day Donchian Channel.
Here we can see that in action with XAUUSD, the Gold price chart on the daily timeframe:
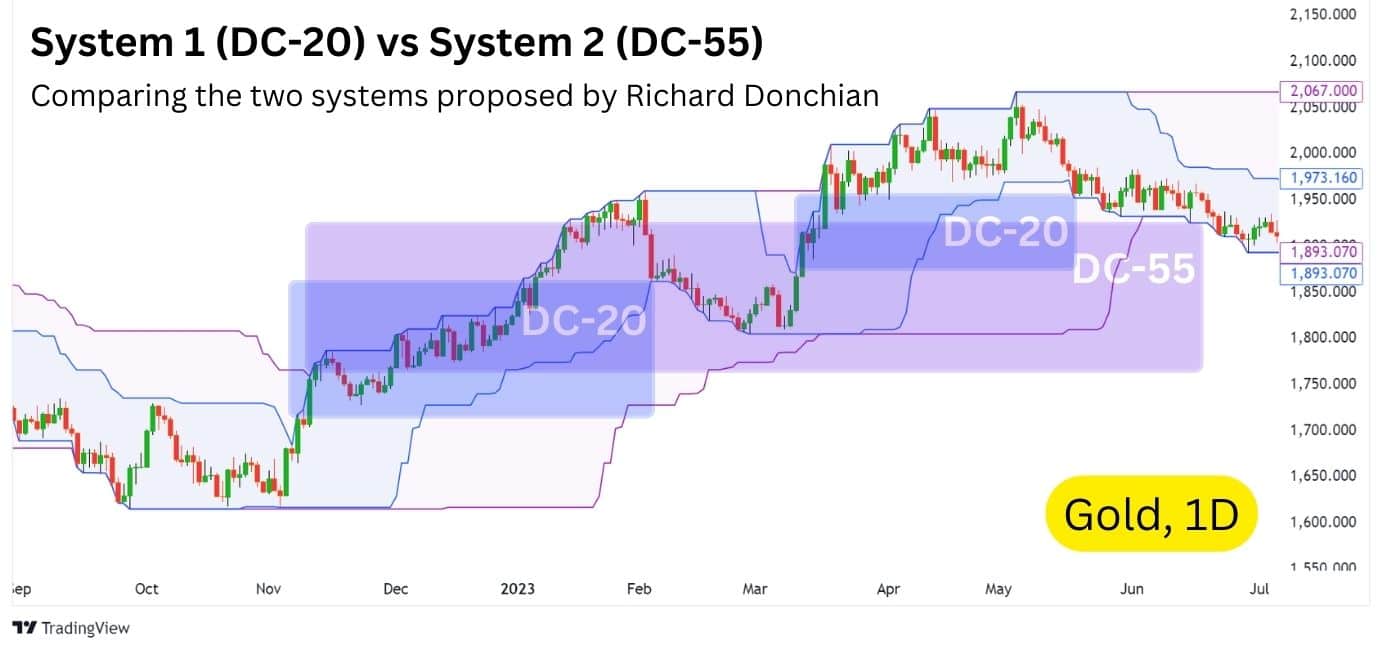
Due to its lower frequency for signals, the 55-Day Donchian Channel strategy may also be easier to execute as it requires less monitoring; suiting the needs of traders with a busy life schedule.
However, both systems share the significant weakness of having a potentially wide stop loss as the strategy is applied to the daily chart time frame. Also, frequent false signals may appear creating a low win rate. This increases downside risk and can reduce the overall profitability of the strategy, especially in non-trending markets.
Due to these drawbacks, many traders have modified the classic Donchian Channels strategy to create more efficient ways of using the indicator, balancing risk management with trend-following.
Trend Following Trade
The Donchian Channel is an indicator designed for trend following trades. This means that it aims to capture the majority of a trending move, and exit when the trend flips. Although this usually means the trader will not capture the exact low or exact high of a move, it increases the probability that traders will still be able to make some gains from an explosive, trending move.
Donchian Channels Bullish Approach
When traders have a bullish bias due to a technical factor, or global news, they can use the Donchian Channels to enter a long position. Then, when the price touches the lower band, we exit the trade immediately, making the lower band of the Donchian Channel a trailing stop loss. Usually, this would be done with a 4 hour or daily chart time frame and Donchian Channel, which is more adept at capturing mid to long term trends.
Let’s apply this approach to Copper during September 2024…
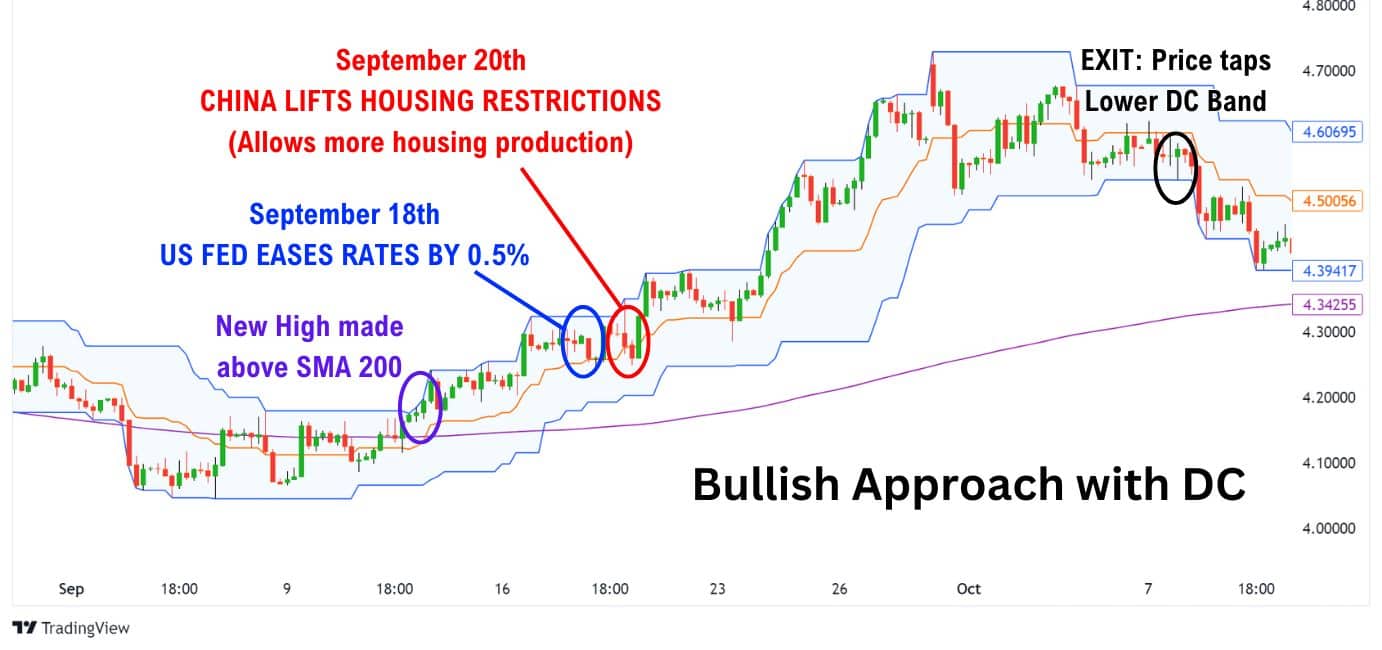
Here, we can see that Copper is above the 200 SMA which indicates an uptrend. Additionally, the Federal Reserve eased on interest rates on September 18th, while China announced a lift on housing restrictions on September 20th. Combined, these factors indicate a bullish bias for risk-on assets such as Copper. Using the Donchian Channels, traders can enter a trend following trade with a solid long entry and exit.
Donchian Channels Bearish Approach
For traders with a bearish bias, the Donchian Channels works in reverse. We would enter a short position when the price touches the lower band, then exit at when price revisits the upper band. The bearish bias can be established with a trend indicator, market structure, or global news.
Let’s apply this approach to Copper during July 2024…
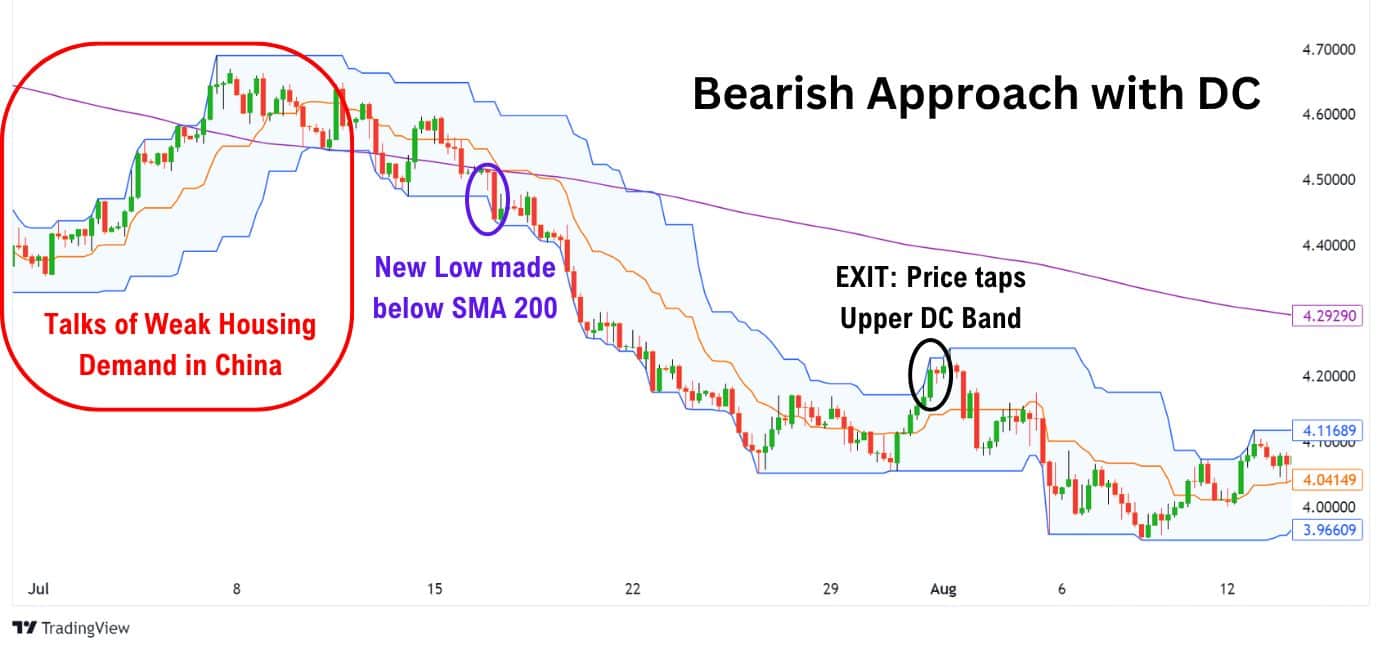
In this example, Copper is in a downtrend according to the 200 SMA moving average. Additionally, talks of a weak housing demand in China during early July contribute to a bearish bias. Using the Donchian Channels, traders can once again trade their bias by finding a solid short entry into a trend following trade.
Donchian Channels Reversal Trading Strategy
Unlike the Bollinger Bands or Keltner Channels which highlight possible reversal points with their upper and lower bands, the Donchian Channels simply paint the lowest low, or highest high within a period of time. The DC does not indicate where a possible reversal could occur, making it ineffective for pinpointing the exact pivot low or pivot high for trading reversals.
However, traders can use Donchian’s ability to indicate a potential breakout to confirm a reversal in the overarching trend’s direction. To do this, we can use a momentum indicator such as the RSI to look for a bullish or bearish divergence, which would indicate a reversal.
- Bullish RSI Divergence: When the price forms lower lows, but the RSI forms higher lows.
- Bearish RSI Divergence: When the price forms higher highs, but the RSI forms lower highs.
Then, using a moving average such as the 200 simple moving average, we can easily find the overarching trend of the price – as the 200 SMA marks the average price of an asset across 200 candles.
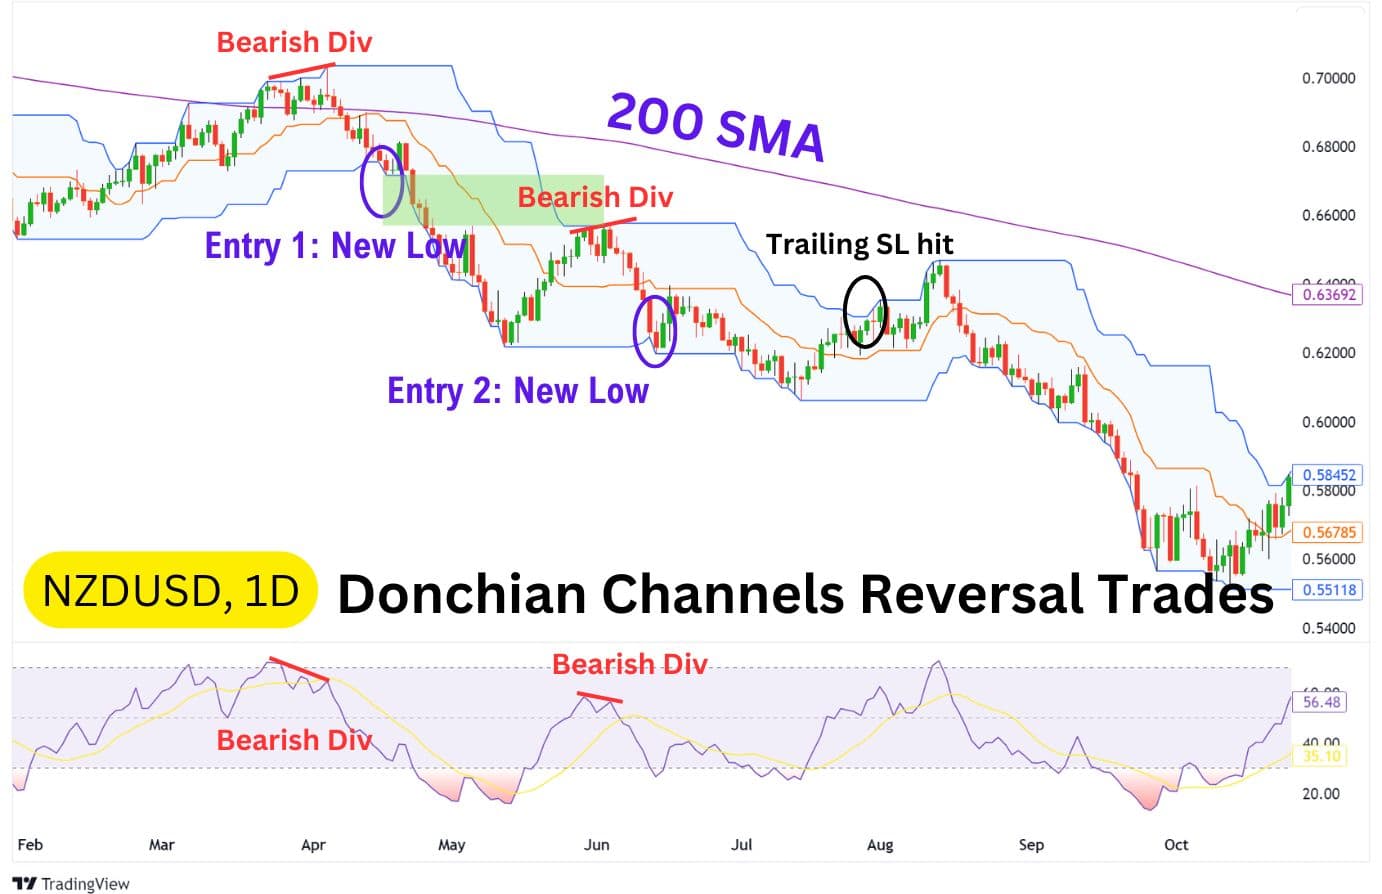
As you can see from the NZDUSD Daily Chart example, the Donchian Channels aren’t very good for trading reversals. Most times, the reversal would have played out by the time the Donchian Channel signals an entry.
Effectively using this strategy would require more optimisation on several factors, such as:
- The Donchian Channel’s length.
- The reversal detection method, which can range from candlestick formations to RSI divergences.
- Another way of defining the trailing stop loss, or even considering a fixed stop loss.
Overall, the Donchian Channels are still more suited for trading breakouts, whereas other channel type indicators such as the Bollinger Bands or Keltner Channel, may be better for trading reversals.
Double Channel Trading Strategy
This strategy is suitable for swing trading which means it can be applied to the 4-hour, daily, or higher chart time frames.
The Double Donchian Channel trading strategy utilises two Donchian Channels: one to determine breakout trade entries, and the other to provide quicker exits when the market reverses. Two popular combinations are 20 and 10, and 55 and 20 Donchian Channels.
The principles for entries and exits follow the same rules as the Classic Breakout Strategy, with the shorter Donchian Channel providing quicker exit points.
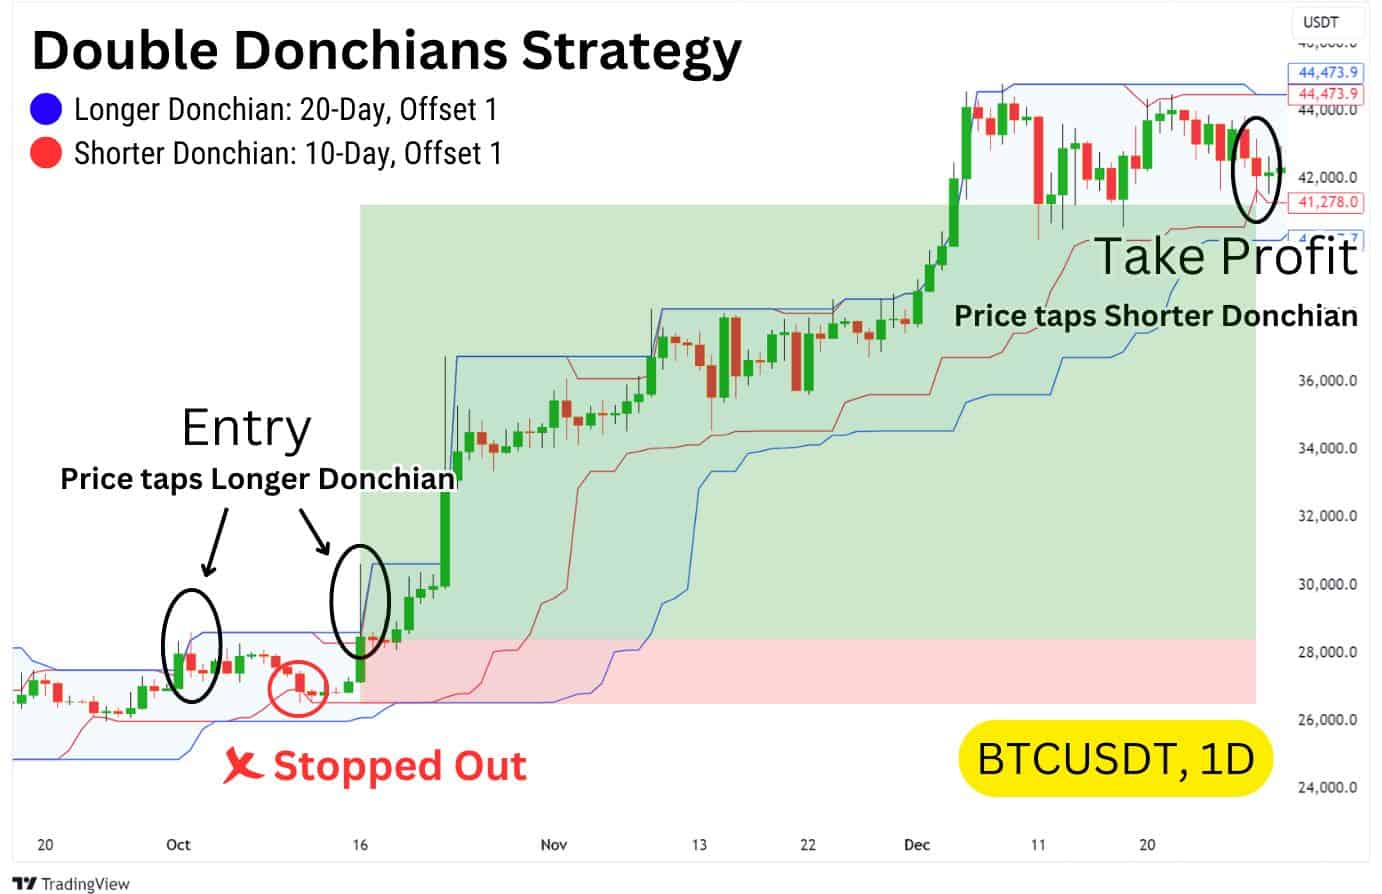
In our example on Bitcoin, we will be using the 20-length Donchian Channels to find entries, and the 10-length Channel to find exits.
Here’s how it works:
- Setup the Donchian Channels:
- Add two Donchian Channels to your chart: one with a longer period (e.g., 20) and one with a shorter period (e.g., 10).
- Remove the basis or middle line on both Donchian Channels.
- Enter the Trade:
- Enter a long trade when the price touches or breaks above the upper band of the longer Donchian Channel.
- Enter a short trade when the price touches or breaks below the lower band of the longer Donchian Channel.
- Manage the Exit:
- Use the opposite band of the shorter Donchian Channel as your trailing stop loss.
- For a long position: Set your stop loss at the lower band of the shorter Donchian Channel.
- For a short position: Set your stop loss at the upper band of the shorter Donchian Channel.
As the price moves in your favour, adjust the stop loss according to the shorter Donchian Channel to secure profits while staying in the trend.
Donchian Channels Trading with Moving Averages
This strategy is suitable for swing trading (4H, Daily, or higher timeframes).
Moving averages can complement the Donchian Channel indicator as a trend filter. When the price is above the moving average, it indicates an uptrend, and when it’s below, it signals a downtrend. Using a trend filter, we will only take trades that favour the broader trend’s direction.
One effective strategy is to combine a 200 Simple Moving Average (SMA) to scope out the broader trend, with the Double Donchian Strategy mentioned earlier.
Here is an example of the SMA acting as a trend filter for the Double Donchian Strategy:
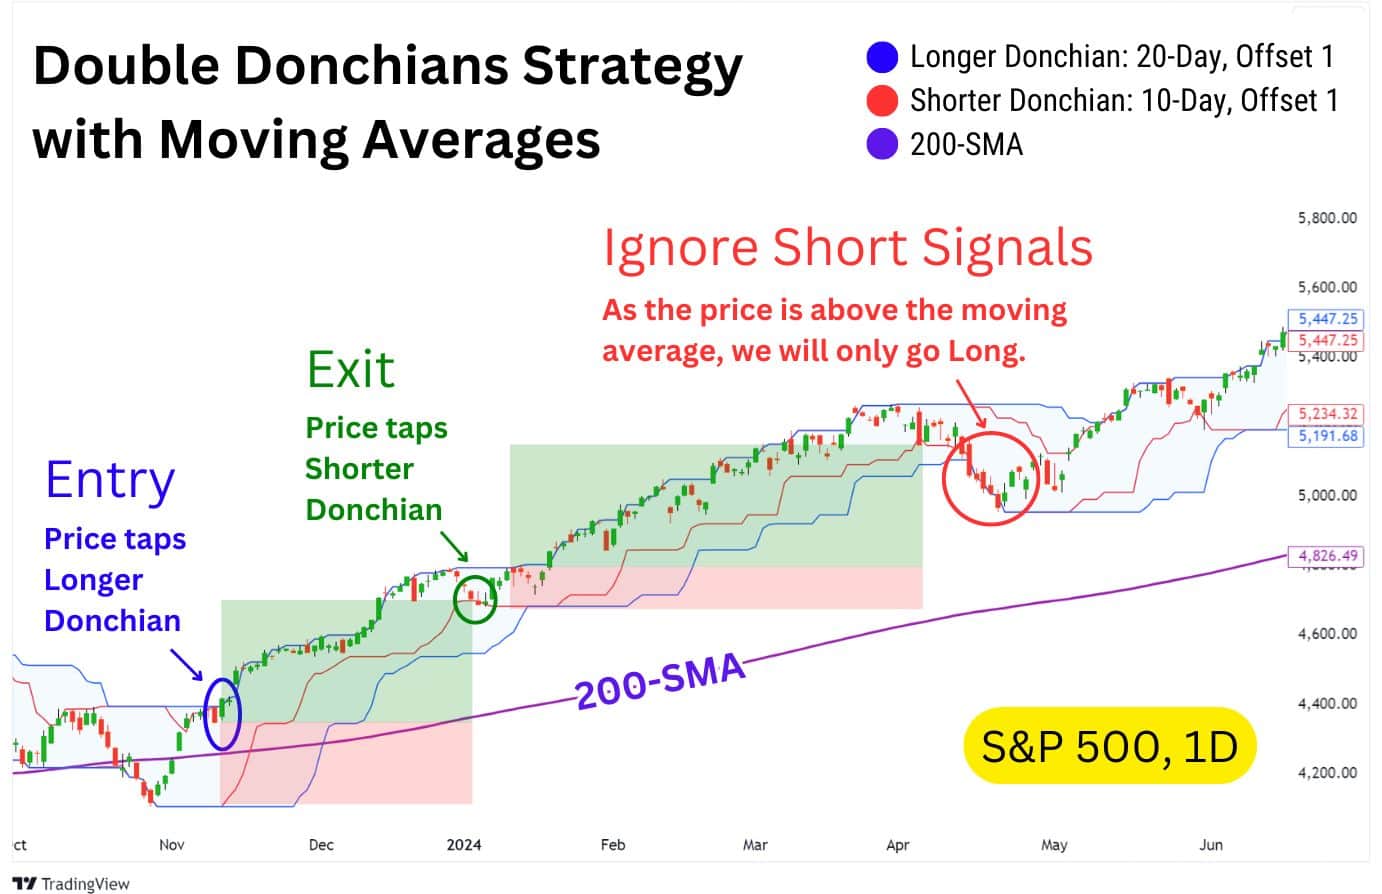
As you can see from the red-circled section above, the signals to enter a short trade (Sell) were filtered out by the 200-SMA.
Since the price is above the 200-SMA, only long signals would be taken and any short sell signals from the Double Donchian Strategy are considered invalid. Conversely, if the price were below the 200-SMA, any long (Buy) signals would also be invalid, and we would focus solely on short trades instead.
For a refresher on how the Double Donchian Strategy works, refer to the previous section.
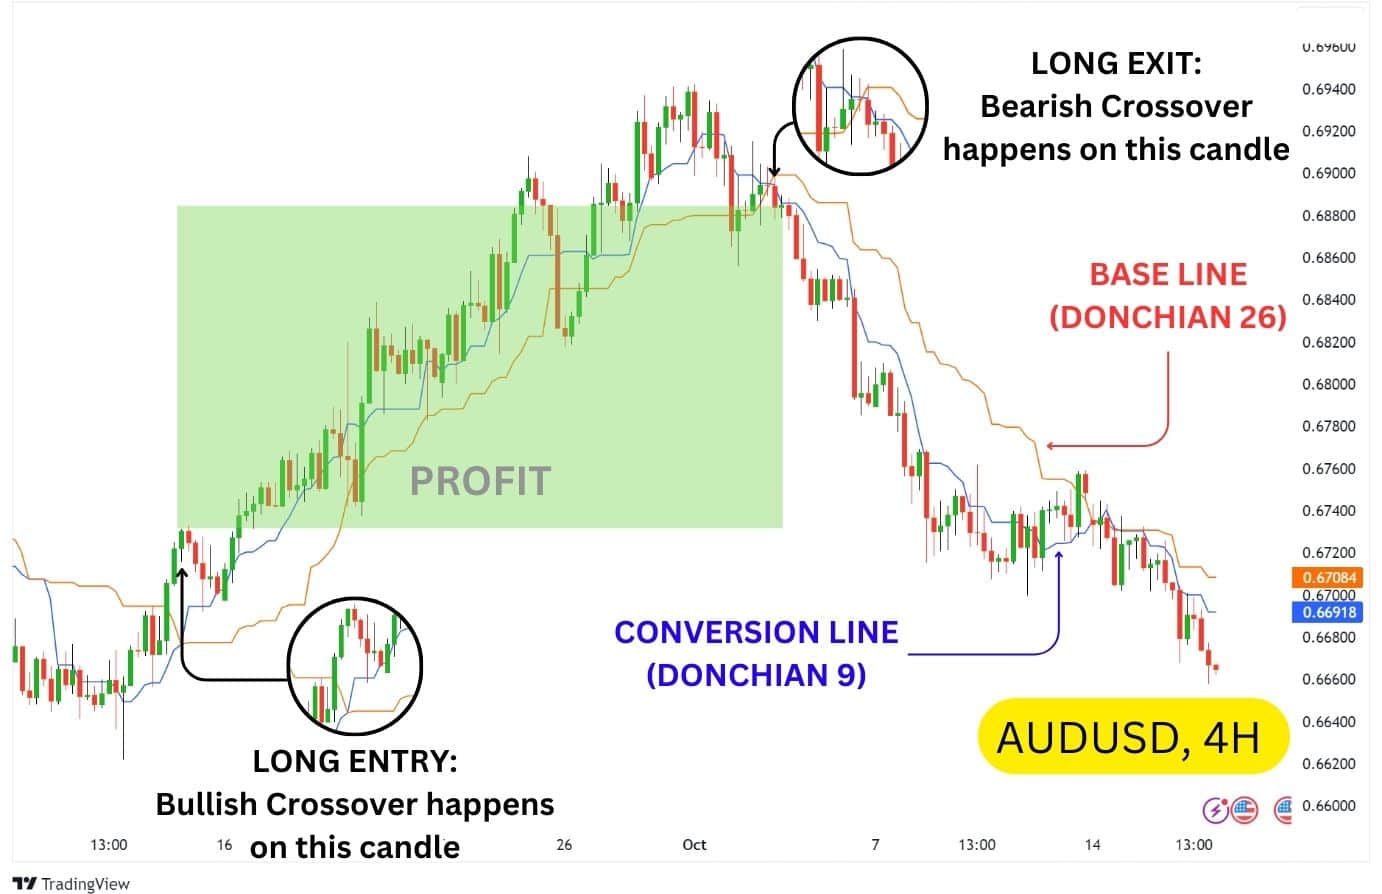
Trading the Middle Band
The middle band shows the average price between the highest high and lowest low over X periods. Some traders will use this median band as a dynamic support and resistance.
However, this is uncommon as the main focus of Donchian Channel strategies lie in the outer bands, which provide entry and exit signals for trend following trades.
Interestingly, the Donchian Channel middle band resembles elements of the Ichimoku Cloud indicator, which confirms trends, identifies support/resistance, and signals entry/exit opportunities. With the right settings, the median band can mimic the positioning of the Base Line and Conversion Line in Ichimoku, highlighting its potential as a versatile tool in analysis.
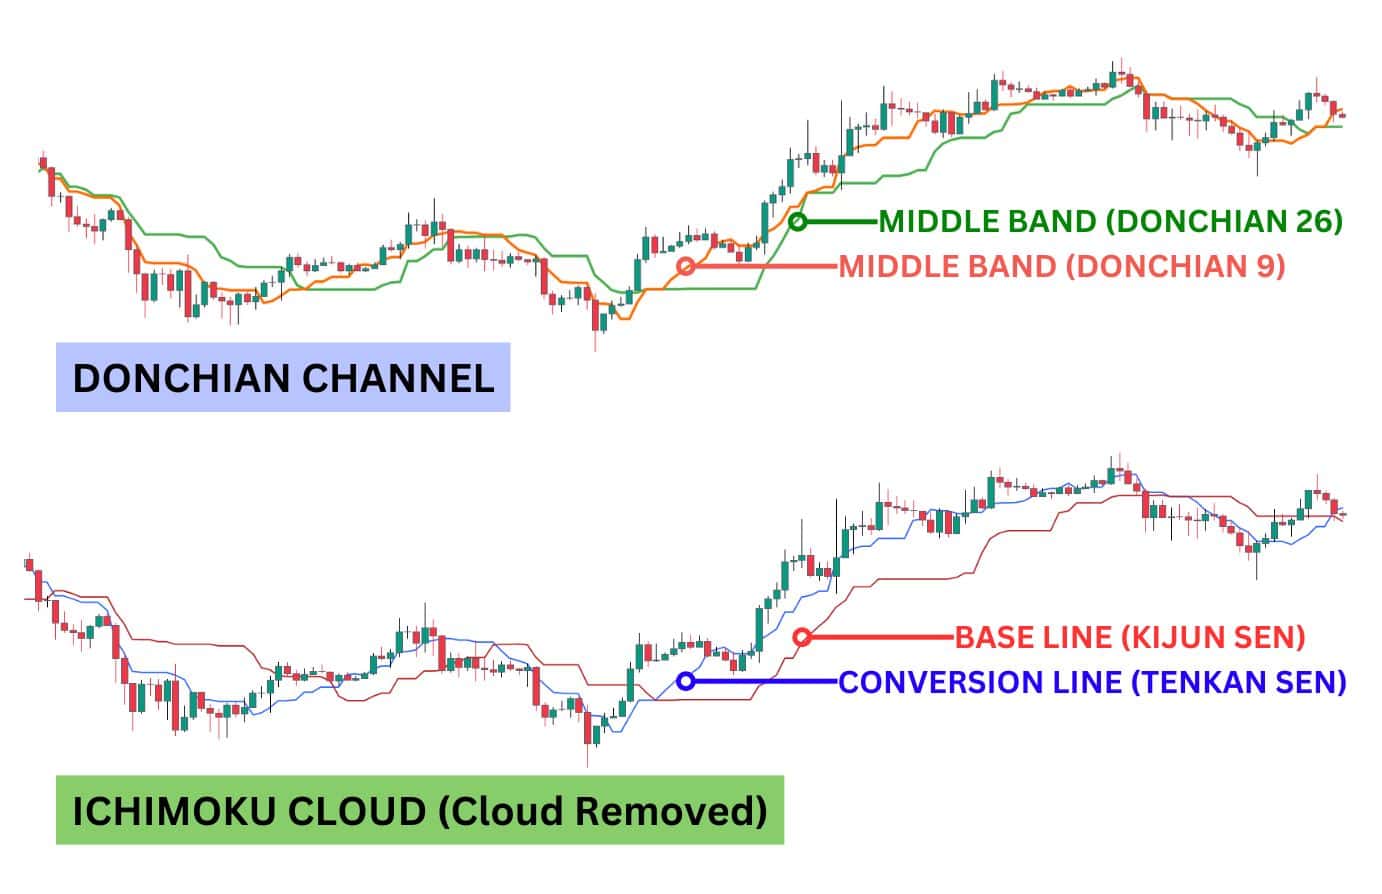
Let’s examine how each of these lines work:
| Base Line Purpose: Also known as the Kijun Sen, the base line is used to tell mid-term trends. When price is above the Kijun Sen, the price is mid term bullish. When it’s below, the price is mid term bearish. Donchian Channel Settings: Set your donchian channel to 26 and the middle line will act as the Kijun Sen / Base Line. |
| Conversion Line Purpose: Also known as the Tenkan Sen, the conversion line is used to tell short-term trends. When price is above the Tenkan Sen, the price is short term bullish. When it’s below, the price is short term bearish. Donchian Channel Settings: Set your donchian channel to 9 and the middle line will act as the Tenkan Sen / Conversion Line. |
| Common Strategy with Conversion / Base Line Similar to an EMA crossover, some traders use the crossover of the Conversion Line (Tenkan-sen) over the Base Line (Kijun-sen) as an indication of a short-term trend shift. When the Conversion Line crosses above the Base Line, it suggests a potential bullish trend.When it crosses below, it signals a bearish trend, offering a clear entry or exit signal. |
Using this approach, traders can apply the middle bands of two Donchian Channels to mimic the Ichimoku crossover strategy, ignoring the outer bands altogether.
While this is no doubt a viable strategy, it’s often simpler and more efficient to use Ichimoku Cloud strategies, as it requires less manual setup – as opposed to using Donchian Channels to replicate similar signals.
Donchian Channels: Trading with Volume
Another method of making the Donchian Channel signals more reliable is to pair it with trading volume. Volume can often tell us if a breakout move is authentic or not – however, volume can sometimes be tricky as it can remain low as the price grinds higher.
This makes volume more usable on moderately low timeframes, such as the 1-hour or 30-minute timeframe. On these timeframes, significant bursts in volume can be spotted more easily, and with a Volume Moving Average (VMA) enabled, traders can easily identify significant moves.
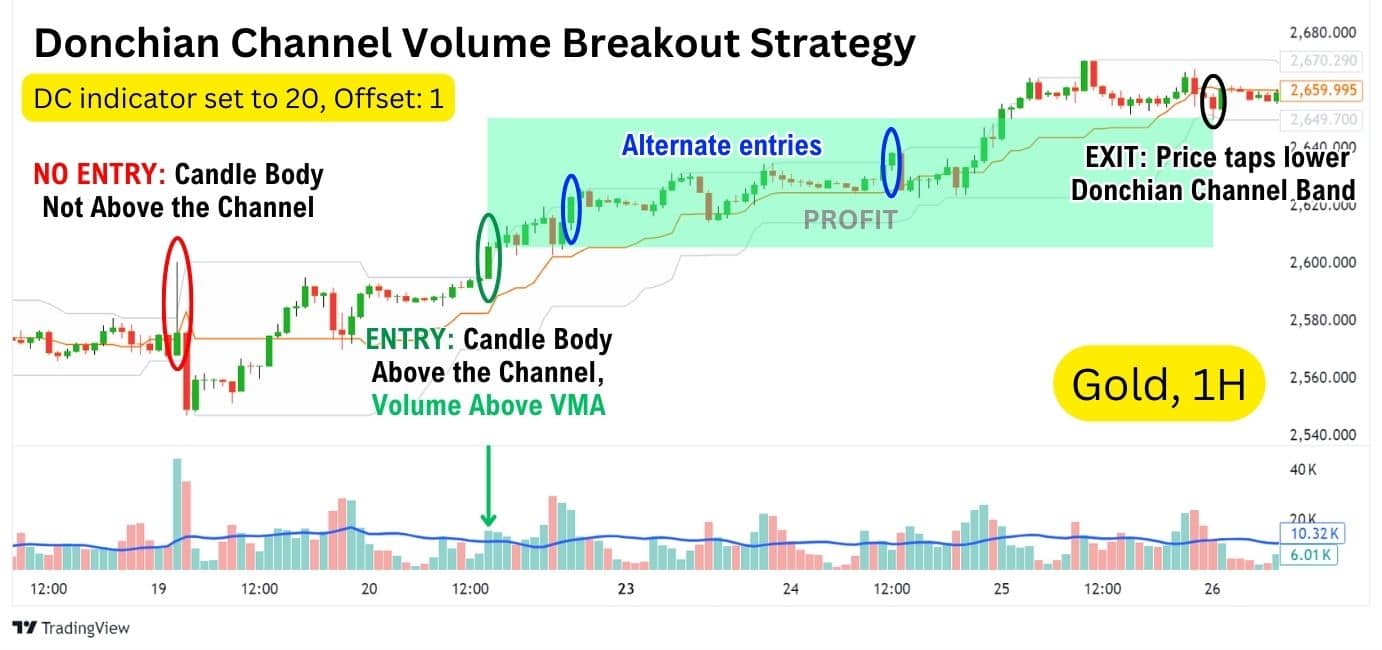
In the example above, we have the Gold 1-hour chart with the following settings:
- Donchian Channels set to 20 with offset 1
- Volume indicator with a VMA Displayed as the Blue Line
Then, a trader would follow these executional steps to take a trade:
- Go Long when: A candlestick has its body (closing price) above the upper band, and volume is above the VMA. Take profit at the lower band.
- Go Short when: A candlestick closes its body below the lower band, and volume is above the VMA. Take profit at the upper band.
This setup makes it easy to identify when a candlestick has clearly closed outside of its outer lines, which implies further breakout continuation. Then, check the volume as an additional filter – if the “Breakout” candle’s volume is above average, this increases the probability of a further move in the breakout direction.
Donchian Channels Trading with Relative Strength Index (RSI)
For traders who have used the Relative Strength Index, or RSI indicator, you may understand that the RSI divergence is a powerful reversal signal that can sometimes accurately predict a large reversal. However, there are also many times where the RSI divergence simply results in a small reversal before the markets resume in their original trend.
By using the Donchian Channels to identify trend shifts, RSI divergence traders can more confidently identify large breakout reversals, then exit at an appropriate time.
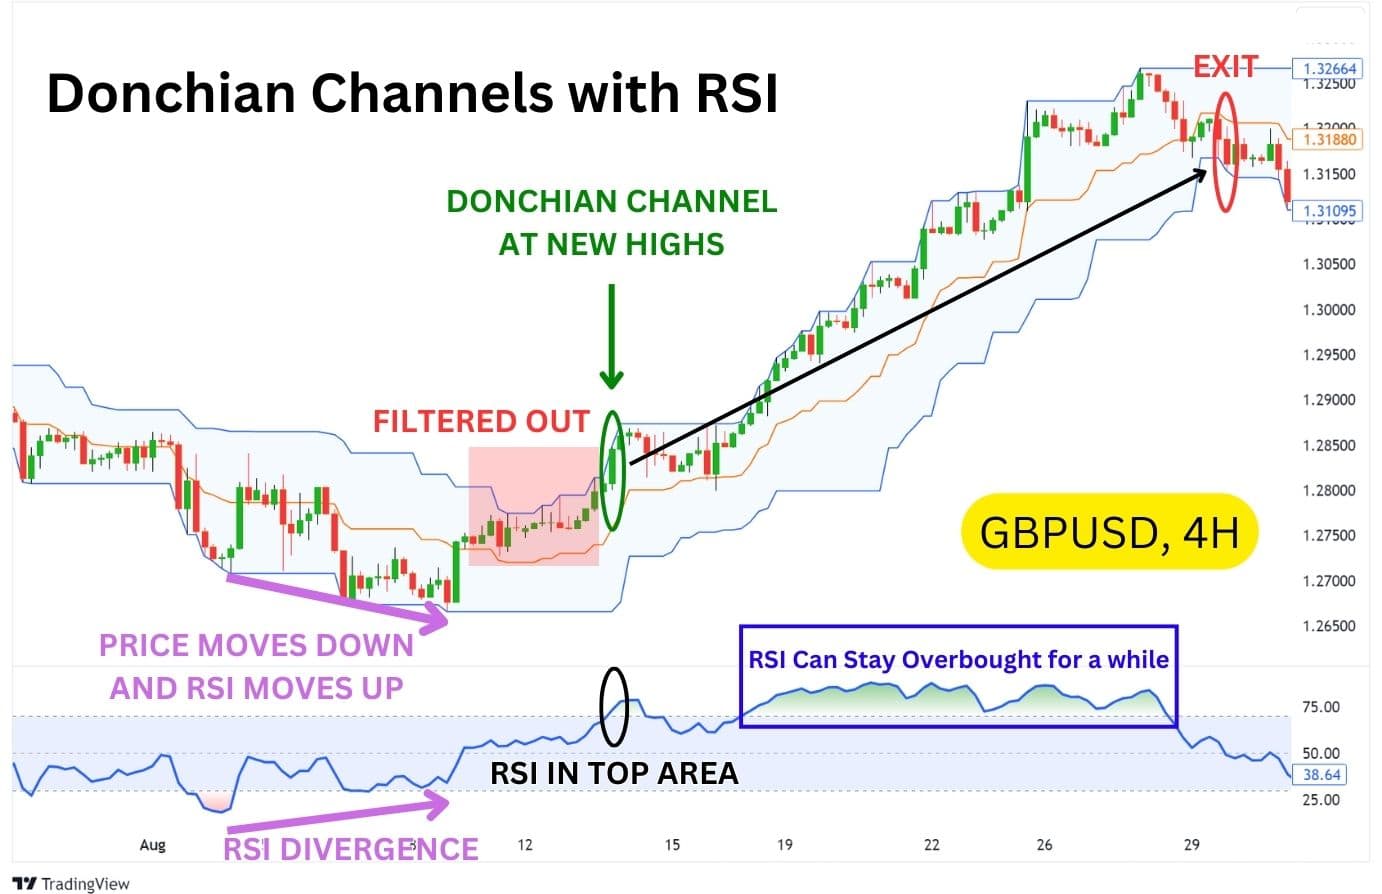
Here’s how it works:
- Use the RSI indicator to detect a divergence.
- Bullish divergences occur when price is forming lower lows, but RSI forms higher lows.
- Bearish divergences occur when price is forming higher highs, but RSI forms lower highs.
- Then, after an RSI divergence occurs, watch for the price to create a new high with the Donchian Channels (set at 20-length).
- If a new high does occur, and it breaks the previous highs with a candle body close AND the RSI is in the top area (Over 70), enter a long position.
- Exit your trade when the price taps the lower Donchian Channel band.
Notice how with this setup, a lot of false signals or weak breakout signals are filtered out, allowing the trader to only enter a trade when a true breakout is more probable.
One key factor to note here is that the RSI being over 70 technically puts the price into an “Overbought” market state, but – it’s important to remember that prices can remain overbought for a significant amount of time. In our GBPUSD example, the price was overbought for a whopping two weeks!
Donchian Channels Trading with Moving Average Convergence Divergence (MACD)
Similarly to using the RSI with the Donchian Channels, the MACD indicator can act as an additional filter to the classic Donchian System 1 breakout strategy.
This setup is simple:
- Go long when the MACD histogram prints a larger green bar than the previous bar, look for breakouts at the upper channel.
- Go short when the MACD histogram prints a larger red bar than the previous bar, look for breakouts at the lower channel.
Here’s what it looks like on USDJPY, 15 minute timeframe:
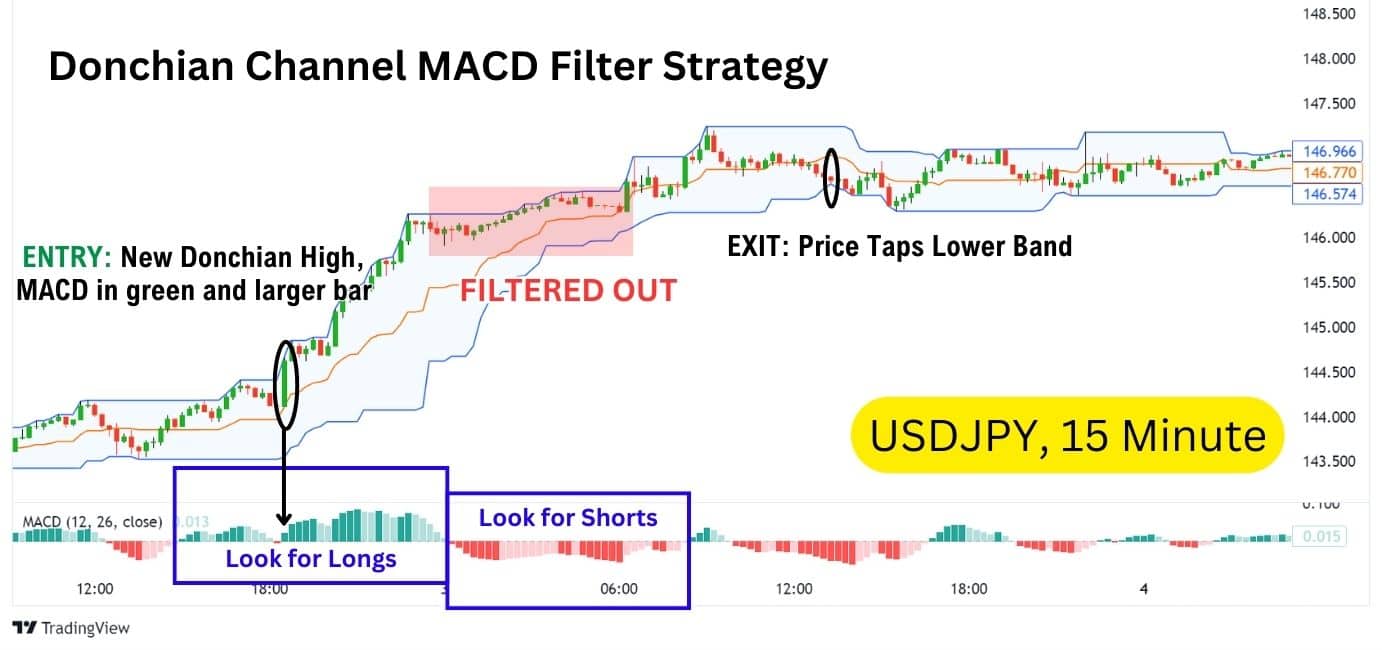
As you’ll notice in our example, the MACD indicator has filtered out a number of potential false breakouts, as they were formed on bearish momentum.
The MACD helps us identify potential breakouts that have higher probabilities, as they are paired with bullish momentum (reflected by the green histogram bars on the MACD indicator).
Advantages of Using the Donchian Channels
- High Reward: The Donchian Channels has a high-reward nature thanks to its ability to detect breakouts on a longer term.
- Versatile Across Markets: The Donchian Channels will be effective in powerful, trending markets such as Gold, Stocks, Indices, and Crypto.
- Simplicity in use: The Donchian Channels is simple in its application; it tells the trader when a new high or new low has been formed within the last X candles. This being the Donchian Channels’ primary use makes it unambiguous to use for traders.
Disadvantages of Using the Donchian Channels
- Low Win Rate: Since markets tend to consolidate around 80% of the time, the Donchian Channel Strategy can generate many false breakout signals, resulting in a low win rate.
- Vulnerable in Choppy Markets: Donchian Channels struggle in sideways or choppy markets, where breakouts may lack momentum, leading to premature entries or exits.
- Unoptimised Entries: Due to the breakout nature of the Donchian Channels, the entry levels provided may be unoptimised. Breakouts can retrace, leading to a temporary drawdown before the price moves in its true direction.
Donchian Channel vs Bollinger Bands®
Donchian Channels and Bollinger Bands are both “channel” indicators that present the volatility of the markets. However, they serve very different purposes.
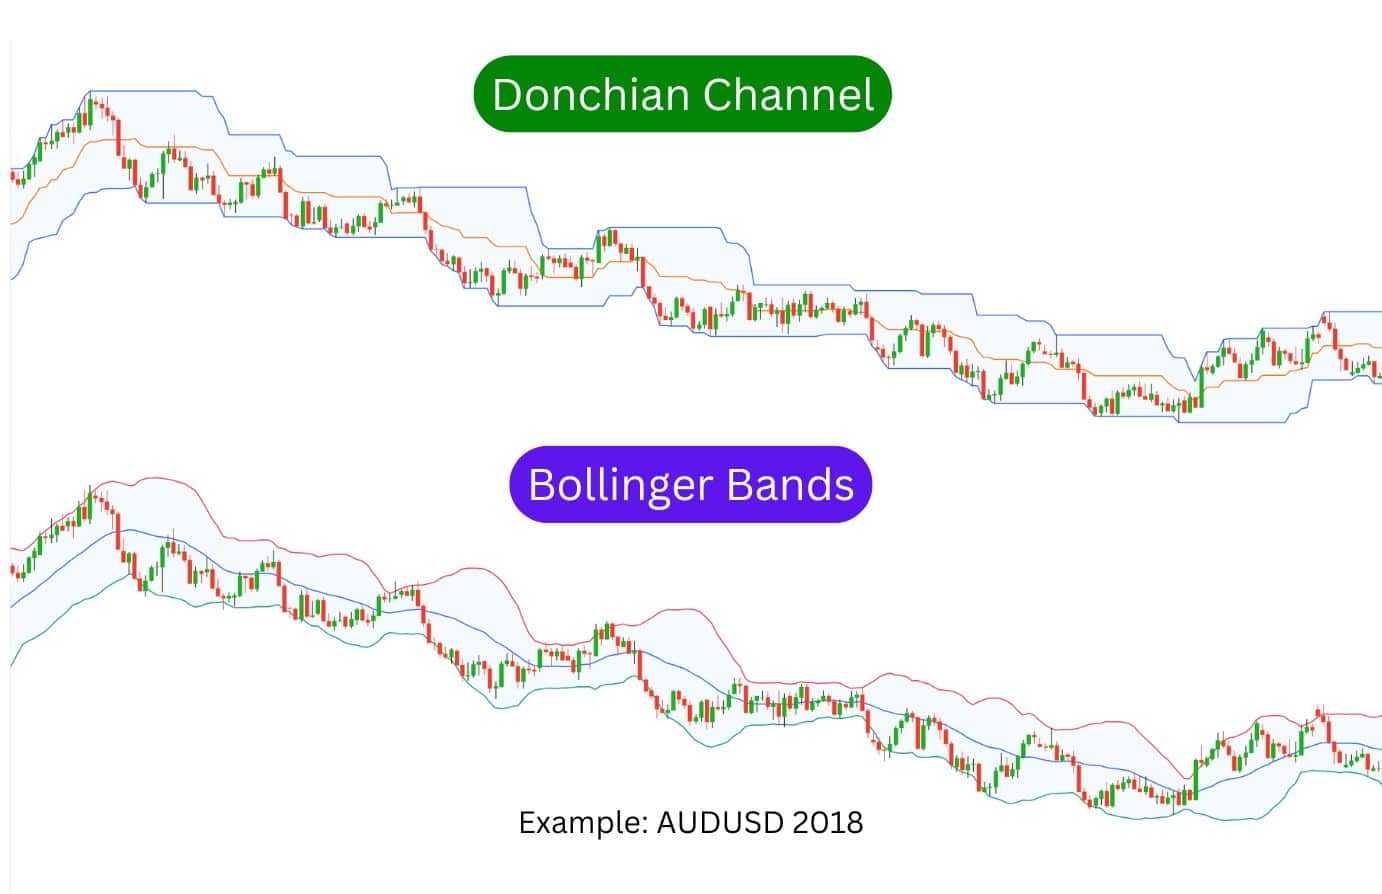
The Bollinger Bands mark out potential support and resistances with a predictive calculation (using the Standard Deviation of 2), which makes it better suited for mean reversion strategies. Meanwhile, the Donchian Channels simply track the highest high, lowest high, and absolute mean between these values – making this indicator more suited for breakout strategies.
Additionally, the Bollinger Bands use a Simple Moving Average to get its middle line, while the Donchian Channels get its middle line from calculating the absolute average between the lower and upper bands.
Donchian Channels vs Keltner Channels
Donchian Channels and Keltner Channels are both effective tools for presenting market volatility, but the indicators completely differ in their calculation and application.
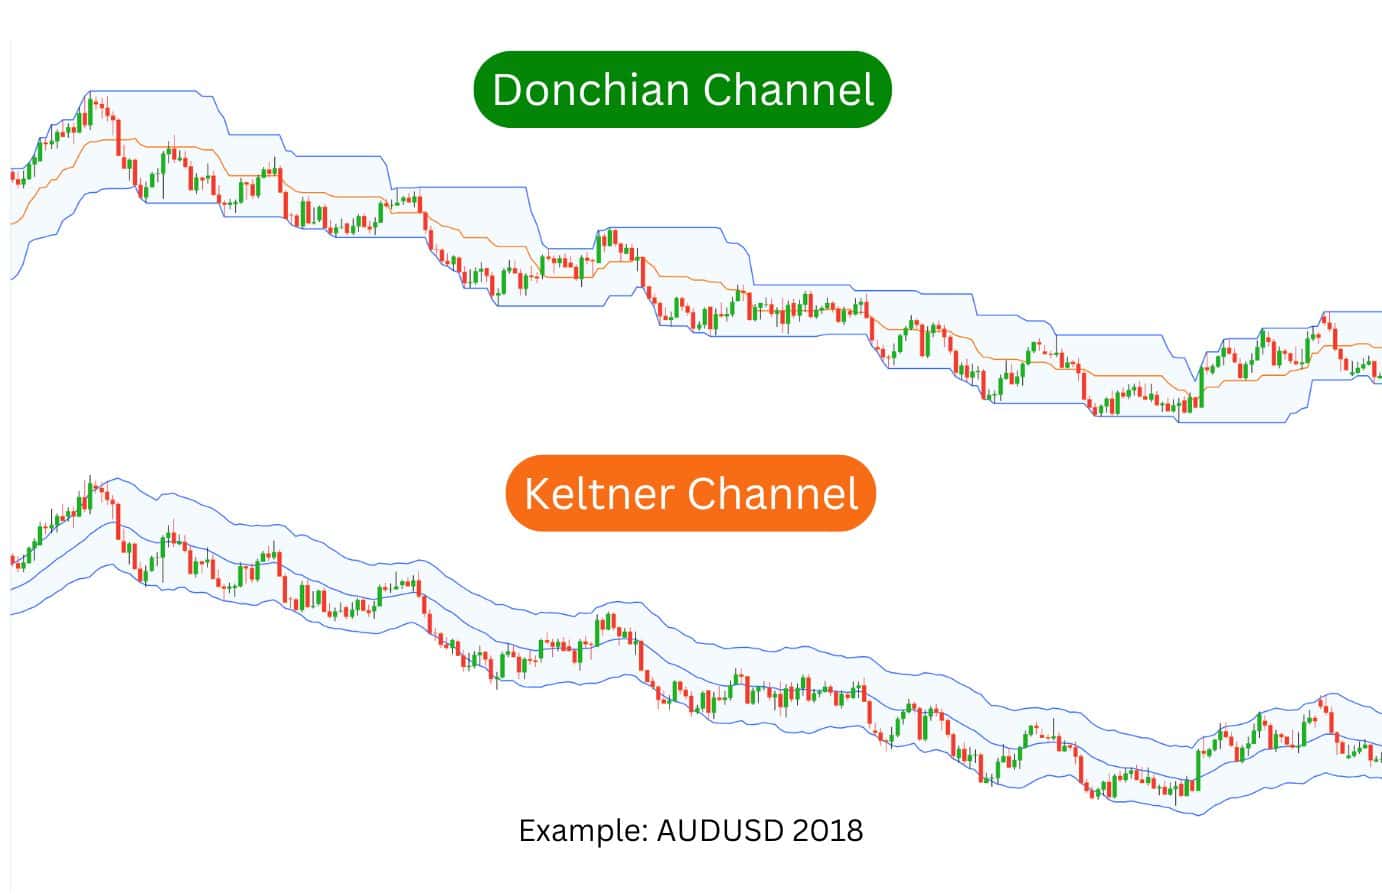
Keltner Channels use the Average True Range (ATR) to determine the width of the channel, which accounts for both price volatility and trading ranges, providing a smoother and more adaptive measure of market conditions. In contrast, Donchian Channels track the highest high and lowest low over a set period, making them simpler and more focused on breakout signals.
Keltner Channels also incorporate the Exponential Moving Average (EMA) for their middle line, which responds more quickly to recent price movements. This makes the Keltner Channel more dynamic, offering a refined view of gradual price trends and volatility shifts. Donchian Channels, on the other hand, calculate the middle line as the midpoint between the upper and lower bands, providing a straightforward indication of the current range.
In short, Keltner Channels offer a more refined volatility measure, while Donchian Channels are better for breakout strategies.
FAQ
How Do I Pick the Number of Periods for a Donchian Channel?
Choosing the number of periods depends on your trading strategy. A shorter period (e.g., 20) is best for capturing shorter and medium term trends, while a longer period (e.g., 55) can help capture long-term trends in the market. However, it is worth noting that the turtle traders favoured using a 20-Day Donchian Channel, which reflected the price action of the past trading weeks.
What is Donchian Channel Scalping?
Donchian Channel scalping involves using short timeframes and periods to quickly enter and exit trades based on small price movements within the channel. This strategy is highly dependent on volatility and often used in fast-moving markets, but is not typically used by traders.
Is Donchian Channel Profitable?
Donchian Channels can be profitable when used correctly in the financial markets, particularly as breakout strategies. The key to profitability lies in backtesting, market conditions, and combining Donchian Channels with other indicators to confirm trends.
The nature of the asset is highly important as well, as some assets simply present stronger trends than others. The turtle traders were commodity traders, so perhaps deflationary assets like Gold were more reliable to trade signals of the indicator on.
What is the History of the Donchian Channel?
The Donchian Channel was created by Richard Donchian in the 1950s, and it became one of the foundational tools for trend-following strategies, particularly after being popularised by the Turtle Trading system.
How reliable is the Donchian Channel?
The reliability of Donchian Channels depends on market conditions and how they’re integrated into a broader strategy. They can be highly effective for identifying breakouts but may produce false signals in choppy or sideways markets.
However, when applied with trend filters and traded across a long period of time, the Donchian Channels can produce more reliable signals that are less likely to get prematurely stopped out.