- Chart of the Day
- September 27, 2024
- 3min read
Netflix Stock Forms All-Time Highs, Eyes $800.00
Netflix’s stock has broken past its previous all-time high, reaching $725.2. Short-term price targets could focus on round numbers like $750, with resistance expected near $775 and $800. Market sentiment remains bullish amidst strong earnings and positive growth prospects.
That being said, there are still a few considerations to keep in mind for holders and traders of the NFLX stock.
NFLX Stock Daily Chart Analysis
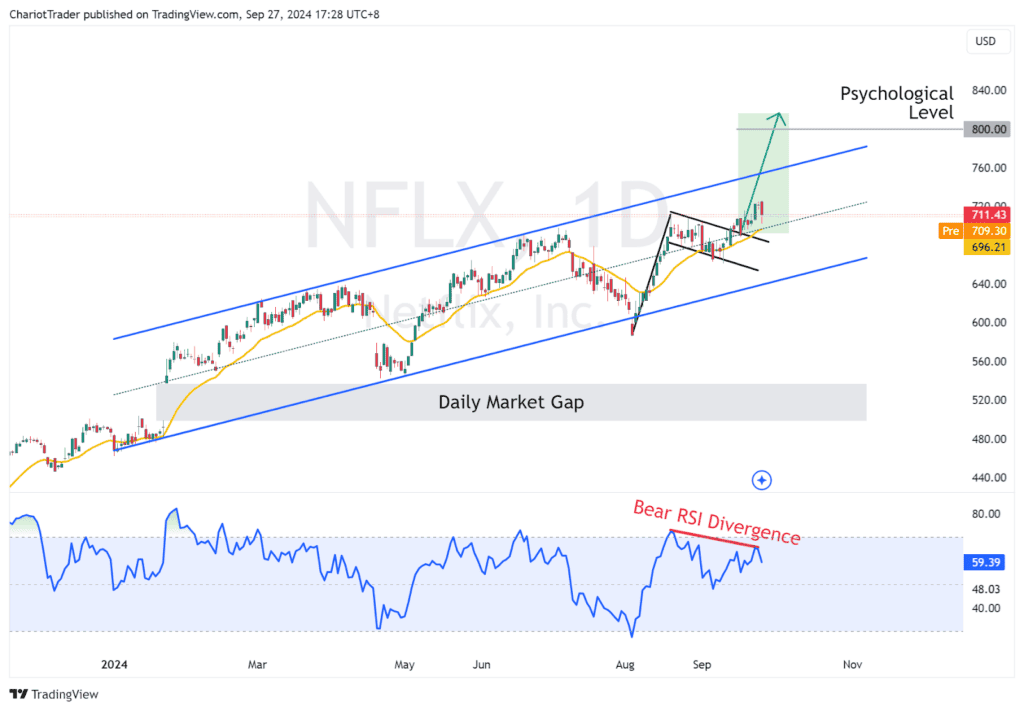
In our previous analysis, we pointed out the 4H bull flag on Netflix with a projected target of $828.11. As it stands currently, the bull flag has been successfully broken out of, and retested on the daily timeframe.
See Guide: How to Trade Bull Flags
While we are on track to higher prices, it’s important to note that Netflix has been trading within an ascending parallel channel from the start of 2024.
This channel offers several interesting levels to trade:
| The upper trendline could become resistance at $750.00 and $775.00, which are psychological price levels. |
| The middle line could act as support, and currently aligns with the previous All-Time High, and daily EMA 20 at around $710.00. This would be significant support. |
| The lower trend line could act as support, at around $650.00, but serious concerns would be posed if the stock price reaches these levels (ascending channels are bearish). |
Outside of the ascending channel, we have potential resistances at $800.00, and support levels at Netflix’s previous pivot lows.
Netflix’s ultimate support is a market gap from approximately $498.90 to $537.00, formed on January 23, 2024 – when Netflix reported strong earnings for Q4 2023.
This gap remains untested, and will be a significant price level that investors and traders are keeping an eye on; as market gaps tend to get revisited and act as support/resistance.
Short Term Bearish Indications on Netflix
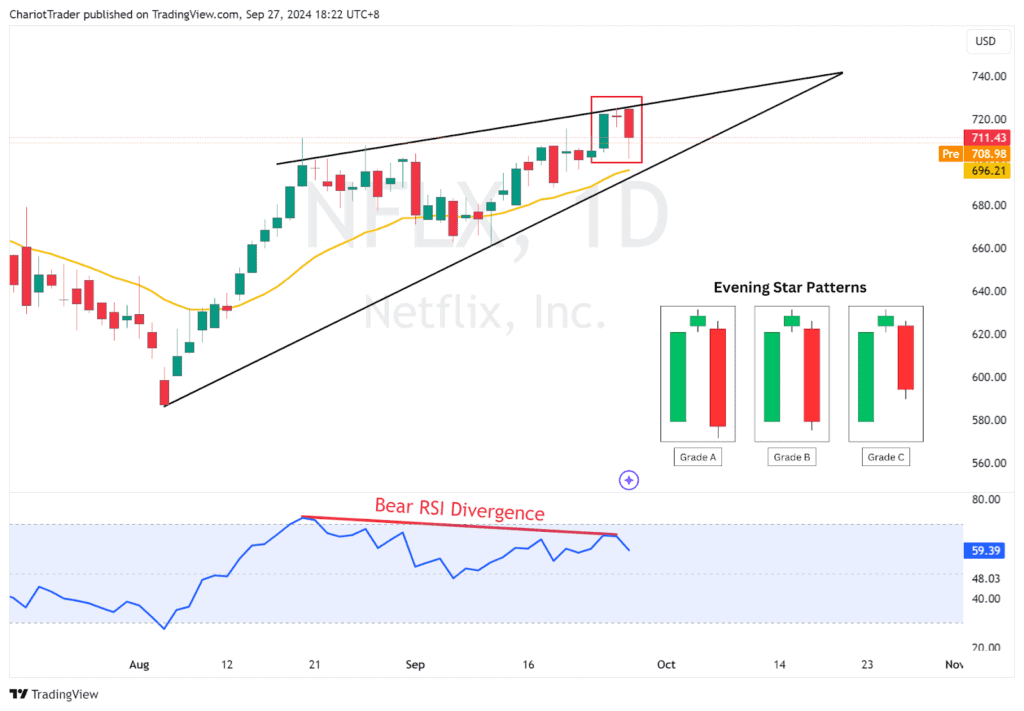
Although profits are streaming to the upside on Netflix, there are a few small bearish indications to consider. The first thing is a bearish RSI divergence on the daily timeframe, to kickstart our suspicions of a potential reversal in the short term.
Pairing with this suspicion is the formation (and close) of a “Grade C” Evening Star Pattern, which isn’t the strongest bearish indication, but still a reversal signal nonetheless.

Last but not least, the NFLX price could be trading in a Rising Wedge Pattern, which if broken to the downside, could take us down to previous lows at $662.00 or $587.00.
You may also be interested in:
NZD/USD Surge: Kiwi’s Turn to Emerge (Elliott Wave)


