


Written by:


- Opening Bell
- September 12, 2024
- 3 min read
EUR/USD: ECB Cuts Rates, US Data Stays Steady
The market has been relatively quiet this week, but we did get some fresh moves from the European Central Bank (ECB). They’ve just announced a 25-basis point rate cut, bringing the deposit rate down to 3.5%. This was pretty much expected given the slowdown in growth and inflation easing up. The ECB is also lowering the spread between the deposit rate and the refinancing rate to 15bp next week, so we’re looking at a refinancing rate of 3.65%.
But here’s the kicker—this might just be the start. The ECB isn’t ready to go all-in on rate cuts just yet, but weaker growth forecasts for the eurozone could change that in 2024. Right now, their projections are showing GDP growth at 0.8% for 2024, which isn’t exactly a confidence booster. Inflation is trending downward too, with forecasts around 2.5% for next year.
So why no aggressive cuts now? Well, wage pressures in places like Germany and some stubborn inflation components are keeping the ECB cautious for the time being. But as soon as those concerns ease, don’t be surprised if the ECB steps up its game next year.
What’s Going on with the Fed?
On the US side, things are a little more stable. Yesterday, the core CPI for August came in a bit higher than expected, but it didn’t shake the market too much. We saw about 7 basis points shaved off the anticipated rate cuts for 2024, but overall, 100 basis points in Fed cuts are still on the table.
The PPI data for August and initial jobless claims numbers are up next. Jobless claims are expected to stay around 225,000, which suggests the labor market is still holding strong. Honestly, with the Fed signaling that the time for cuts is coming, the market isn’t stressing over inflation numbers as much. It’s all about activity data now, especially jobs.
EUR/USD Technical Outlook: Eyeing That Bull Flag
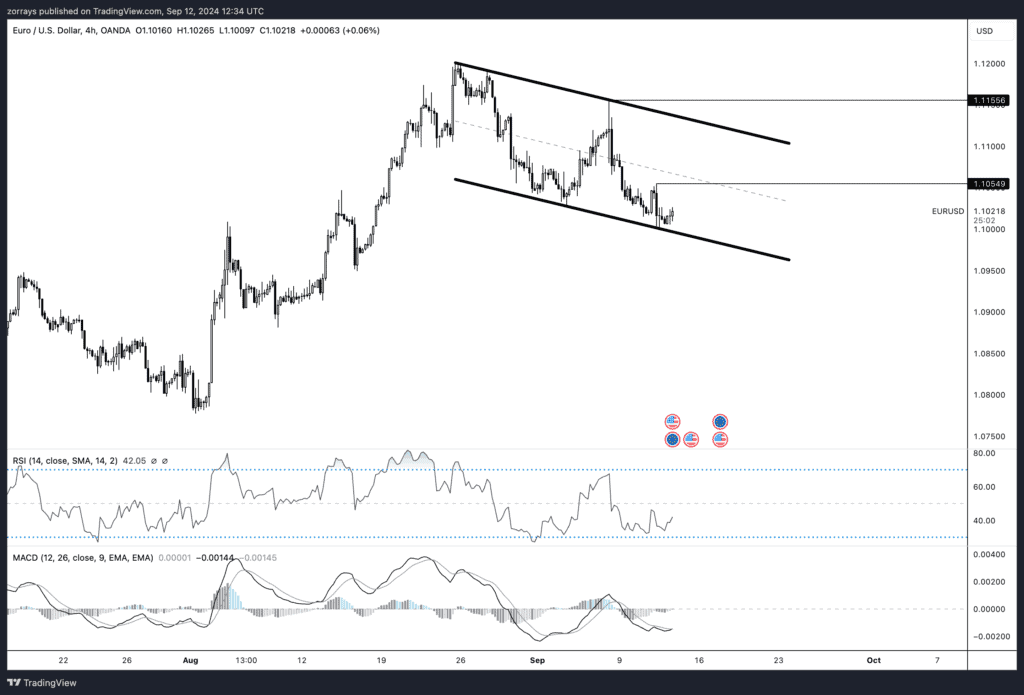
Now let’s get into what’s happening with EUR/USD. If you look at the chart, you’ll see we’re working with a bull flag pattern, which is typically a bullish signal. But—and this is key—we’re going to need to see the price break above 1.10549 for this flag to really be validated. If that happens, the next stop is likely 1.11556.
Here’s something else interesting: there’s divergence showing up in both the MACD and the RSI, which is often a sign that selling momentum is drying up. This divergence means that even though the price has been dropping, the indicators aren’t following along, suggesting that the sellers are losing their grip.
So, what are we waiting for? Well, if the price bounces off the lower bound of the flag and pushes through 1.10549, we could see a solid move higher. But if the bulls don’t show up soon, we might be looking at more sideways action for a bit longer.
What to Watch Next
- 1.10549: This is the level that needs to break for the bull flag to play out.
- 1.11556: The next key resistance if we get that breakout.
- MACD & RSI: Divergences here are hinting that the sellers are running out of steam.


