Written by:


- Opening Bell
- May 27, 2026
- 4 min read
NZD/USD Holds Support as RBNZ Turns Hawkish Before PCE
NZD/USD is trying to bounce from support after the Reserve Bank of New Zealand held the Official Cash Rate at 2.25%. The hold was not dovish. Inflation is expected to peak at 4.3% in the September quarter, which keeps rate-hike risk alive even though policy was left unchanged.
The dollar side still matters. DXY is already testing resistance, while USD/JPY is still moving toward the 160 zone. NZD has a stronger domestic catalyst now, but USD has not broken down yet.
RBNZ Gives NZD a Rate Catalyst
The RBNZ decision was hawkish because of the voting split and inflation outlook. It was reported that three members backed a hike, while Governor Anna Breman used her casting vote to keep rates unchanged. The central bank also signalled that rates may need to rise sooner and by more than previously expected.
That explains the NZD reaction. The market was not buying the hold itself. It was buying the risk that the RBNZ may have to tighten again if energy-driven inflation spreads further into the economy.
NZD/USD Holds Support, But 200 EMA Still Caps the Chart
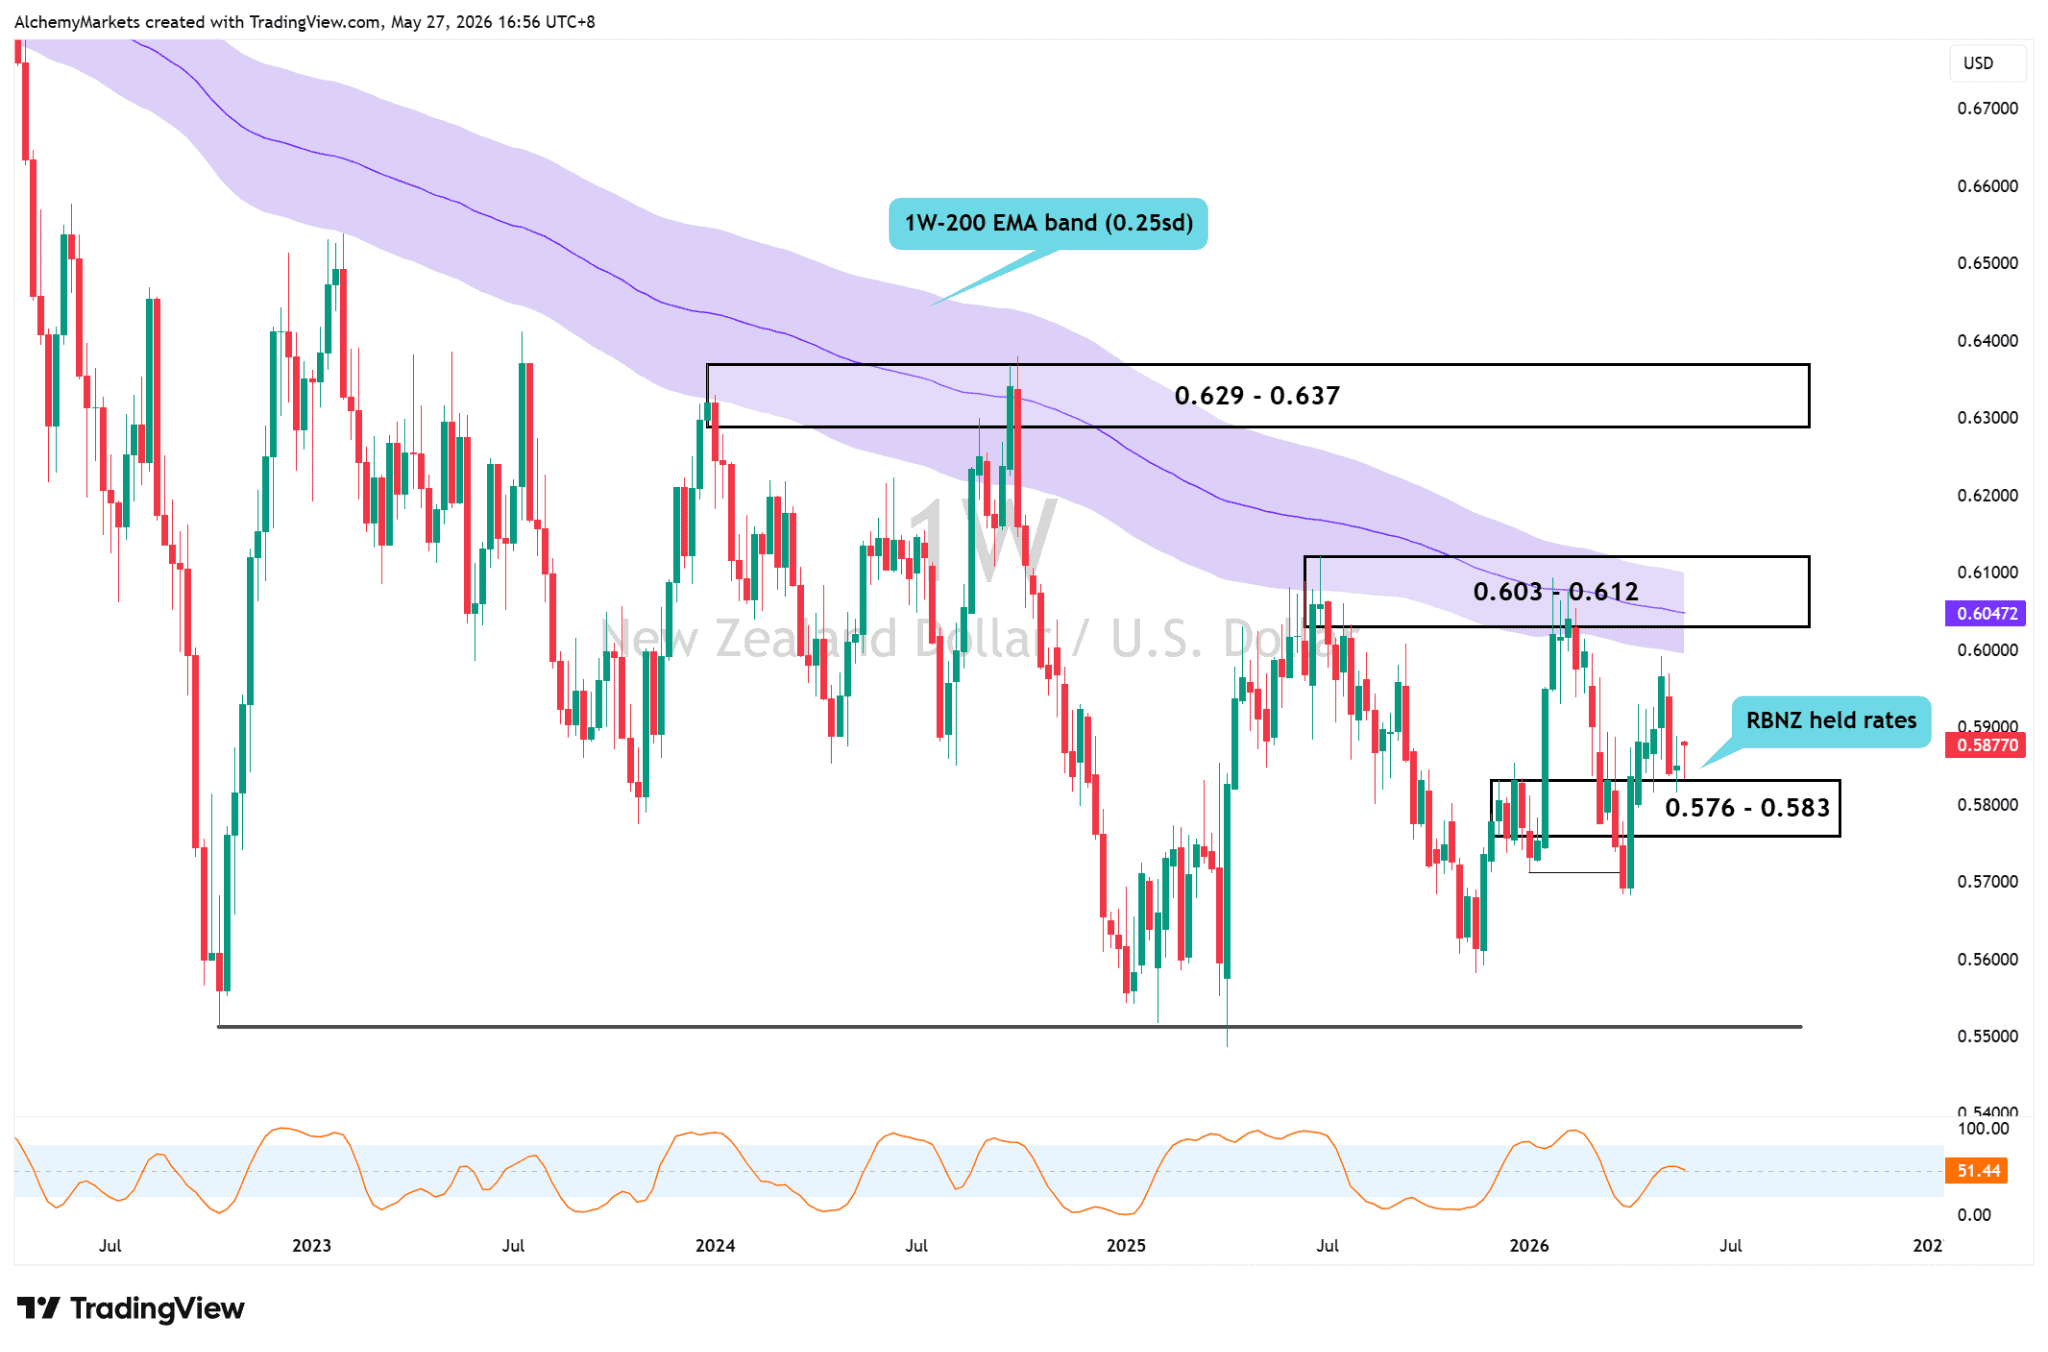
NZD/USD is holding around the 0.576-0.583 support zone. As long as this area holds, the post-RBNZ bounce remains alive.
The bigger test is overhead. NZD/USD is still below the 1W 200 EMA band, with the 200 EMA sitting around 0.6047. That lines up with the 0.603-0.612 resistance zone, which rejected price earlier this year.
This keeps the setup as a support bounce for now. A stronger bullish signal would need price to reclaim the 200 EMA area and hold above 0.603-0.612.
DXY is Already Testing Resistance
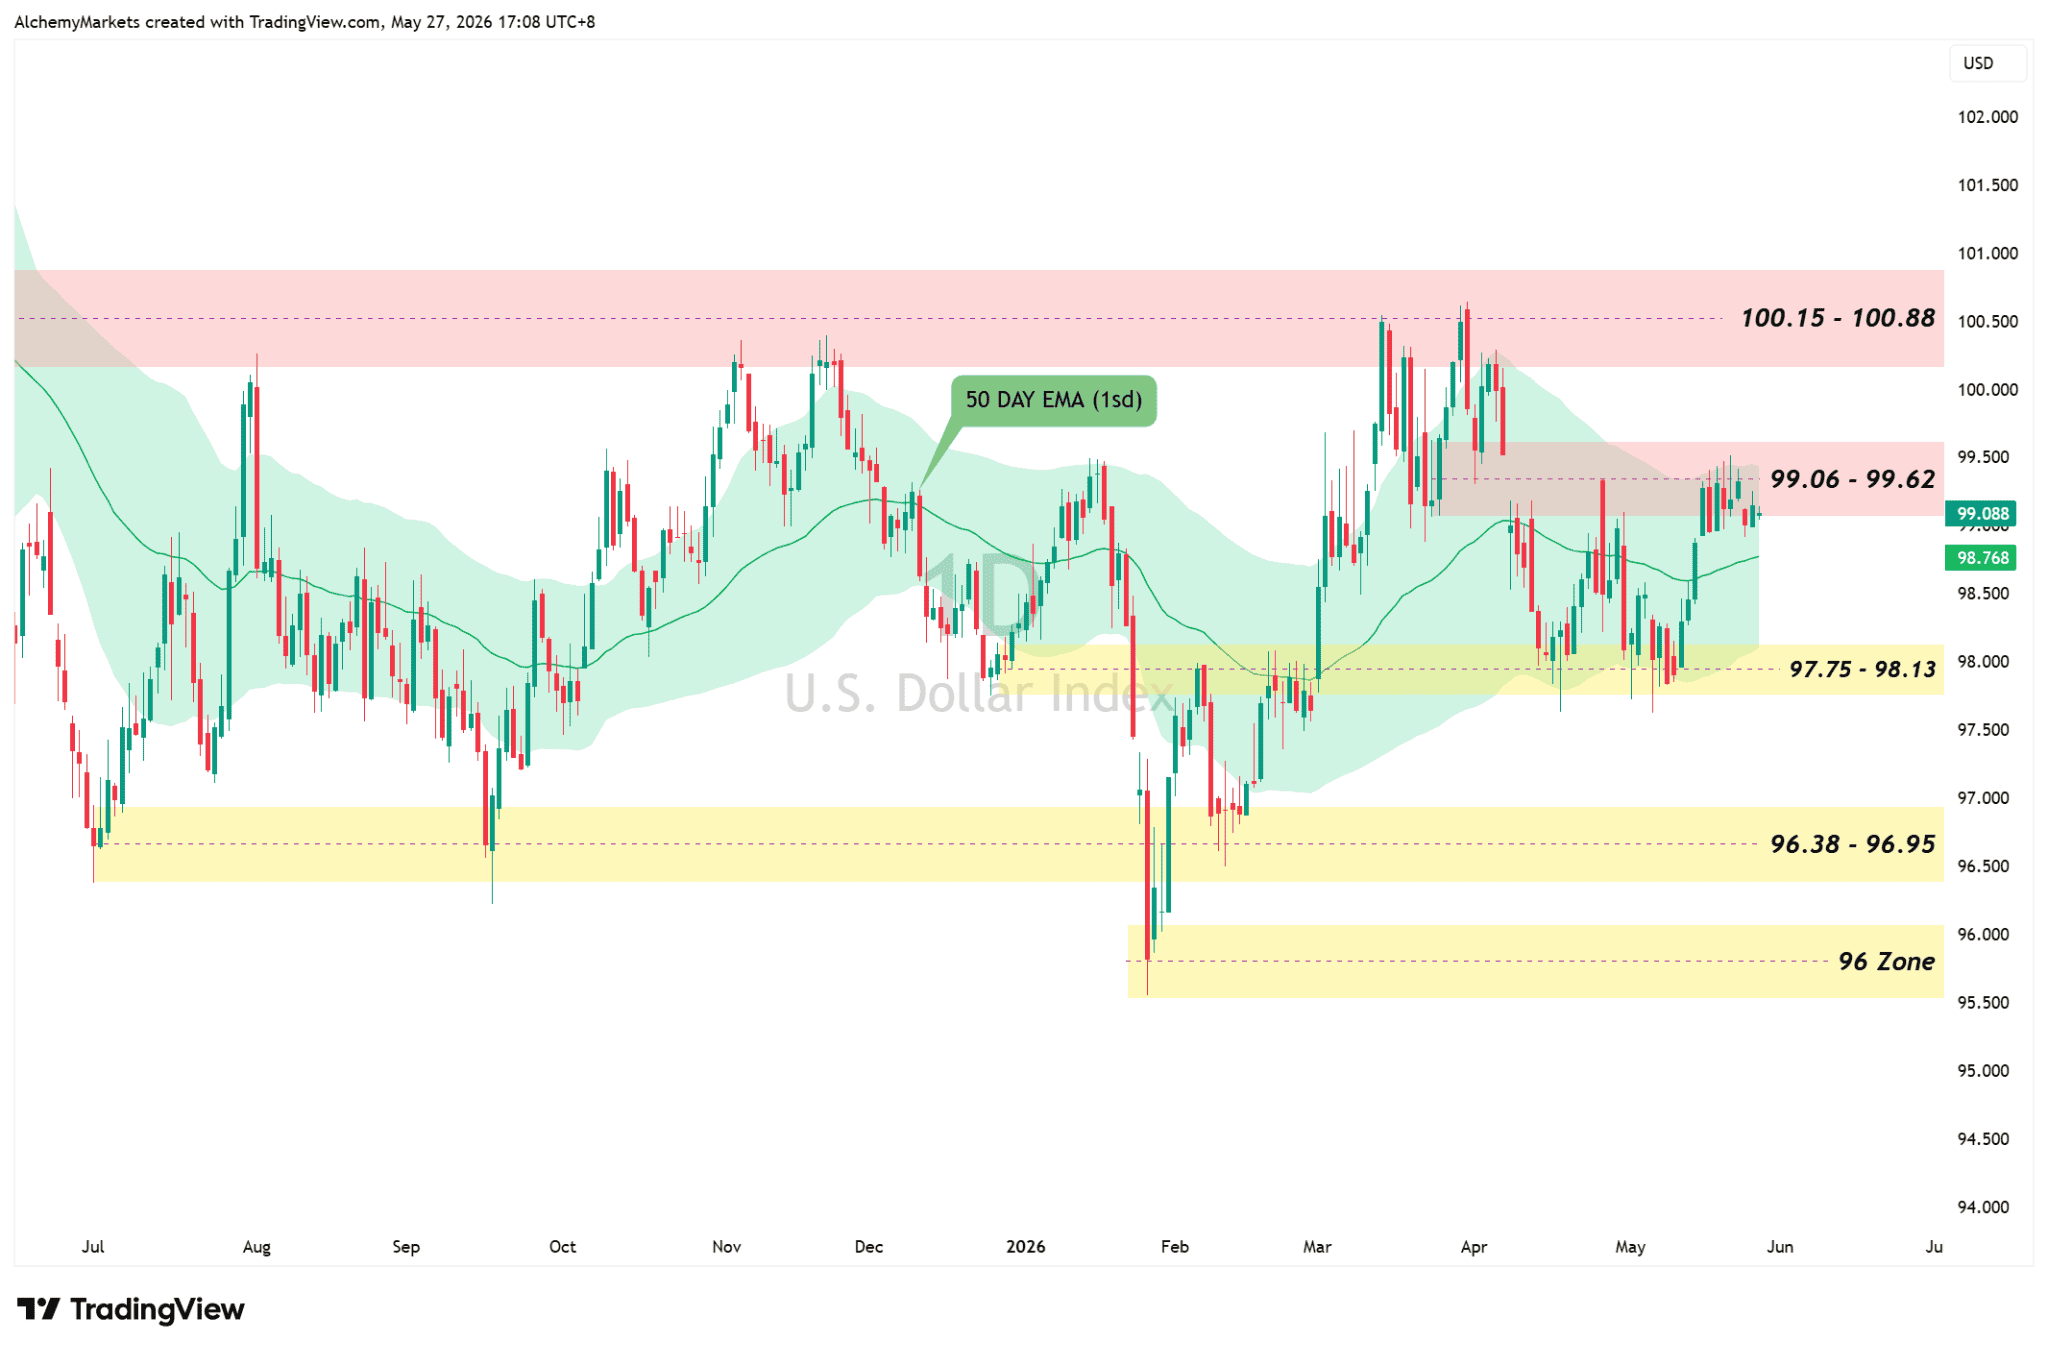
DXY is pressing into the 99.06-99.62 resistance zone, which was highlighted in my previous analysis as the first major test for dollar buyers. The next larger zone sits at 100.15-100.88.
The 50-day EMA band also matters. The previous analysis framed two breaks above the 50 EMA band as a sign that the dollar may be trying to rebuild upside momentum. DXY is now attempting another break above the band while sitting inside resistance.
If DXY rejects 99.06-99.62, NZD/USD has more room to test 0.603-0.612. If DXY breaks higher, the NZD/USD bounce may struggle below the weekly 200 EMA band.
USD/JPY Shows Dollar Demand, But 160 is Still Sensitive
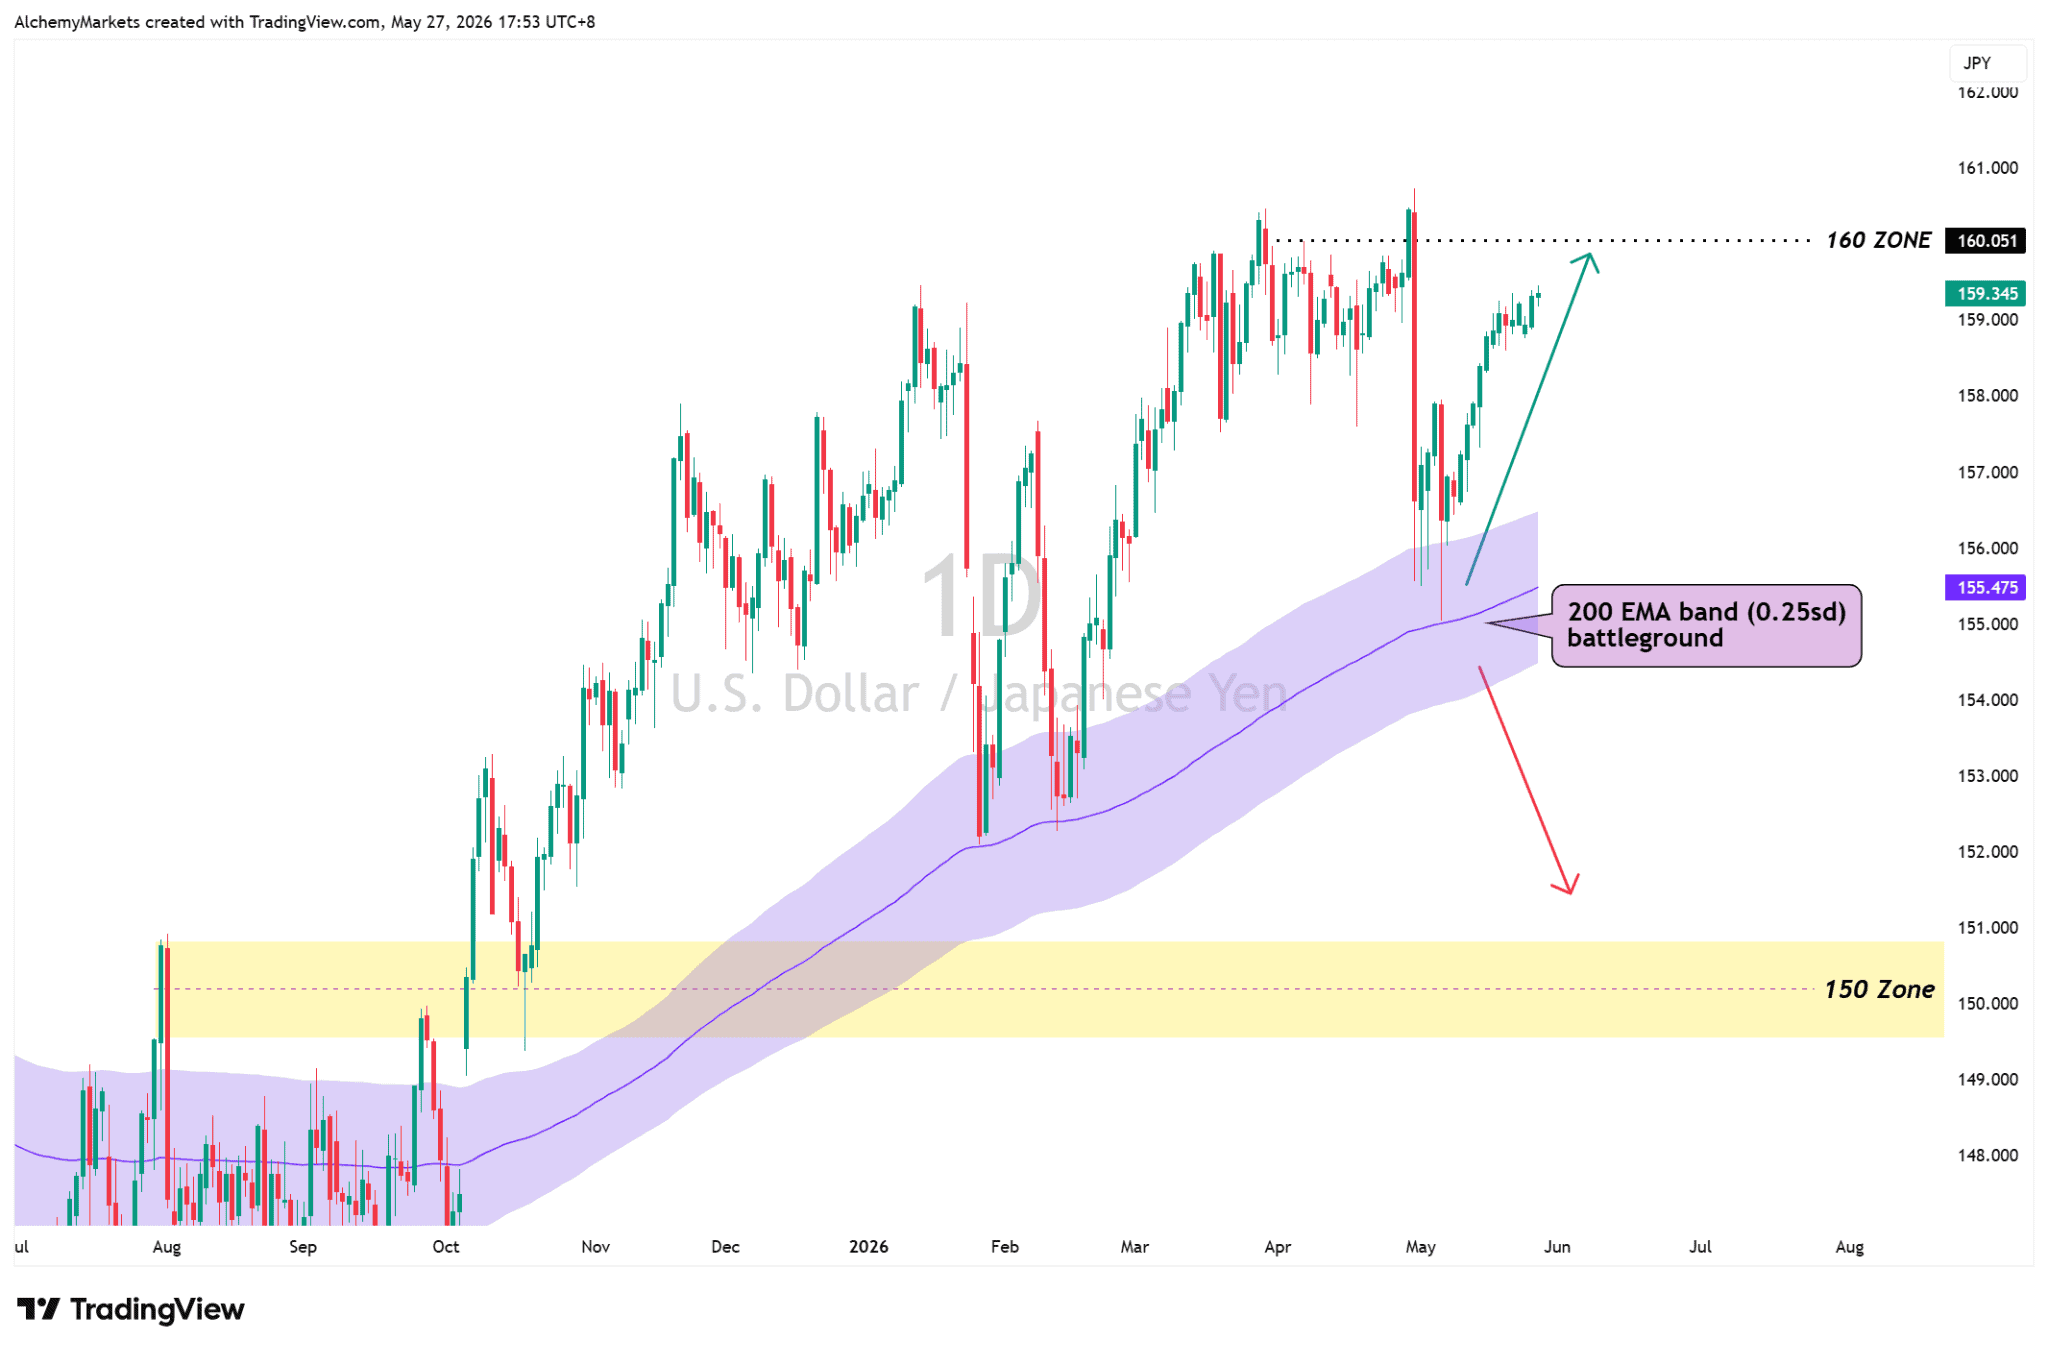
USD/JPY shows that USD demand has not disappeared. The pair is still trailing higher toward the 160 zone, while holding above its own 200 EMA band.
The issue is that 160 is not normal resistance. It is also intervention-sensitive, with traders watching for possible Japanese pushback if yen weakness extends further.
That makes USD/JPY useful as a dollar strength gauge, but not a clean chase-higher setup. If USD/JPY stalls near 160 while DXY rejects resistance, the dollar side of NZD/USD weakens. If USD/JPY keeps climbing and DXY confirms a second break above the 50-day EMA band, NZD/USD may find it harder to push through resistance.
US Inflation Table
| Data point | Previous | Expected | Actual |
| Headline PCE YoY | 3.5% | ||
| Core PCE YoY | 3.2% | ||
| Headline CPI YoY | 3.3% | 3.7% | 3.8% |
| Core CPI YoY | 2.6% | 2.7% | 2.8% |
| Headline PPI YoY | 4.3% | 4.9% | 6.0% |
PCE Decides Whether USD Caps the Move
US PCE is the next macro test. A hotter print could support USD by keeping Fed tightening risk alive. A softer print would make it harder for DXY to extend through resistance.
NZD/USD can keep bouncing while 0.576-0.583 holds. The first upside test is still 0.603-0.612, where the weekly 200 EMA band sits near prior resistance.
The main risk is DXY. If the dollar confirms a second break above its 50-day EMA band and pushes through 99.06-99.62, NZD/USD may stay capped. If DXY rejects the zone instead, the kiwi has more room to extend.