


Written by:

- Weekly Outlook
- May 23, 2026
- 4 min read
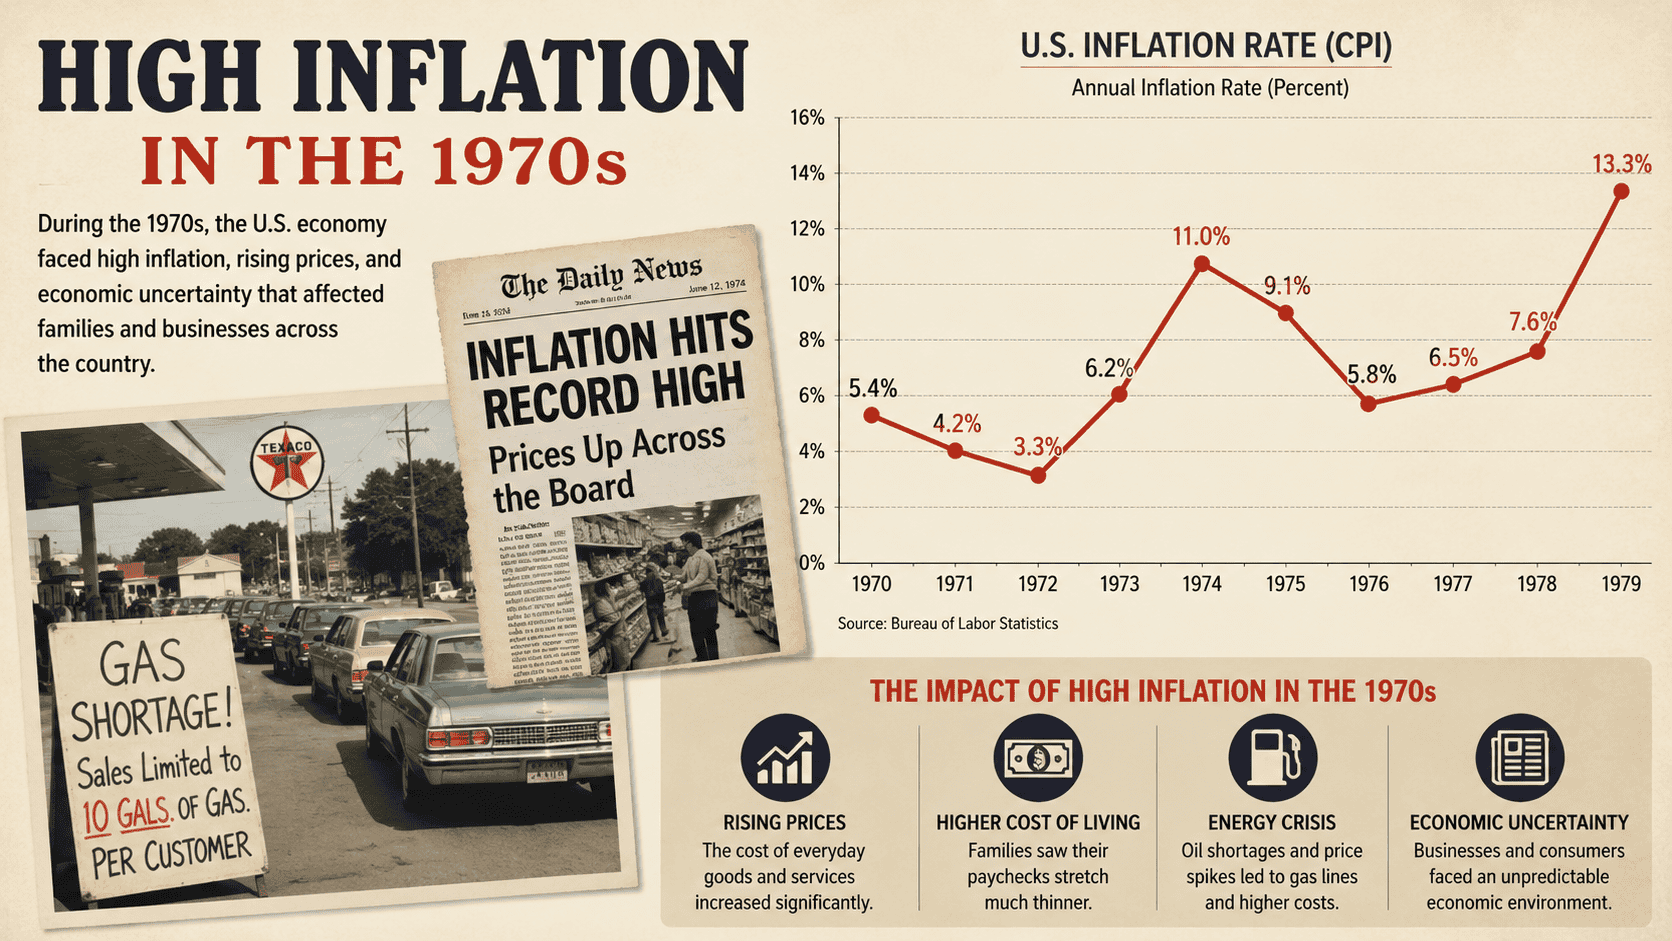
Hot Inflation, a Hawkish Fed, and Gold on the Edge
The story driving markets
The bond market has pulled off one of the sharpest narrative reversals in recent memory. A market that began the year confidently pricing rate cuts is now openly flirting with the prospect of rate hikes — and Treasury yields have moved accordingly. The 10-year is pressing the upper end of its 2026 range around 4.55–4.62%, the 30-year has punched above 5%, and the 2-year has reclaimed the 4% handle.
The catalyst is inflation that simply refuses to behave. April CPI came in at 3.8% — the hottest reading in nearly three years — with energy alone accounting for roughly 40% of the increase, alongside firmer shelter and food prices. The energy shock stemming from the conflict in the Middle East and the disruption around the Strait of Hormuz is now feeding directly into consumer prices, and that is exactly the kind of supply-driven inflation a central bank struggles to contain. With a hawkish-leaning Fed under new leadership and a deeply divided FOMC, the market has shifted from asking when the next cut comes to pricing a meaningful probability of tightening before year-end.
That backdrop sets the tone for the week ahead — and the data on the docket has the potential to pour fuel on the fire.
The week ahead
In a holiday-shortened week, with US markets closed Monday for Memorial Day and liquidity thin into the open, the main macro story will be tied to the April personal income and spending report. Headline spending will be lifted by higher gasoline prices, but otherwise we are likely to see some weakness in an environment where consumer sentiment is so depressed. We already know that auto sales fell and retail sales in general were mixed. The softness in service sector surveys also hints at subdued spending.
The report also includes the Fed’s favoured measure of inflation, the core PCE deflator. It is expected to show prices rising 0.3% MoM versus the 0.4% MoM increase seen in core CPI. That is because some of the components, such as airline fares and medical care costs, are more closely aligned with the PPI metrics for those components, while weaker stock markets will depress the portfolio fees component. This will do little to ease inflation concerns in an environment where freight costs are rising appreciably in response to higher motor fuel costs. There are several Fed speakers scheduled too, and they are likely to sound quite hawkish, which will keep the market leaning in the direction of possible rate hikes over the coming 18 months.
US economic calendar — major events
Monday 25 May — Memorial Day. US markets closed. Expect thin, headline-driven trade across the globe.
Tuesday 26 May — Conference Board Consumer Confidence (the week’s first read on whether depressed sentiment is stabilising), Durable Goods Orders, FHFA House Price Index, and the Dallas Fed Manufacturing Index.
Wednesday 27 May — MBA Mortgage Applications and the FOMC Minutes, which will be scoured for how seriously policymakers are entertaining a shift in the direction of the next move.
Thursday 28 May — Q1 GDP (second estimate), weekly Initial Jobless Claims, and Pending Home Sales.
Friday 29 May — The main event: April Personal Income & Spending and the core PCE deflator, alongside the Chicago PMI and the final University of Michigan Consumer Sentiment print.
The risk is asymmetric. A firm core PCE lands in an already nervous market and hands the hawks fresh ammunition; only a clear downside surprise would meaningfully challenge the rate-hike narrative now embedded in the curve.
Chart of the week: Gold (XAU/USD)
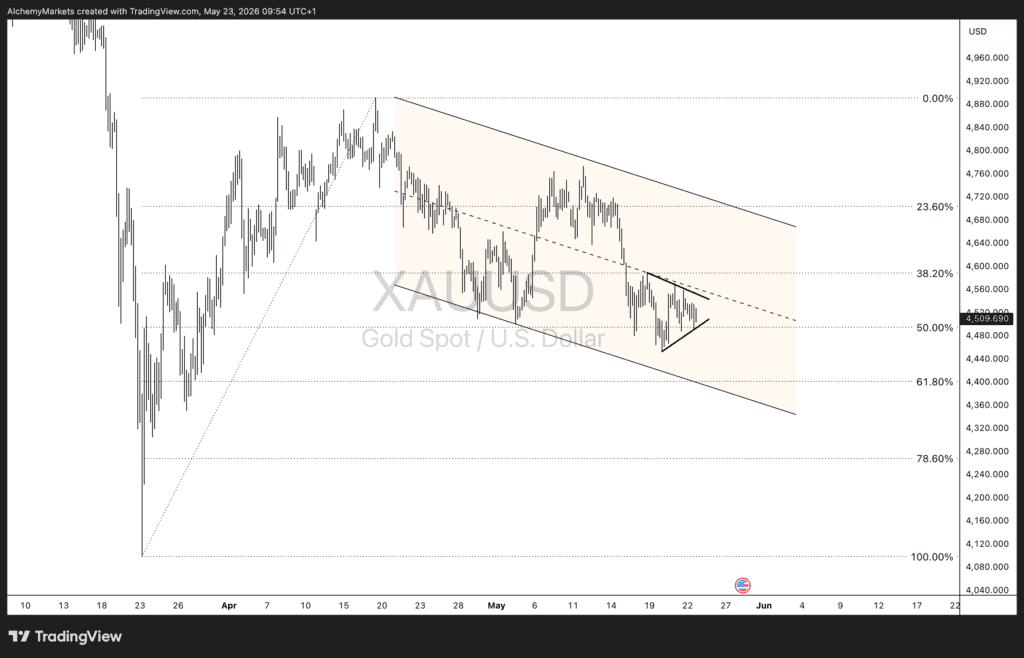
Gold has spent the past month grinding lower after topping out near $4,890, and the technical structure now mirrors the macro pressure. Price has retraced the prior advance back into the 50% Fibonacci zone around $4,495, with spot sitting just above it at roughly $4,510. The decline has been orderly, contained within a well-defined descending channel, and the latest price action has coiled into a small triangle as the market consolidates ahead of the data.
The setup is poised. A downside break of that triangle would open the door toward the 61.8% retracement near $4,400, a level that lines up neatly with the lower boundary of the descending channel — a confluence that makes it the natural magnet on a break lower. That technical picture sits hand-in-glove with the fundamentals: a hawkish Fed, higher real yields, and a firm dollar are a textbook headwind for a non-yielding asset, and a hot core PCE on Friday would be the obvious trigger.
To the upside, the 38.2% retracement around $4,590 caps the immediate recovery, with the channel top and the 23.6% level near $4,705 the bigger hurdle. A decisive break back above the channel would neutralise the bearish structure — but for now, the path of least resistance, on both the chart and the macro, points lower.


