


Written by:

Reviewed by:


Bearish
Bullish
- May 5, 2026
- 22 min read
Mitigation Block Explained with Examples
There are many ways to interpret price movements in financial markets.
But in the Smart Money Concepts (SMC) framework, extra priority is placed on understanding where large financial institutions may have entered, defended, or exited positions.
Part of that understanding involves mitigation blocks, which are support and resistance flips, as interpreted by the Smart Money Concepts approach.
In this guide, you will learn how mitigation blocks work and how to use them correctly alongside other confirmations to anticipate market reactions and identify high-probability trade setups.
What Is a Mitigation Block in Trading?
In Smart Money Concepts (SMC), a mitigation block (MB) is a support-resistance flip that forms after a failure swing and a change of character (ChoCH / MSS) or a break of structure (BOS). Once the mitigation block forms, price often revisits the area and reacts from it, which can create trading opportunities.
In other words, a mitigation block is a broken order block that forms without first creating a lower low, or a higher high. This will make sense in a bit as you read through the article.
Mitigation in trading refers to positions being reduced or closed when price returns to a previously traded level.
This is relevant in the sense that, when price breaks through a support or resistance zone, traders caught on the wrong side are left in losing positions. Some educators describe this as market inefficiencies.
As price revisits these areas, those traders exit or flip their positions, providing liquidity that helps price continue in the new direction.
What is a Bullish Mitigation Block?
A bullish mitigation block appears when a previous high is broken to the upside.
A key characteristic in a MB is the failure swing — a failure to create a lower low in the case of a bullish MB — right before breaking the previous high, which acts as resistance.
Therefore, the bullish pattern must create the following pivots: Previous high → HL → HH to be valid.
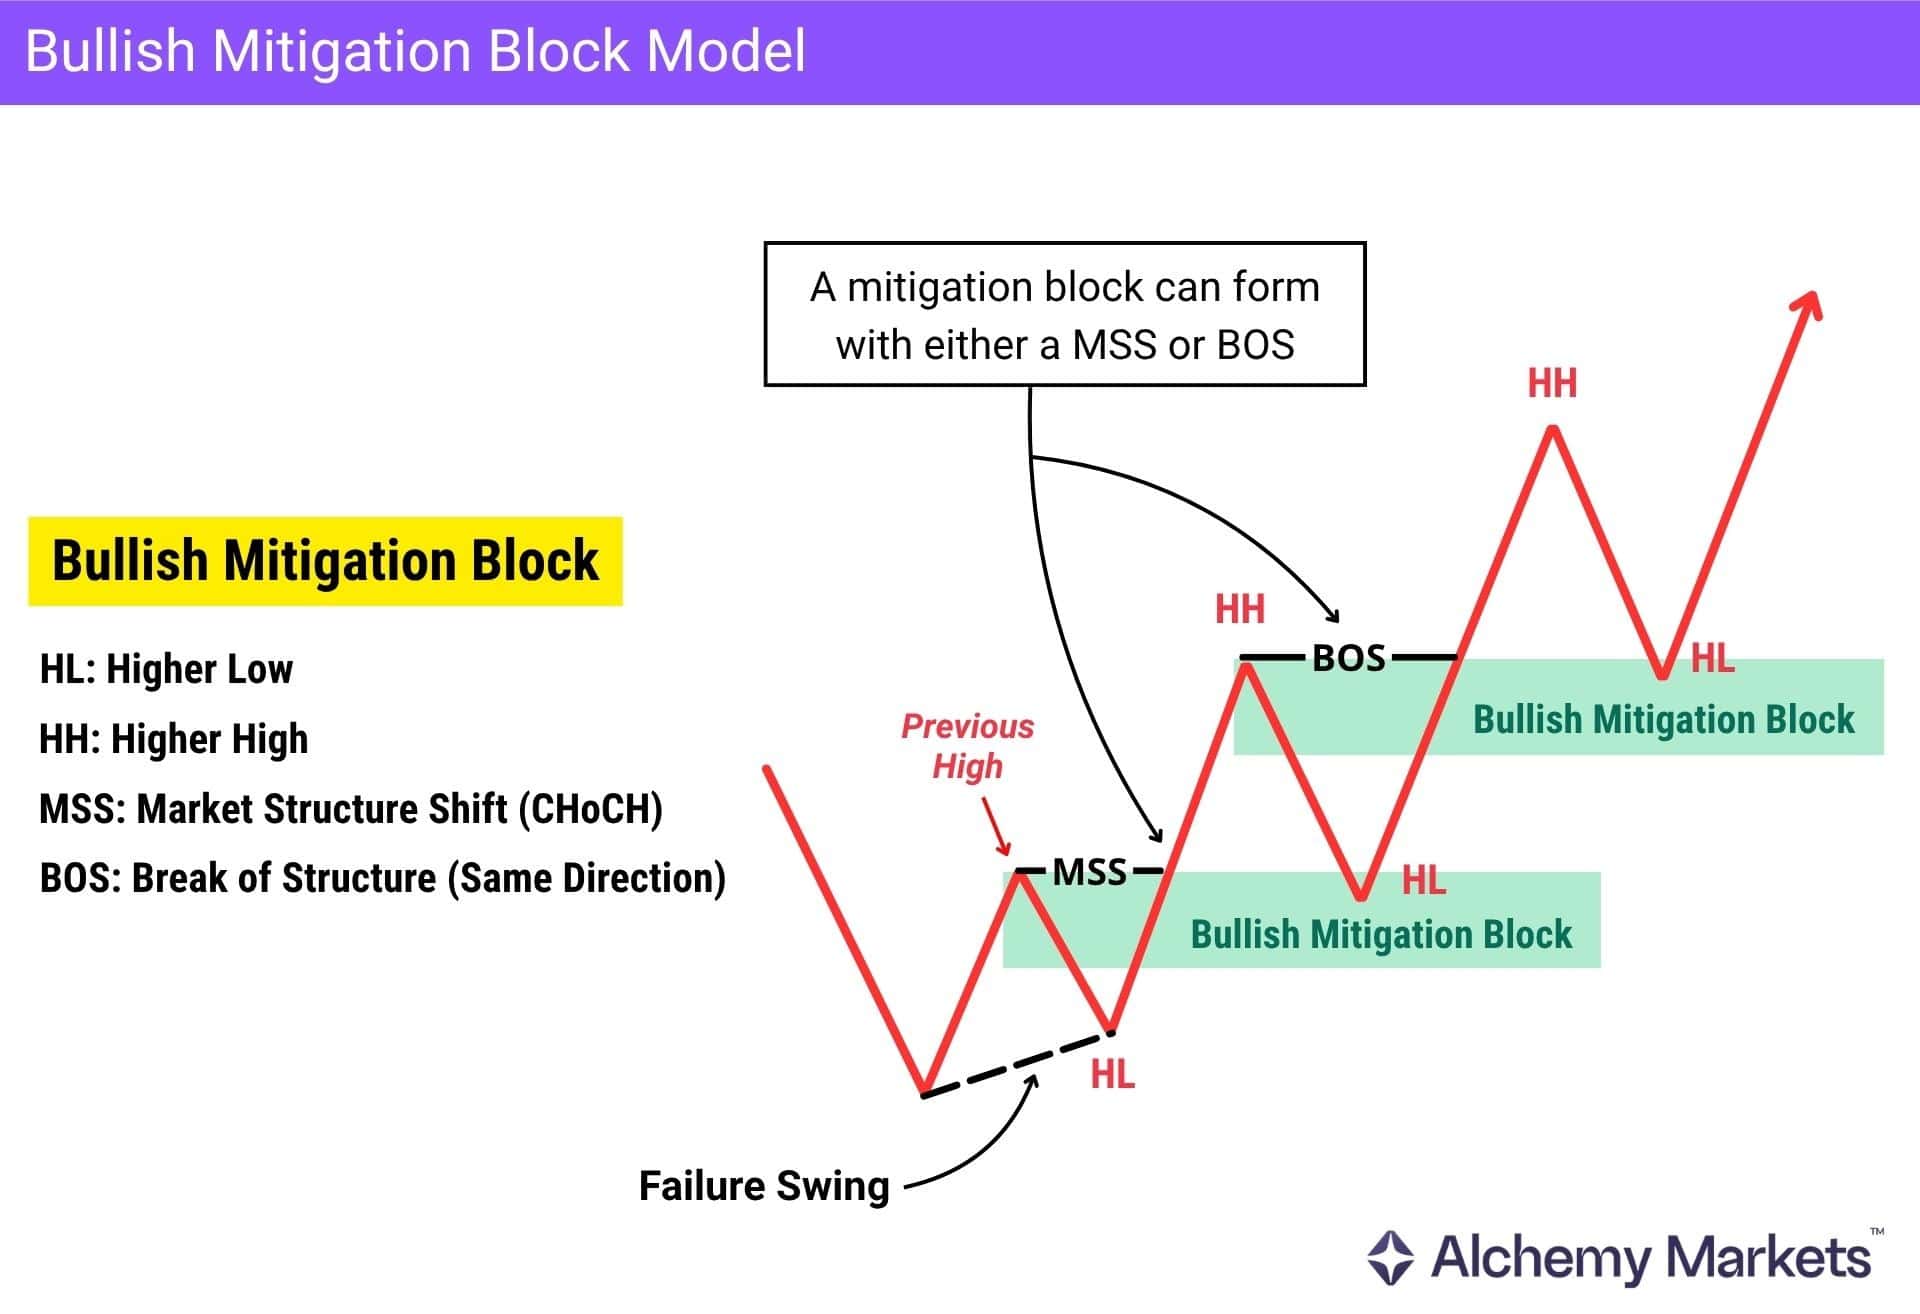
The structure typically develops as follows:
- Previous High – A clear resistance level or bearish order block (OB) is formed. Can be a HH or a LH.
- Failure Swing – Price begins to push upward without sweeping a prior low
- Break of Resistance – Price breaks above the previous high or bearish OB.
- Mitigation Block Forms – After a close beyond the OB, the price may retest the mitigation block as support.
Traders use a bullish mitigation block to anticipate buying opportunities when price returns to the area.
What Is a Bearish Mitigation Block?
The bearish mitigation block works the same way as the bullish one, just flipped. Instead of breaking higher, price pushes through a previous low and shifts the structure to the downside.
In the case of a bearish MB, the failure swing refers to a failure in creating a higher high, right before breaking the previous low.
Therefore, the bearish pattern must create the following pivots: Previous low → LH → LL to be valid.
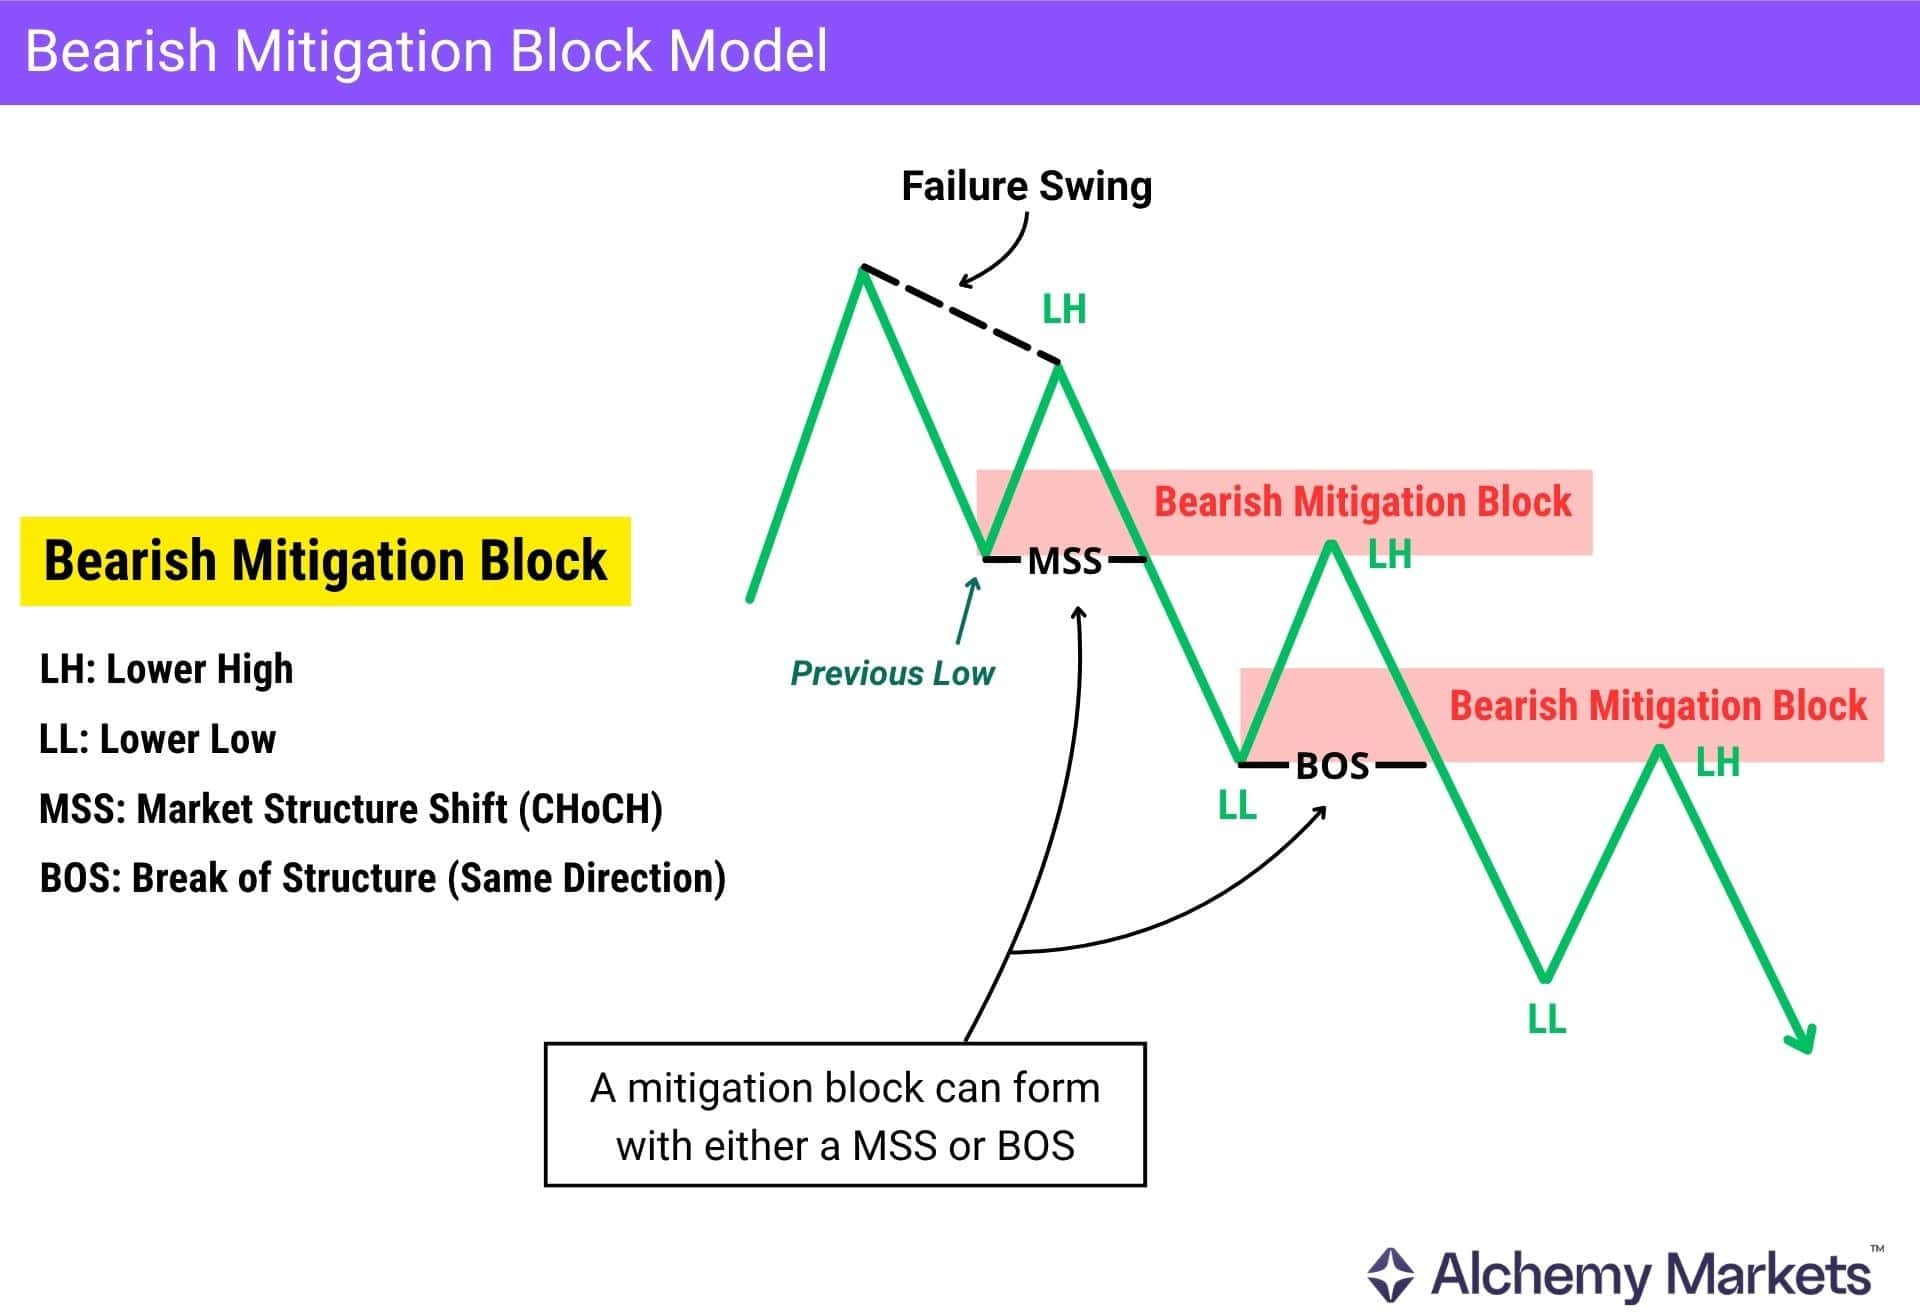
The structure typically develops as follows:
- Previous Low – A clear support level or bullish order block (OB) is formed. Can be a LL or a HL.
- Failure Swing – Price begins to push downward without sweeping a prior high.
- Break of Support – Price breaks below the previous low or bullish OB.
- Mitigation Block Forms – After a close below the OB, price may retest the mitigation block as resistance.
Traders use a bearish mitigation block to anticipate selling opportunities when price returns to the area.
How Does the Mitigation Block Work?
Once a mitigation block forms, it becomes an area price may react from if revisited. The retest usually happens as price slows down after breaking into a new high or low, then pulls back toward the level.
When price returns, trapped traders exit or flip their positions, while new traders step in on the support-resistance flip, helping price continue in the breakout direction.
This is one reason institutional traders and other large participants may pay close attention to mitigation blocks, as they can become efficient areas to re-enter in the new direction.
How a Mitigation Block Forms
A mitigation block forms when price starts to lose momentum in one direction and shifts the other way, breaking a previous high or low. The order block at that level then flips into a mitigation block, acting as a new support or resistance zone.
This shift is typically preceded by a failure swing, where price is unable to extend further and create a higher high or lower low.
| Bullish Mitigation Block | Price shows weakness to the downside by failing to make a lower low, forming a higher low instead. It then breaks above the previous high, signalling a shift upward. |
| Bearish Mitigation Block | Price shows weakness to the upside by failing to make a higher high, forming a lower high instead. It then breaks below the previous low, signalling a shift downward. |
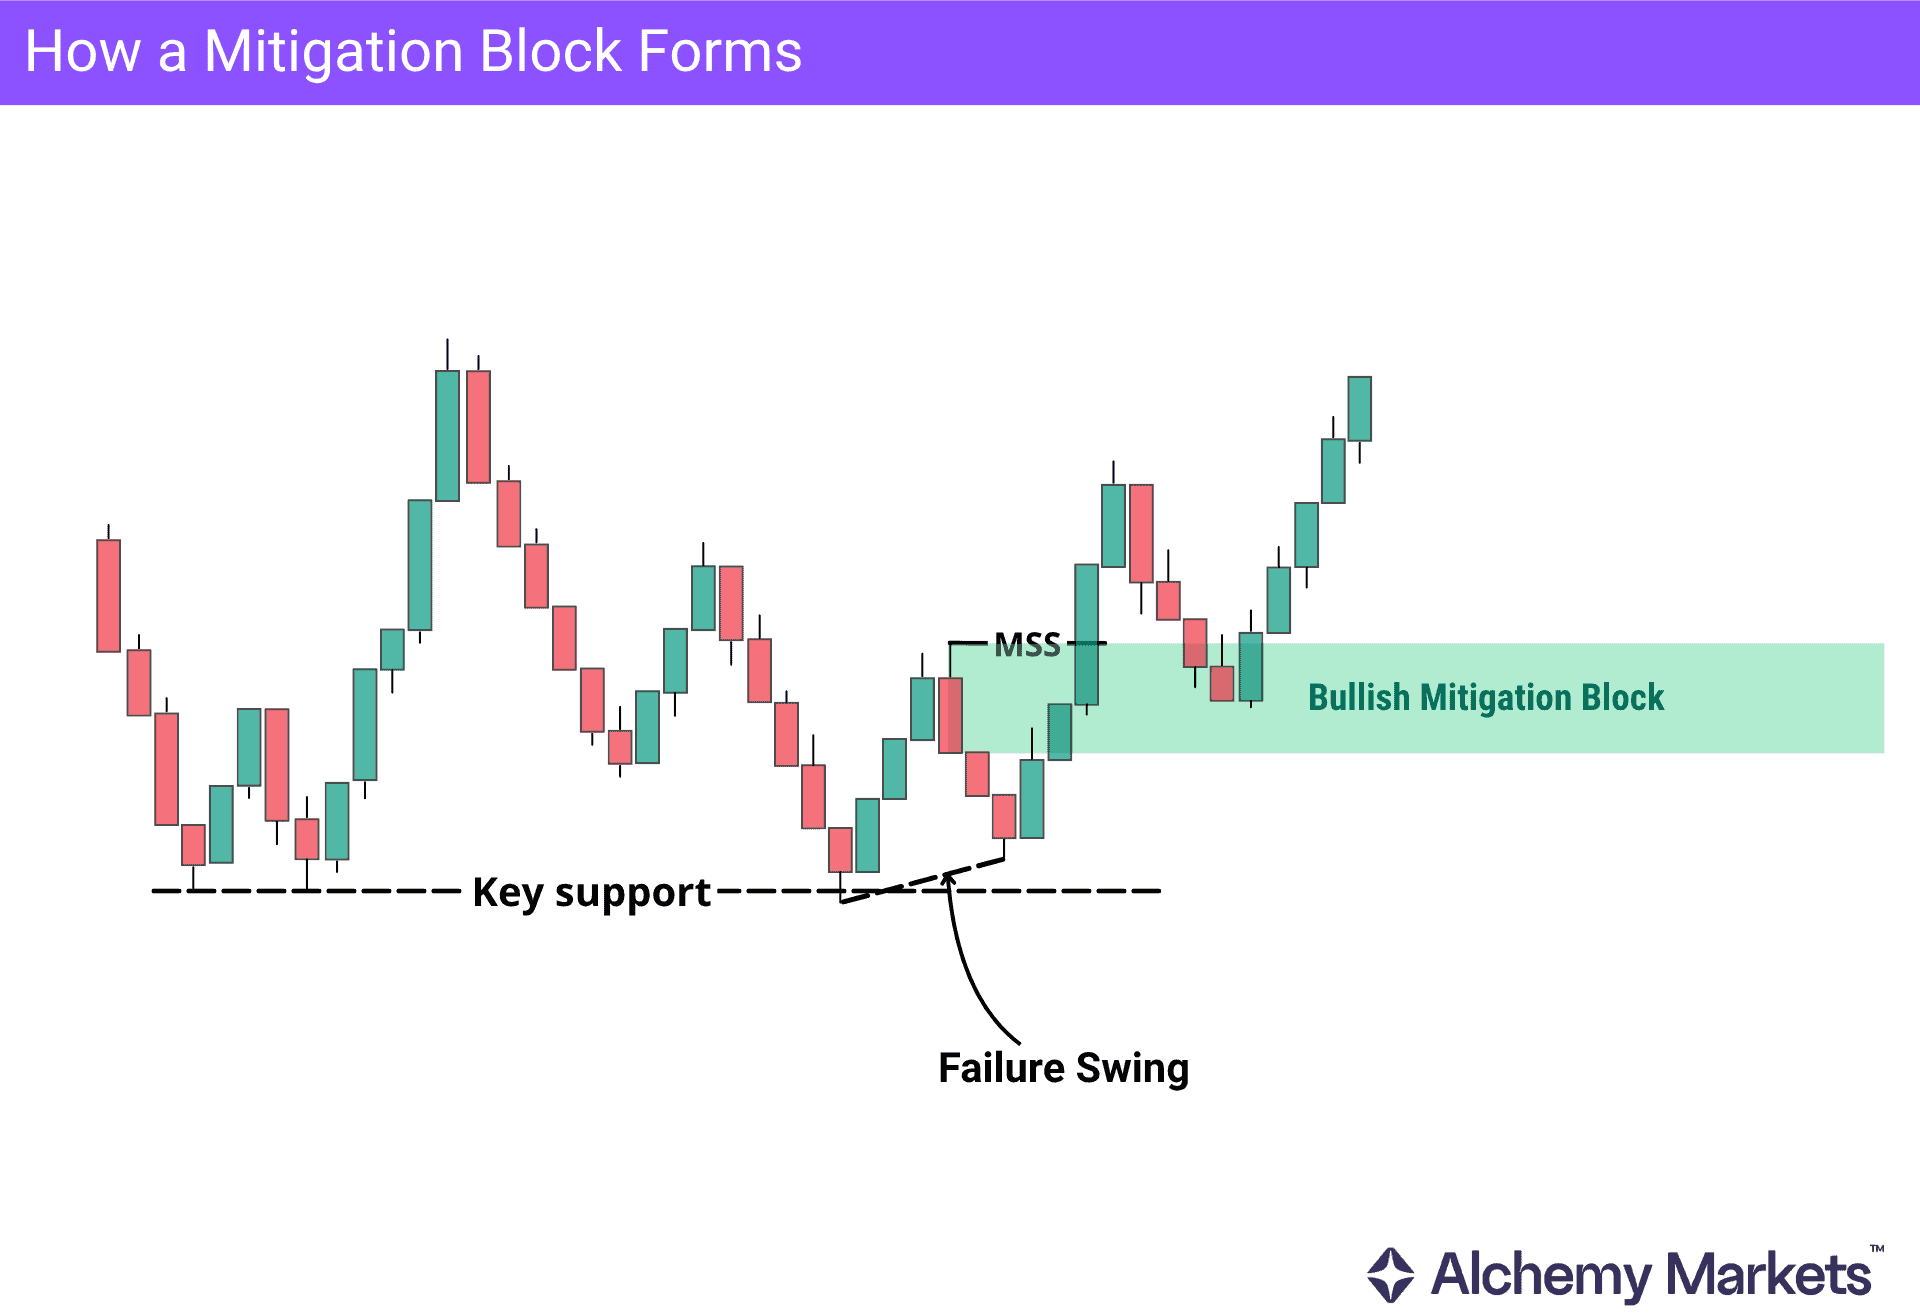
Note: A mitigation block forms without a liquidity sweep. If liquidity is taken before the break, the setup becomes a breaker block, not a mitigation block. This distinction is important, as both can look similar but behave differently.
How to Identify a Mitigation Block on the Chart
Once traders understand how mitigation blocks form, the next step is identifying them directly on a price chart. This process focuses on reading market structure and spotting where momentum starts to weaken.
Although mitigation blocks can appear across different markets and timeframes, the identification process follows a simple sequence:
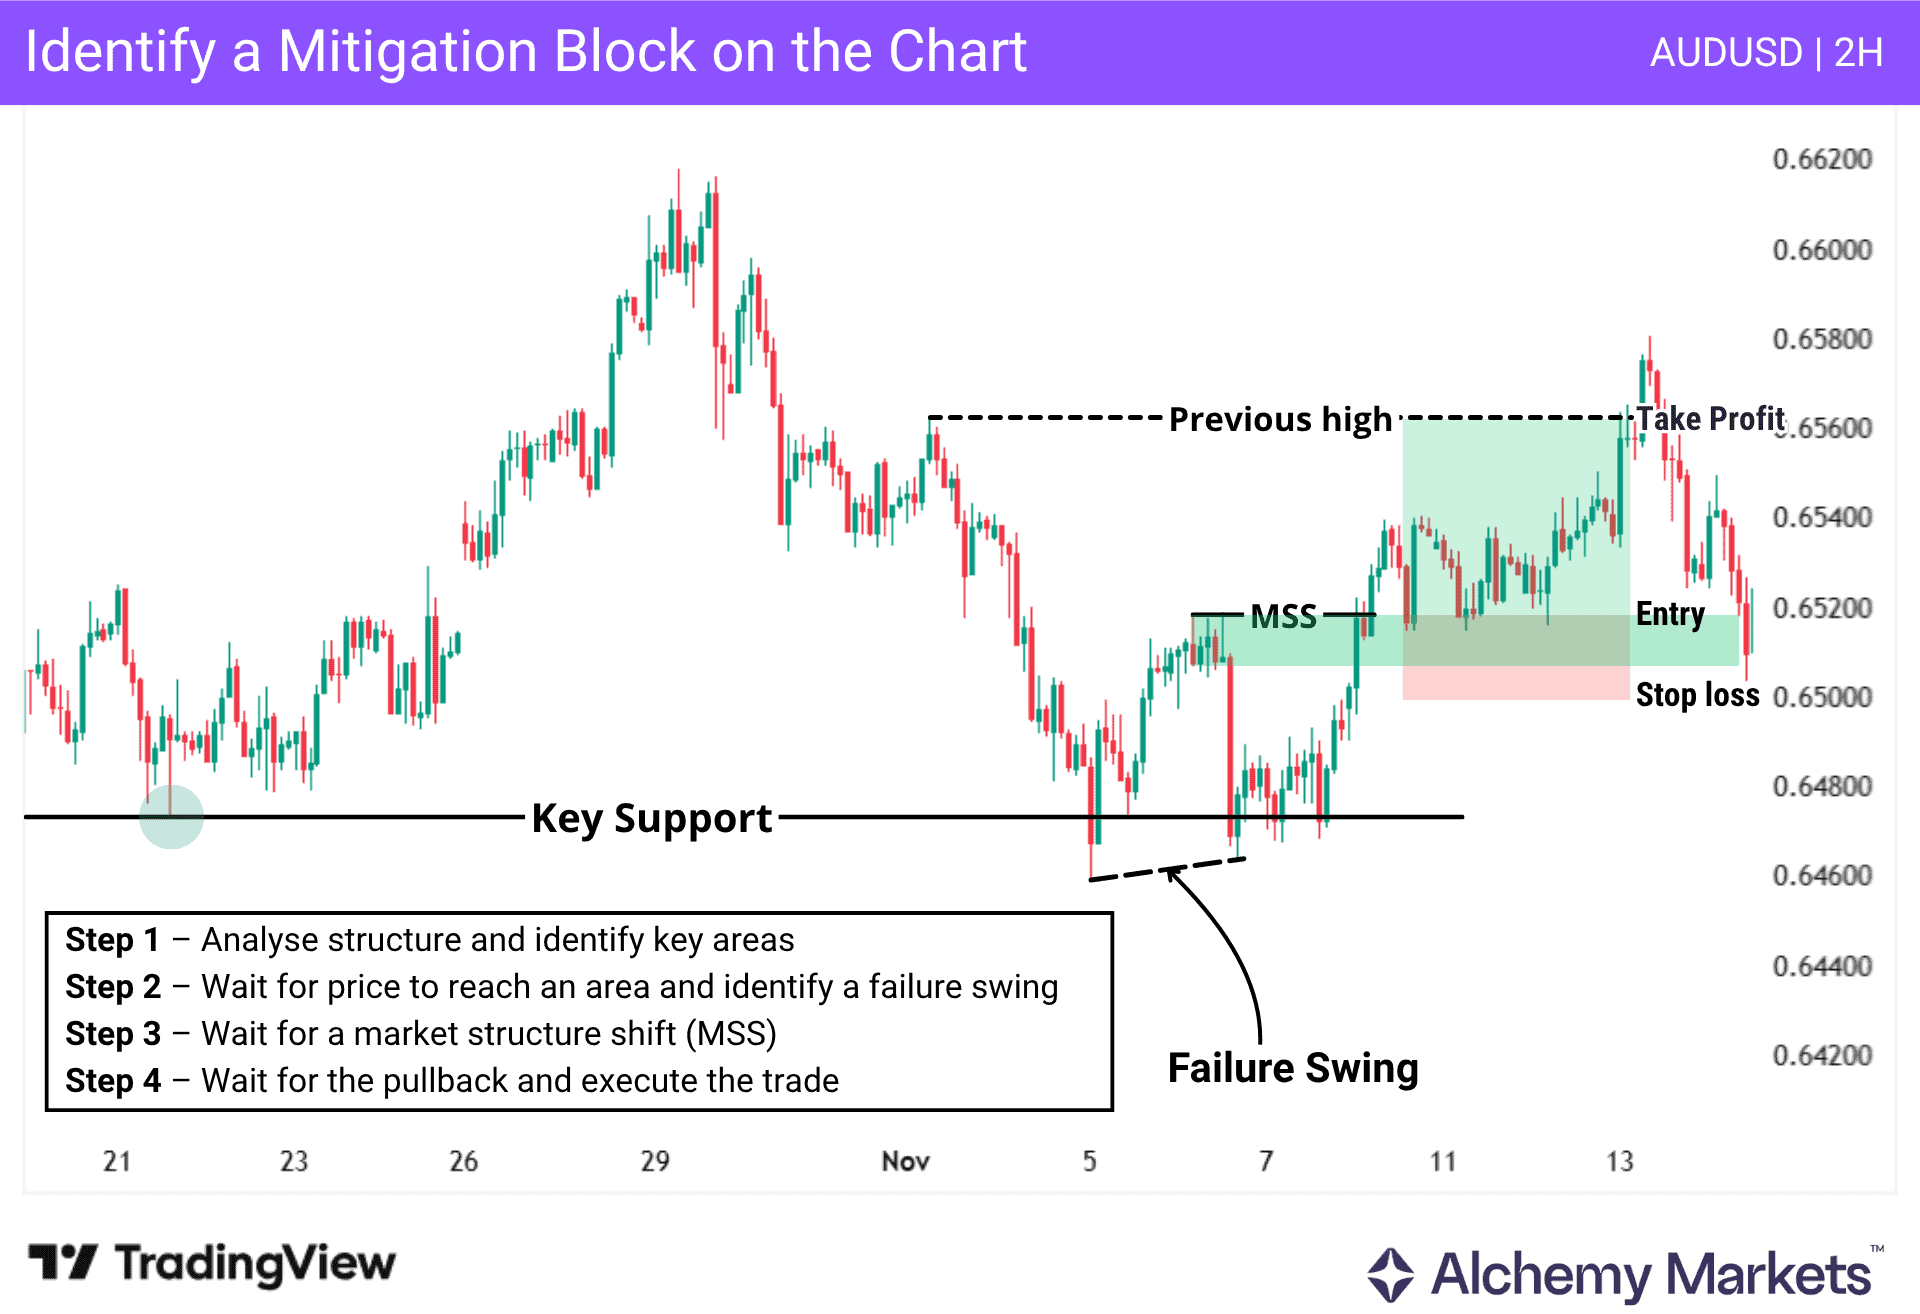
Step 1 – Analyse Structure and Identify Key Areas
Start by analysing structure on a higher timeframe such as H1, H4, or the daily chart to identify the overall trend. Higher timeframes provide clearer structure and filter out noise. For day trading, traders can use H1 or M15 for context, then drop to M5 or M1 to refine the mitigation block entry.
Look for whether price is forming higher highs and higher lows, or lower highs and lower lows.
Then mark key areas where price is likely to react, such as support and resistance, order blocks, fair value gaps, or previous highs and lows. Mitigation blocks tend to form around these meaningful zones.
Step 2 – Wait for Price to Reach an Area and Identify a Failure Swing
Wait for the price to reach one of your marked areas. Once it does, look for a failed continuation, where price is unable to extend further and forms a failure swing.
Step 3 – Wait for a Shift in Structure (MSS / CHoCH or BOS)
After the failure swing, look for a shift in structure. This can appear as a Market Structure Shift (MSS), also known as Change of Character (CHoCH), or a Break of Structure (BOS). This signals that the previous move is weakening and that price may begin shifting direction or forming a pullback.
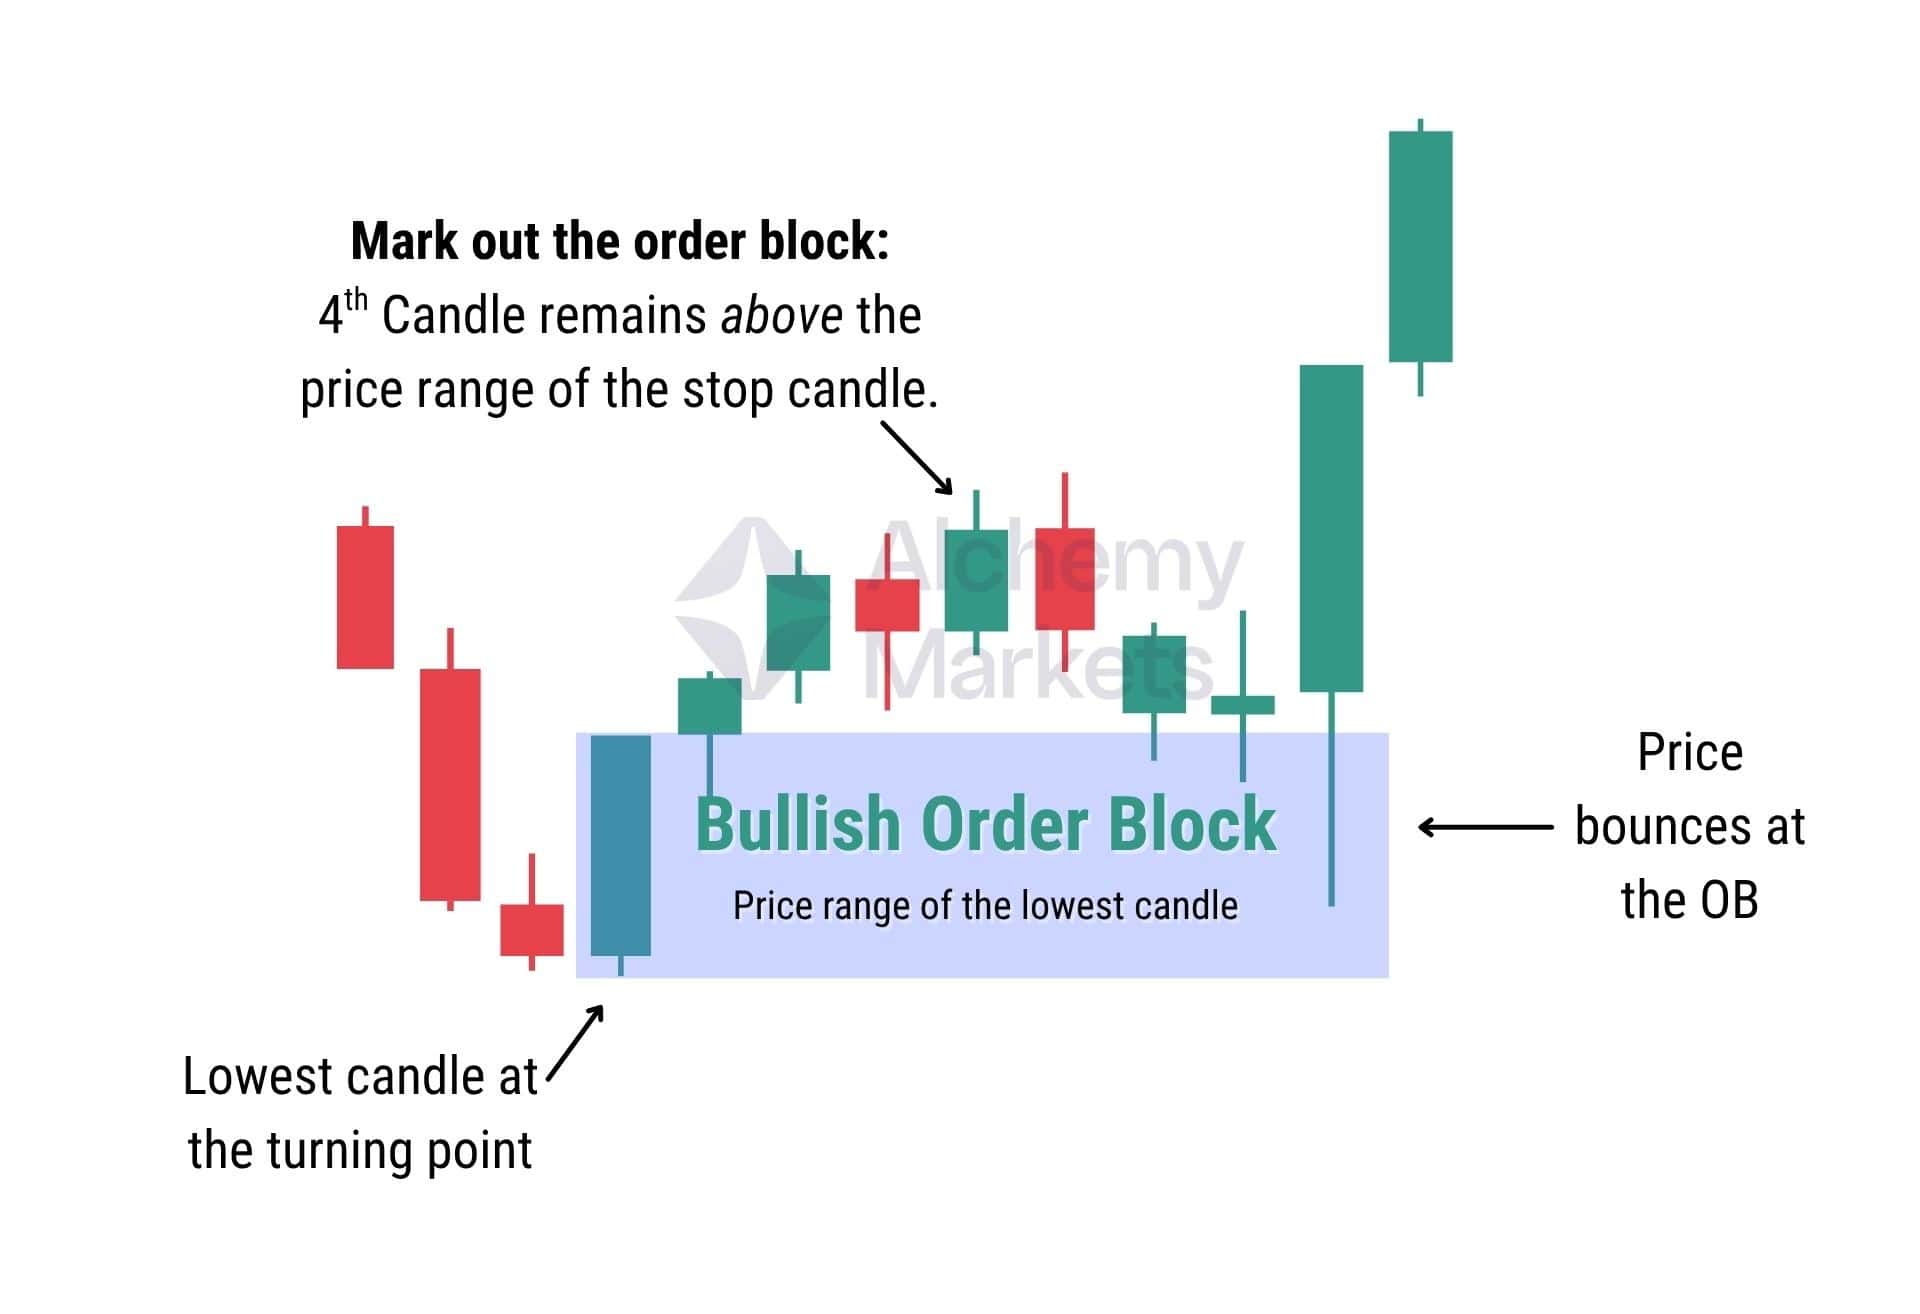
Once this happens, identify the mitigation block as the order block that gets broken. This is typically the last opposing candle before the move that breaks structure.
As a custom rule, you can use our 4-candlestick validation rule to be considered a valid order block, this filters out a wide range of false signals. However, this is optional and not mandatory.
Step 4 – Wait for the Pullback and Execute the Trade
Wait for price to pull back into the mitigation block. Entries can be taken at the level or with confirmation. Place the stop loss beyond the block, and target logical areas such as previous highs or lows.
For entry, there are many techniques:
- You may use simple limit orders at the MB so that when price reaches it, the trade opens automatically.
- You may use confirmation entries, such as waiting for an opposite candle to form after price reaches the MB.
- You may wait for another MSS to happen at the MB. For this method, you can reduce the timeframe to see the structure clearly and identify MSS more easily.
- You may use Fibonacci retracement to enter, such as entering at 50% of the MB, or between 61.8% – 78.6%.
- Each one of these methods is good but differs in terms of risk-reward outcomes and frequency of opportunities. You can backtest to find the best option that fits your trading.
Mitigation Block Examples
Understanding the concept is important, but seeing how mitigation blocks form within a clear market context helps traders identify higher-probability setups.
Let’s look at bullish and bearish examples of mitigation blocks, focusing on how context and confluence strengthen these setups and improve their reliability.
Bullish Mitigation Block Example
In this example, price forms a demand zone and later returns to it while creating a sequence of lower highs and lower lows. When price reaches the zone, it fails to break the previous low, forming a failure swing.
Price then shifts in the opposite direction and creates a market structure shift (MSS), establishing the mitigation block. After that, price pulls back into the mitigation block and reacts from it.
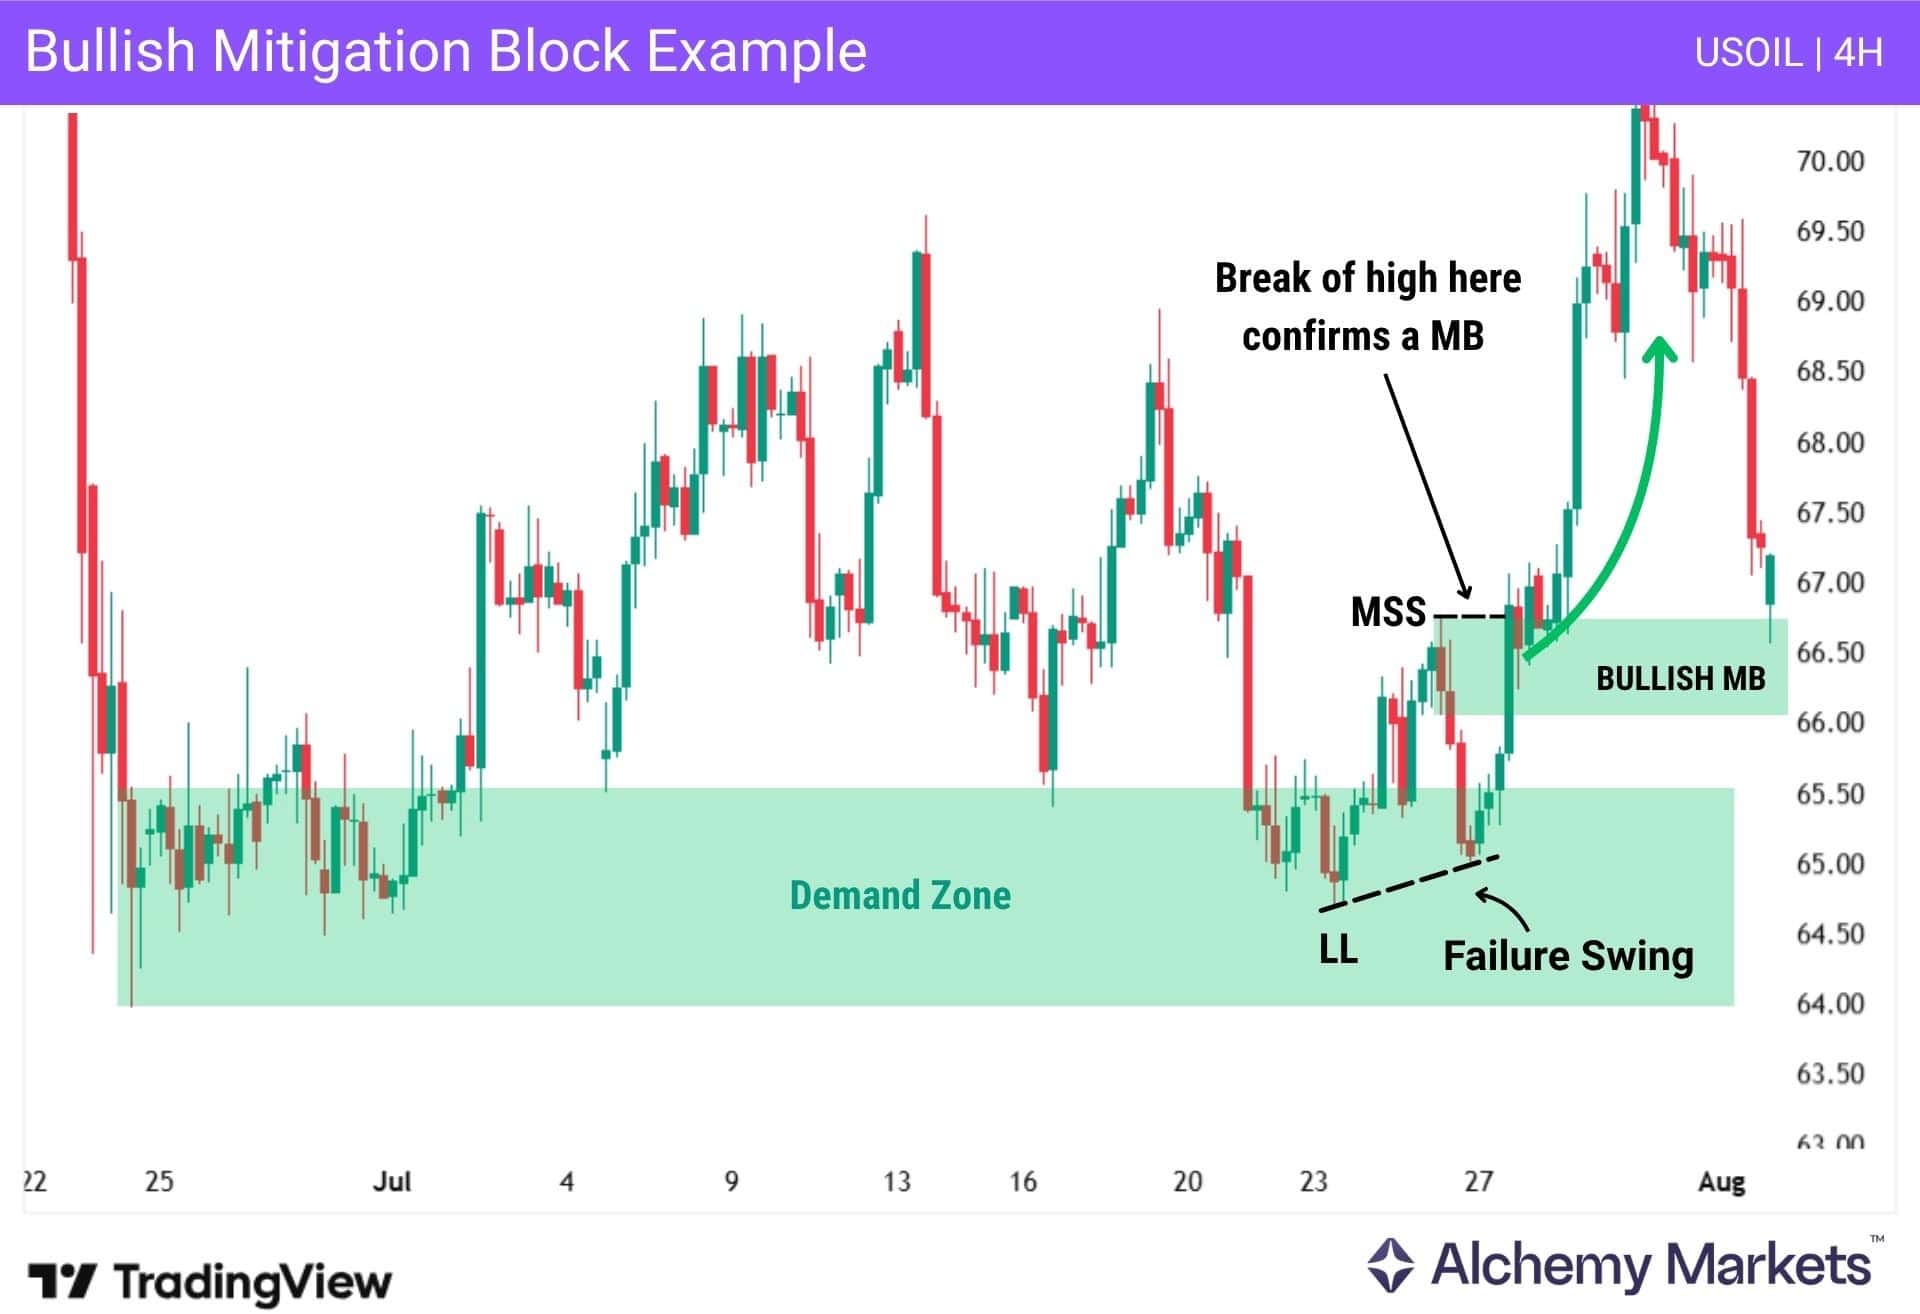
In this case, the demand zone provides the context for the setup and gives additional confirmation to the bullish mitigation block.
Bearish Mitigation Block Example
For this example, let’s take a look at a multi-timeframe approach. This approach allows us to find day trading setups by first finding a key level with an expected outcome — in this case, a bearish rejection from a resistance order block — then going into a lower timeframe to find the mitigation block setup.
Higher-Timeframe (2H)
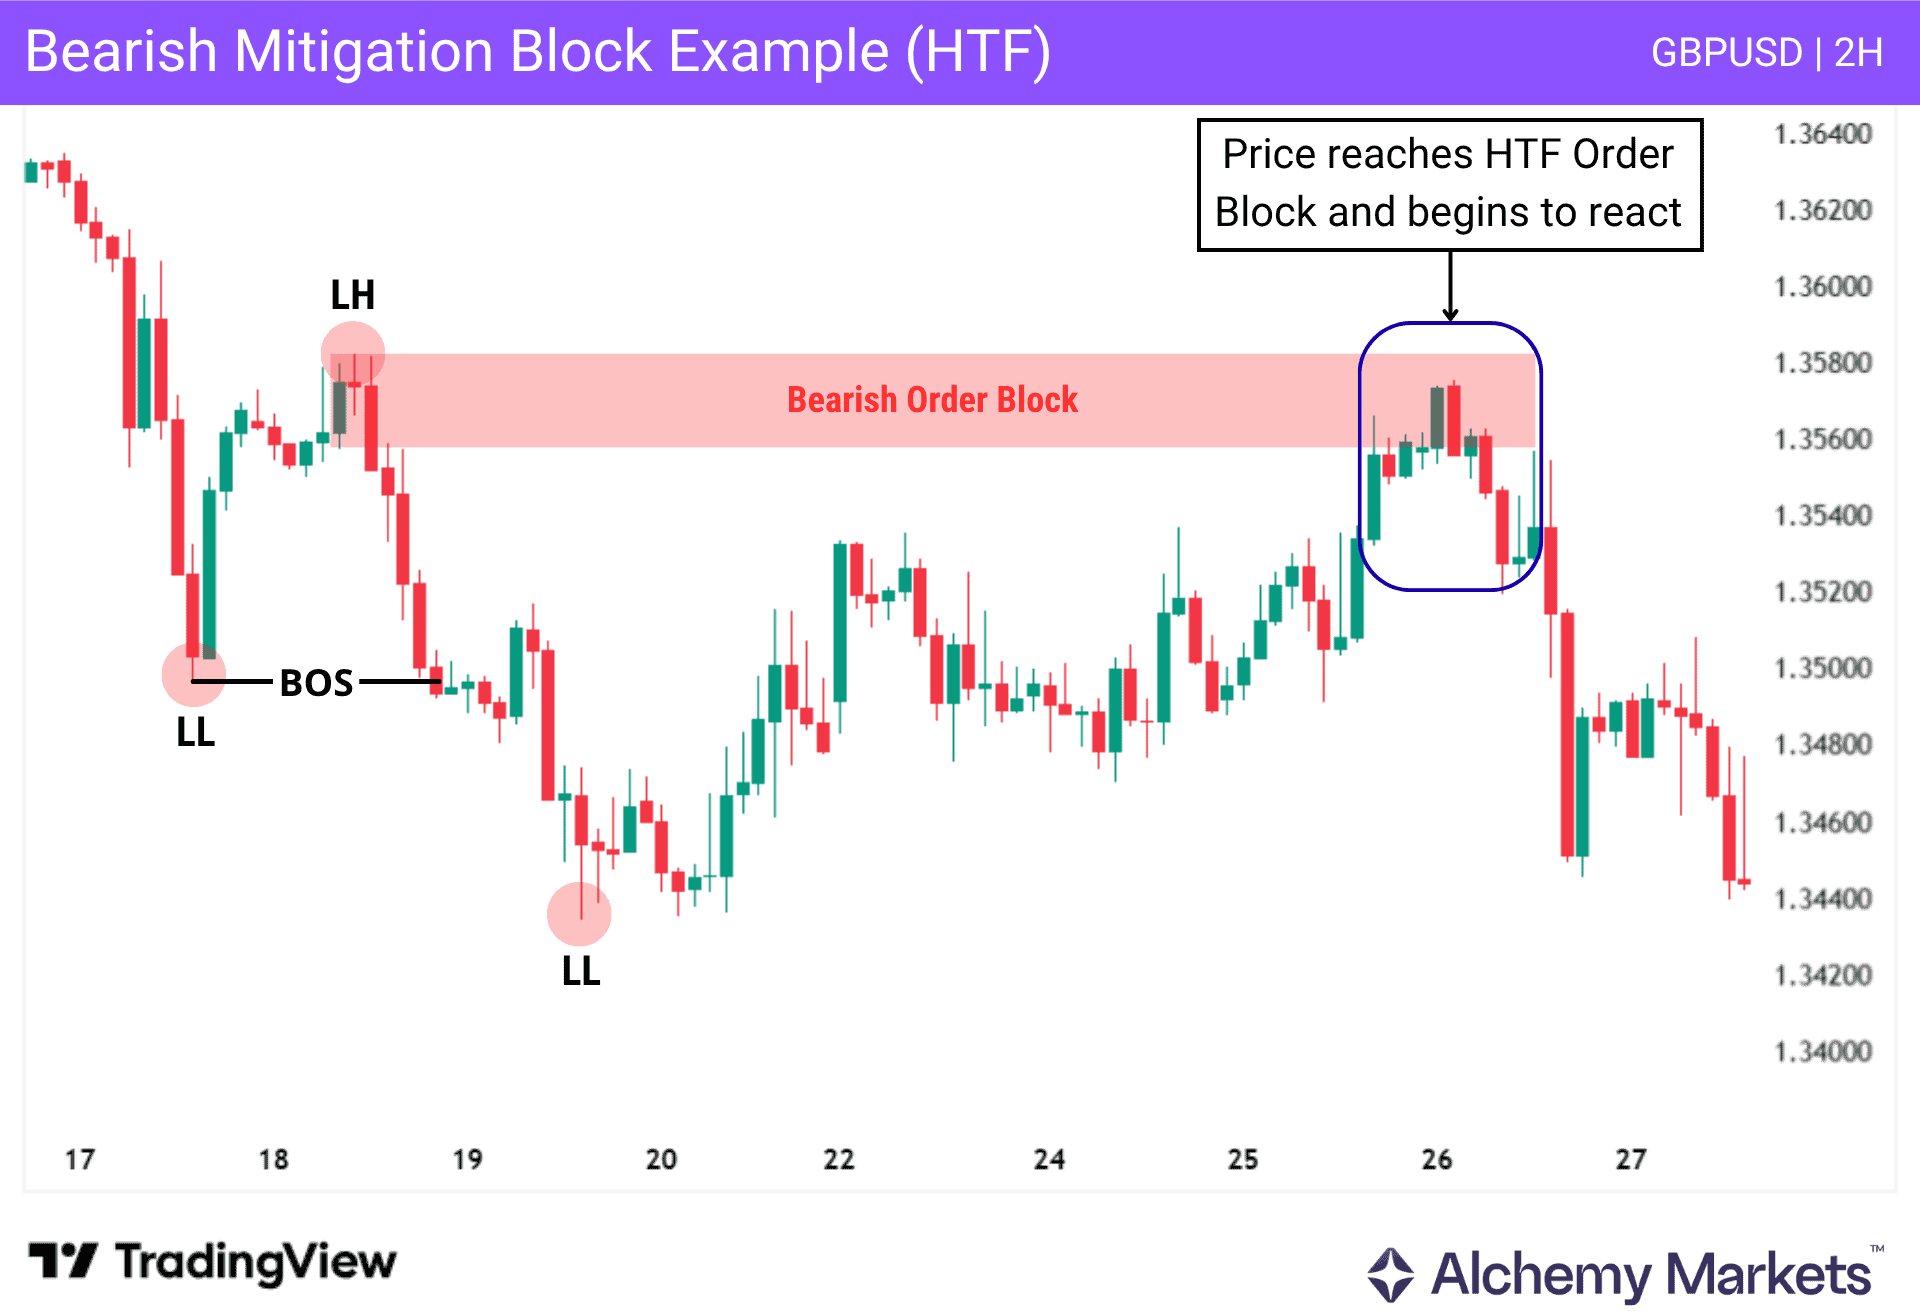
In this chart, GBPUSD on the 2H timeframe is in a downtrend, forming a lower high and a lower low. Price then creates a bearish order block, later retraces to it, and starts reacting.
Lower-Timeframe (15m)
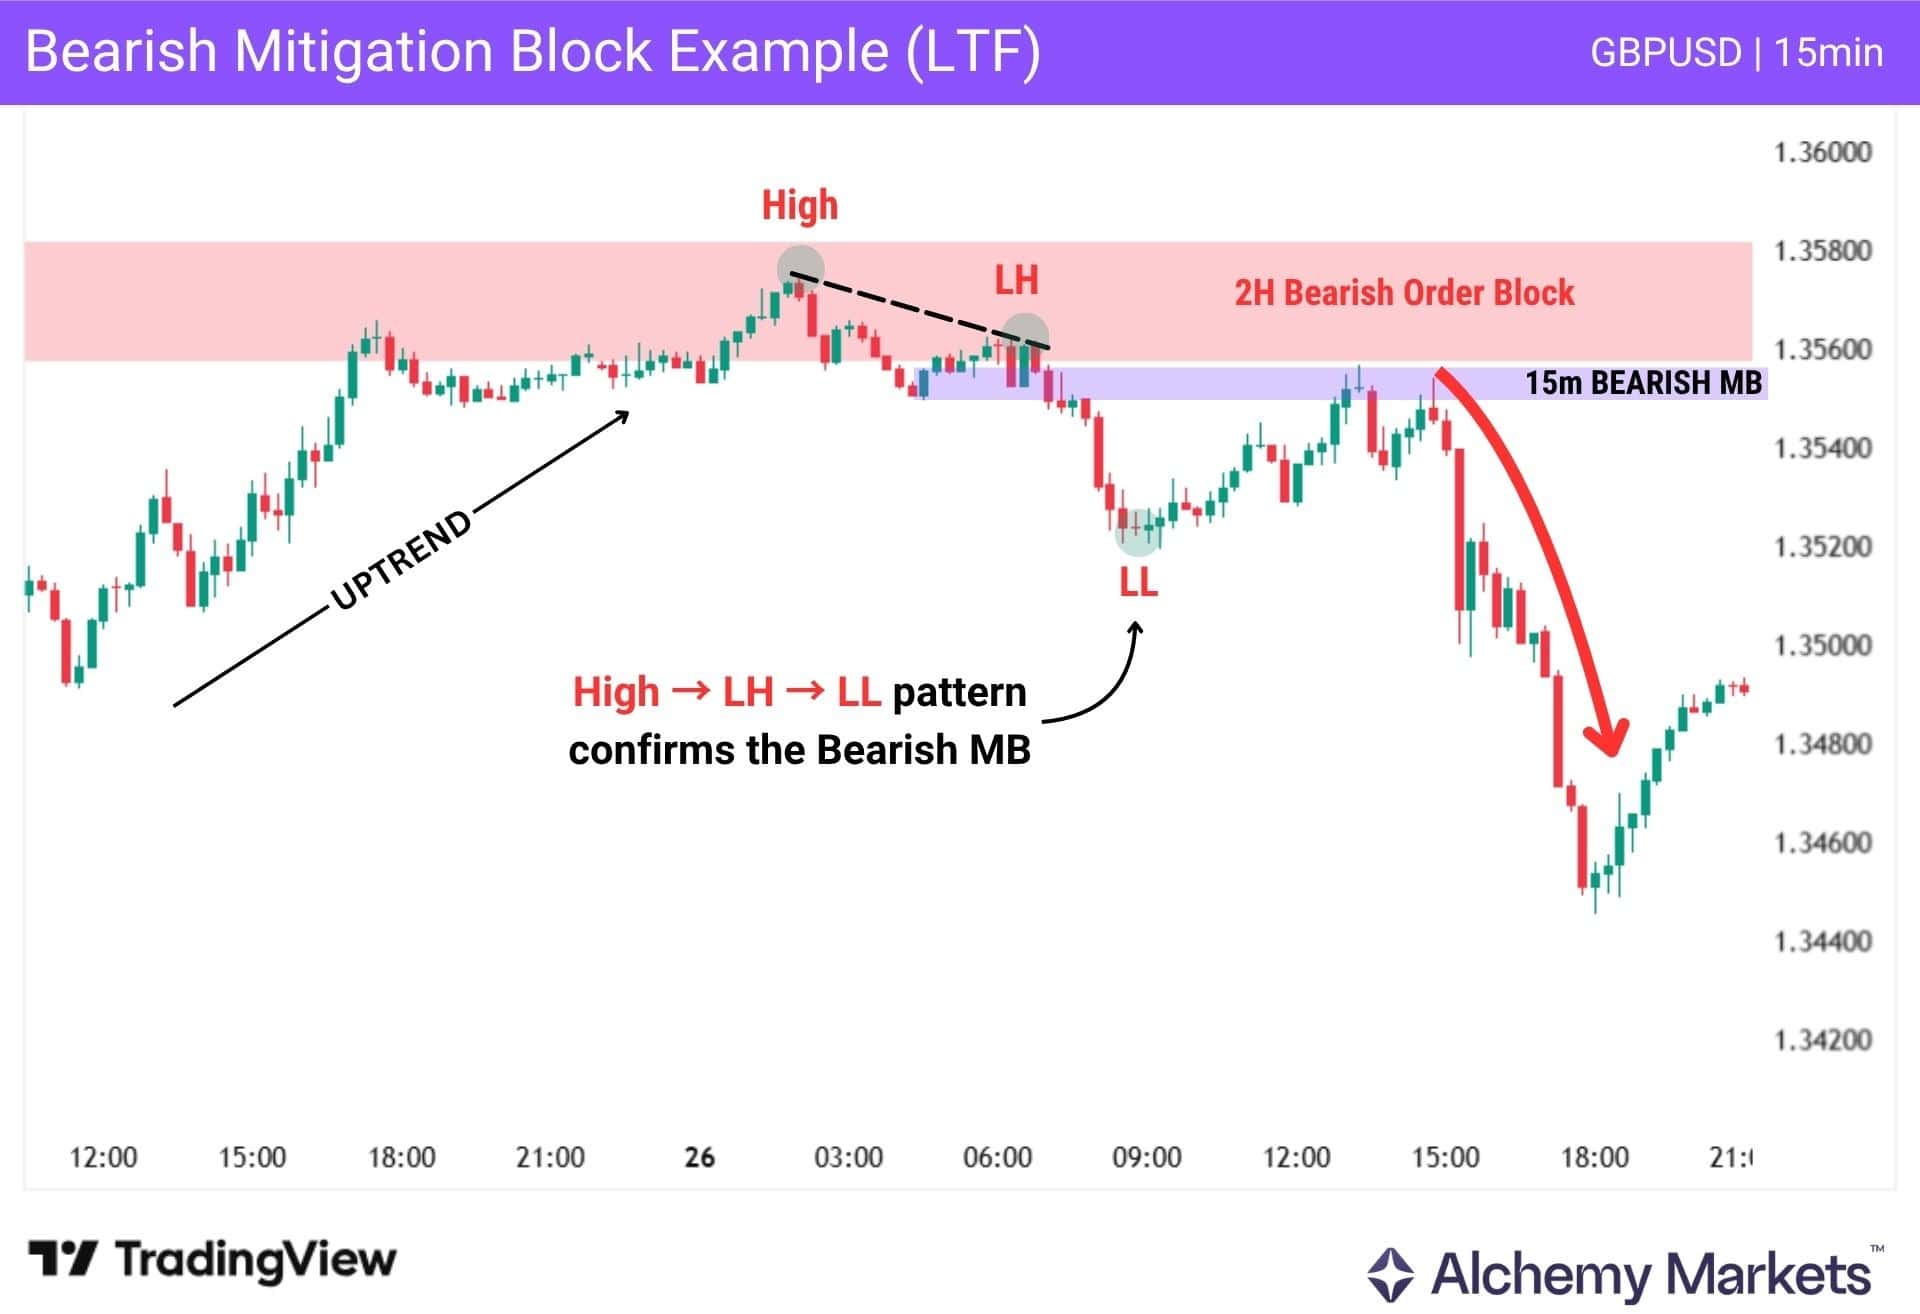
When we zoom into the lower timeframe (15 minutes we can see more detail in price behaviour. Price reaches the higher-timeframe order block, forming a series of higher highs and higher lows.
Once price reaches the middle of the order block, it fails to break the previous high and instead reverses lower, showing bearish behaviour and creating a market structure shift (MSS), which establishes a bearish mitigation block before price reacts from it.
In this setup, the higher timeframe provides the context through the bearish structure and the area of interest (HTF order block), while the lower timeframe provides the MSS and the mitigation block for confirmation. When both timeframes align, the setup becomes stronger and gives more weight to the bearish mitigation block.
Mitigation Block Trading Strategies
Mitigation blocks are rarely used alone, as their effectiveness increases when combined with other tools that provide context and confirmation. Traders focus on how price approaches key levels, where a possible shift occurs, and how the mitigation block forms within that move.
This helps refine entry points, increase the probability of a successful mitigation block setup, improve risk management, and better anticipate future price movements.
Below are the most common strategies used in combination with mitigation blocks:
Mitigation Block with Fair Value Gaps (FVGs)
A fair value gap (FVG) can strengthen a mitigation block by adding context and confirmation to the setup. It can be used in different ways:
- As a key area of interest, where price approaches the imbalance and forms a mitigation block as structure begins to shift.
- As a confluence factor, when the FVG forms at the same area as the mitigation block.
- As an entry confirmation, when price returns to the mitigation block, starts reacting, and creates an FVG during the move.
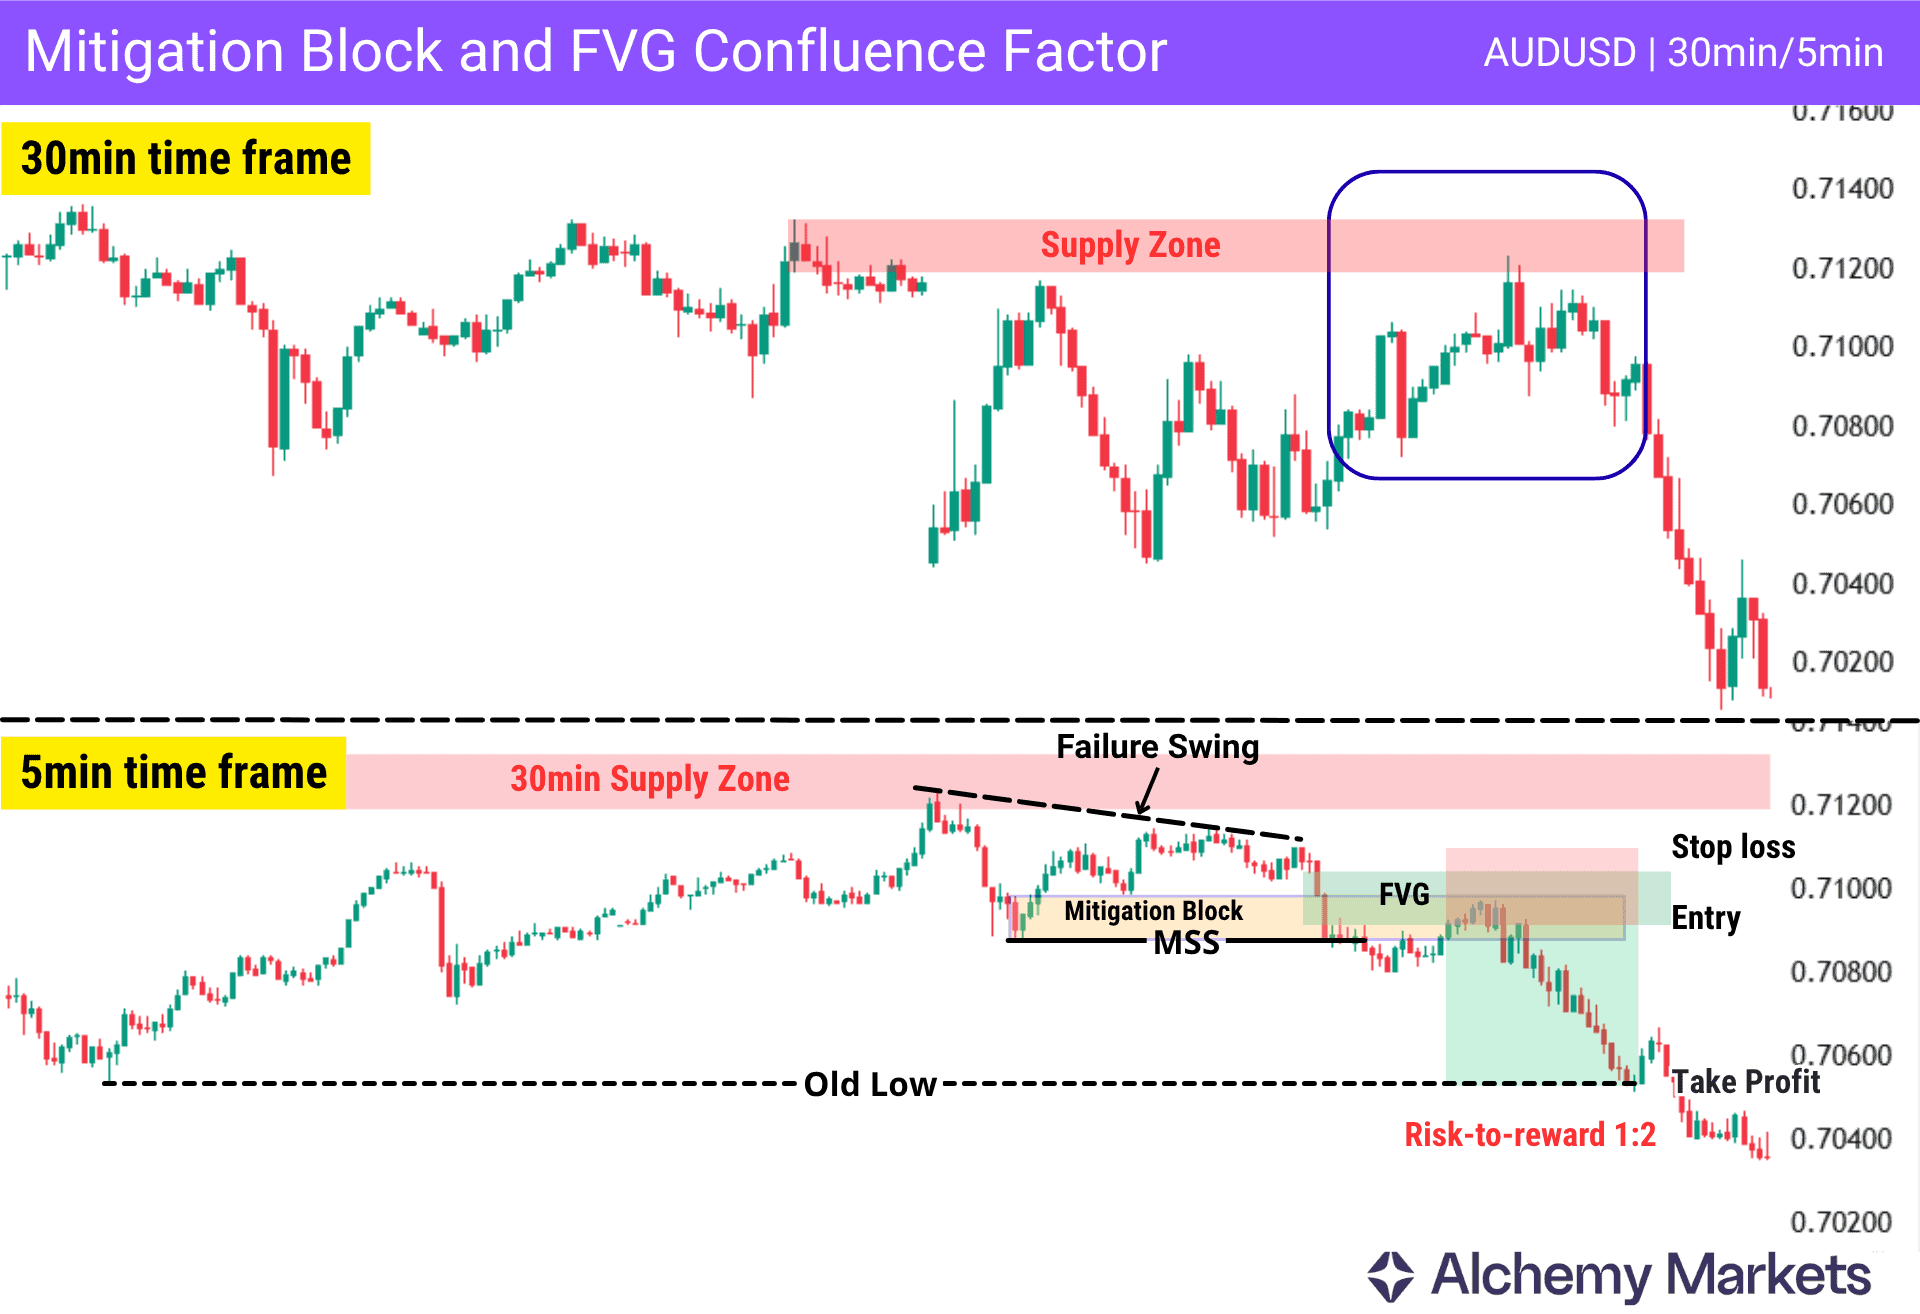
On the higher timeframe (30-minute chart), price shows a bearish trend, creates a supply zone, and retraces into it before starting to react.
When we zoom into the lower timeframe (5-minute chart), price fails to break the previous swing high at the supply zone, creating a failure swing. It then makes a market structure shift (MSS) to the downside, forming a bearish mitigation block and an FVG.
The FVG forms around the same area and acts as a confluence factor with the mitigation block, supporting the entry, with the stop loss above the zone and the target at the old low.
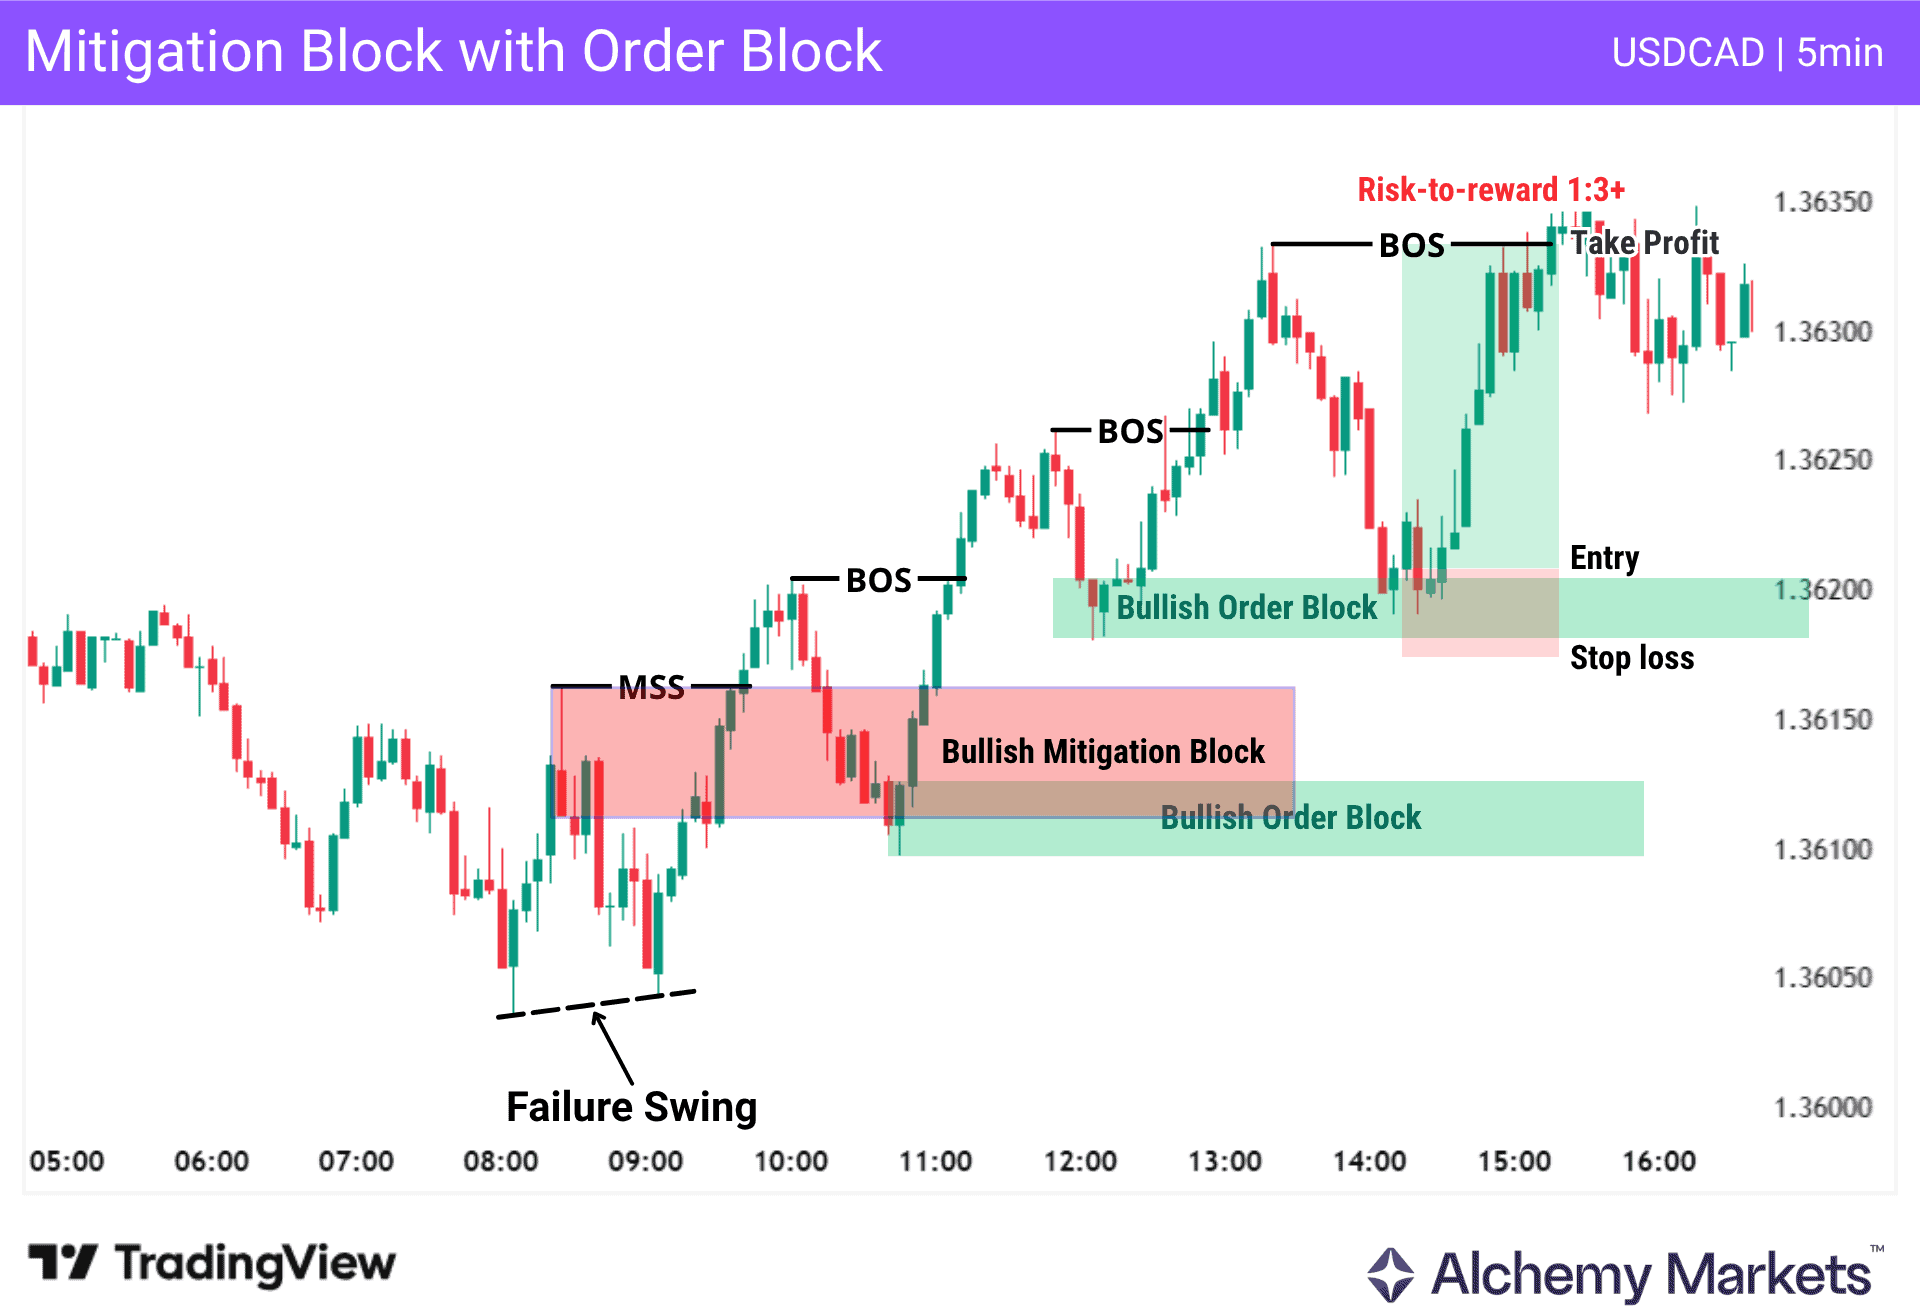
Mitigation Block with Break of Structure (BOS)
A break of structure (BOS) is an important concept in market structure analysis, as it helps identify potential continuation in price. When used with mitigation blocks, it can provide additional confirmation to the setup. The combination of a market structure shift (MSS) followed by a BOS helps support the idea of a new direction.
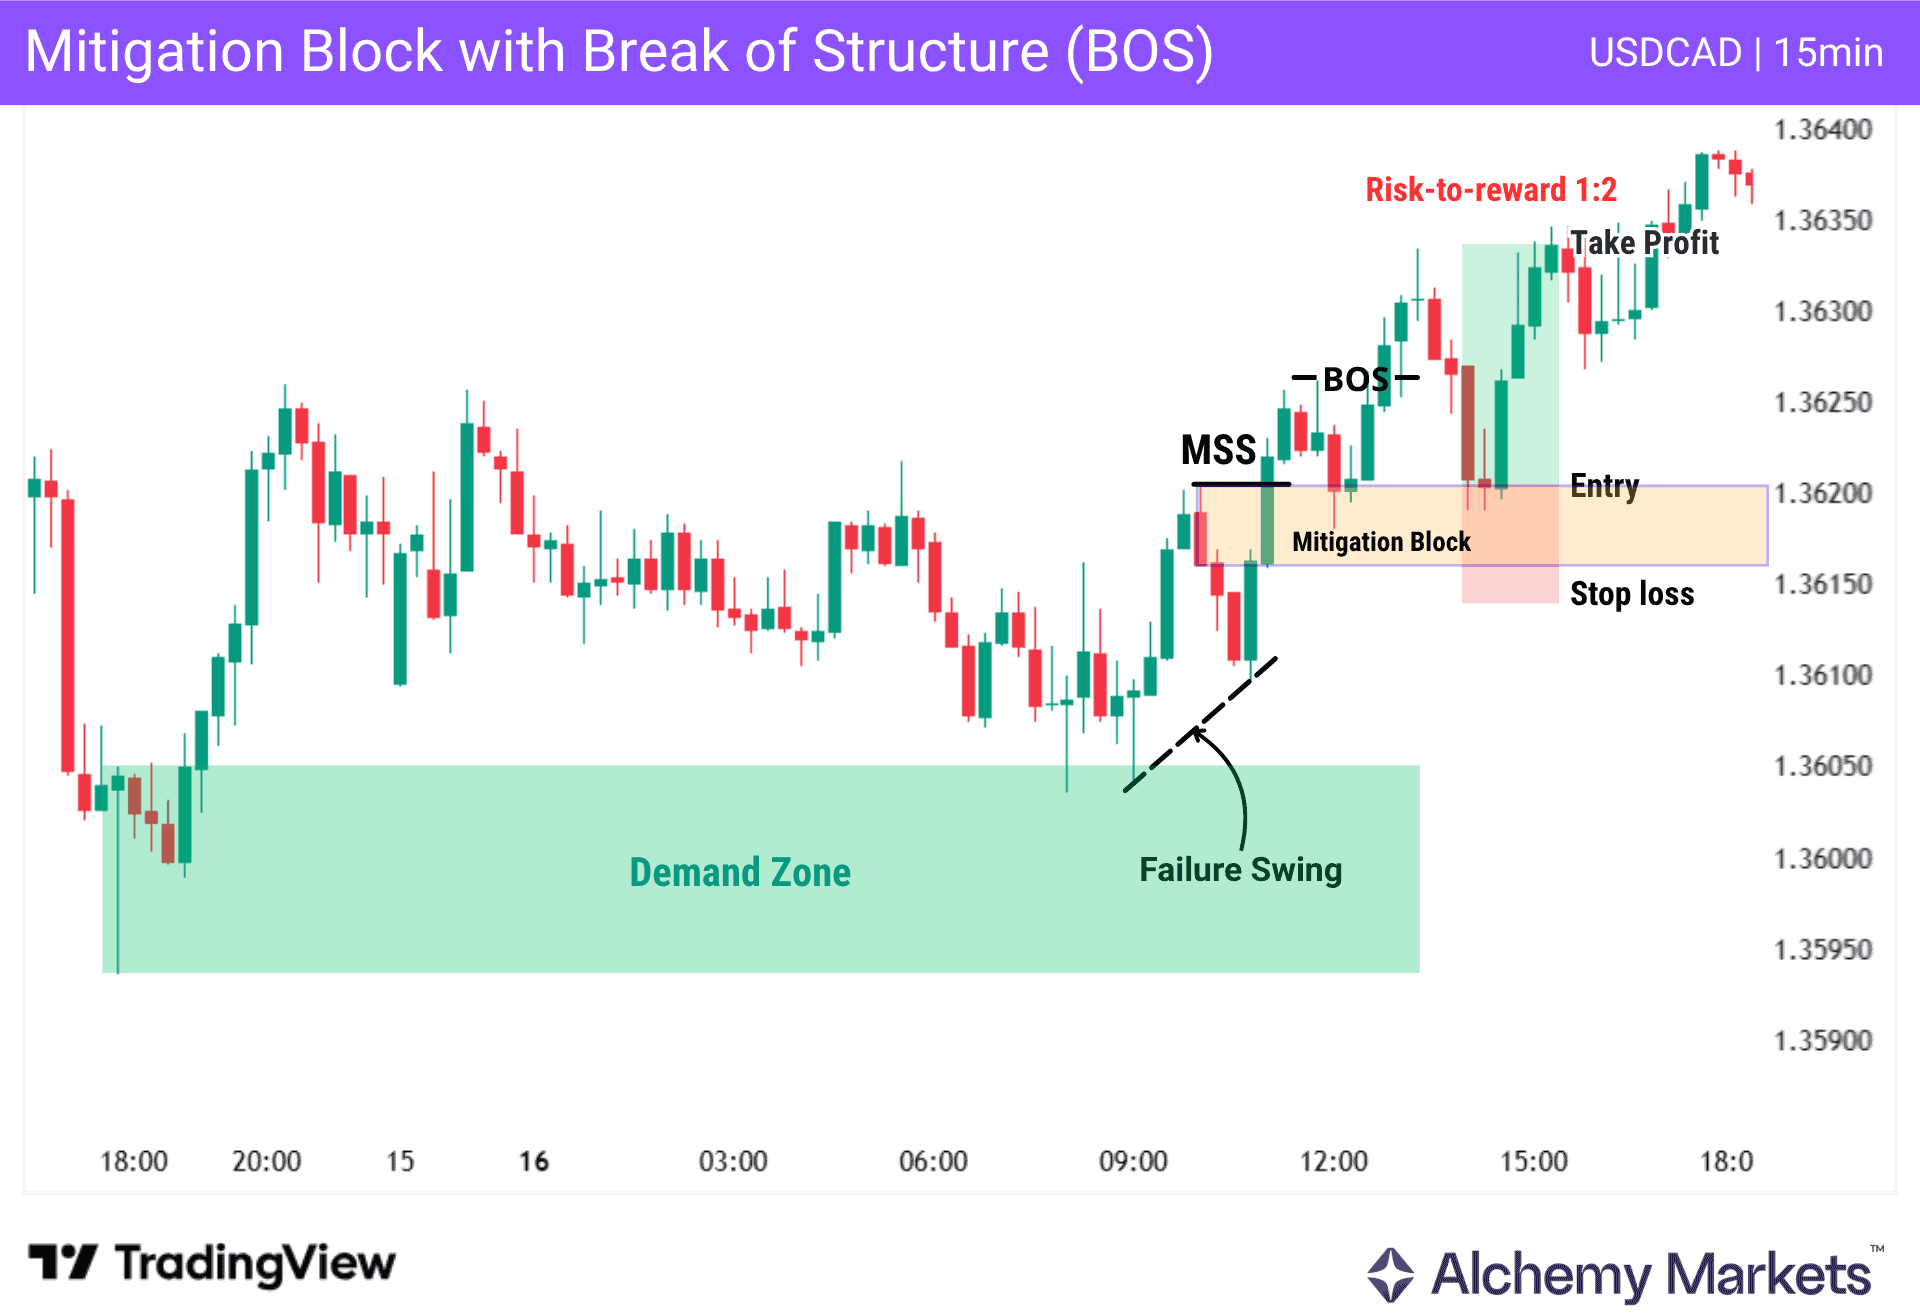
In this example, price forms a demand zone, then retraces into it and reacts, creating a failure swing. It then shifts direction and forms an MSS to the upside, with a mitigation block followed by a break of structure (BOS), supporting a possible continuation.
When price returns to the mitigation block, it reacts from the zone, supporting the entry, with the stop loss placed below the block and the target set at the previous high.
Mitigation Block with Moving Averages
Moving averages can add additional context to a mitigation block by helping identify the overall trend direction. When price approaches a key moving average, such as a simple moving average (SMA) or an exponential moving average (EMA), it may act as dynamic support or resistance.
If a mitigation block forms around this area, it can strengthen the setup by aligning with the broader market direction.
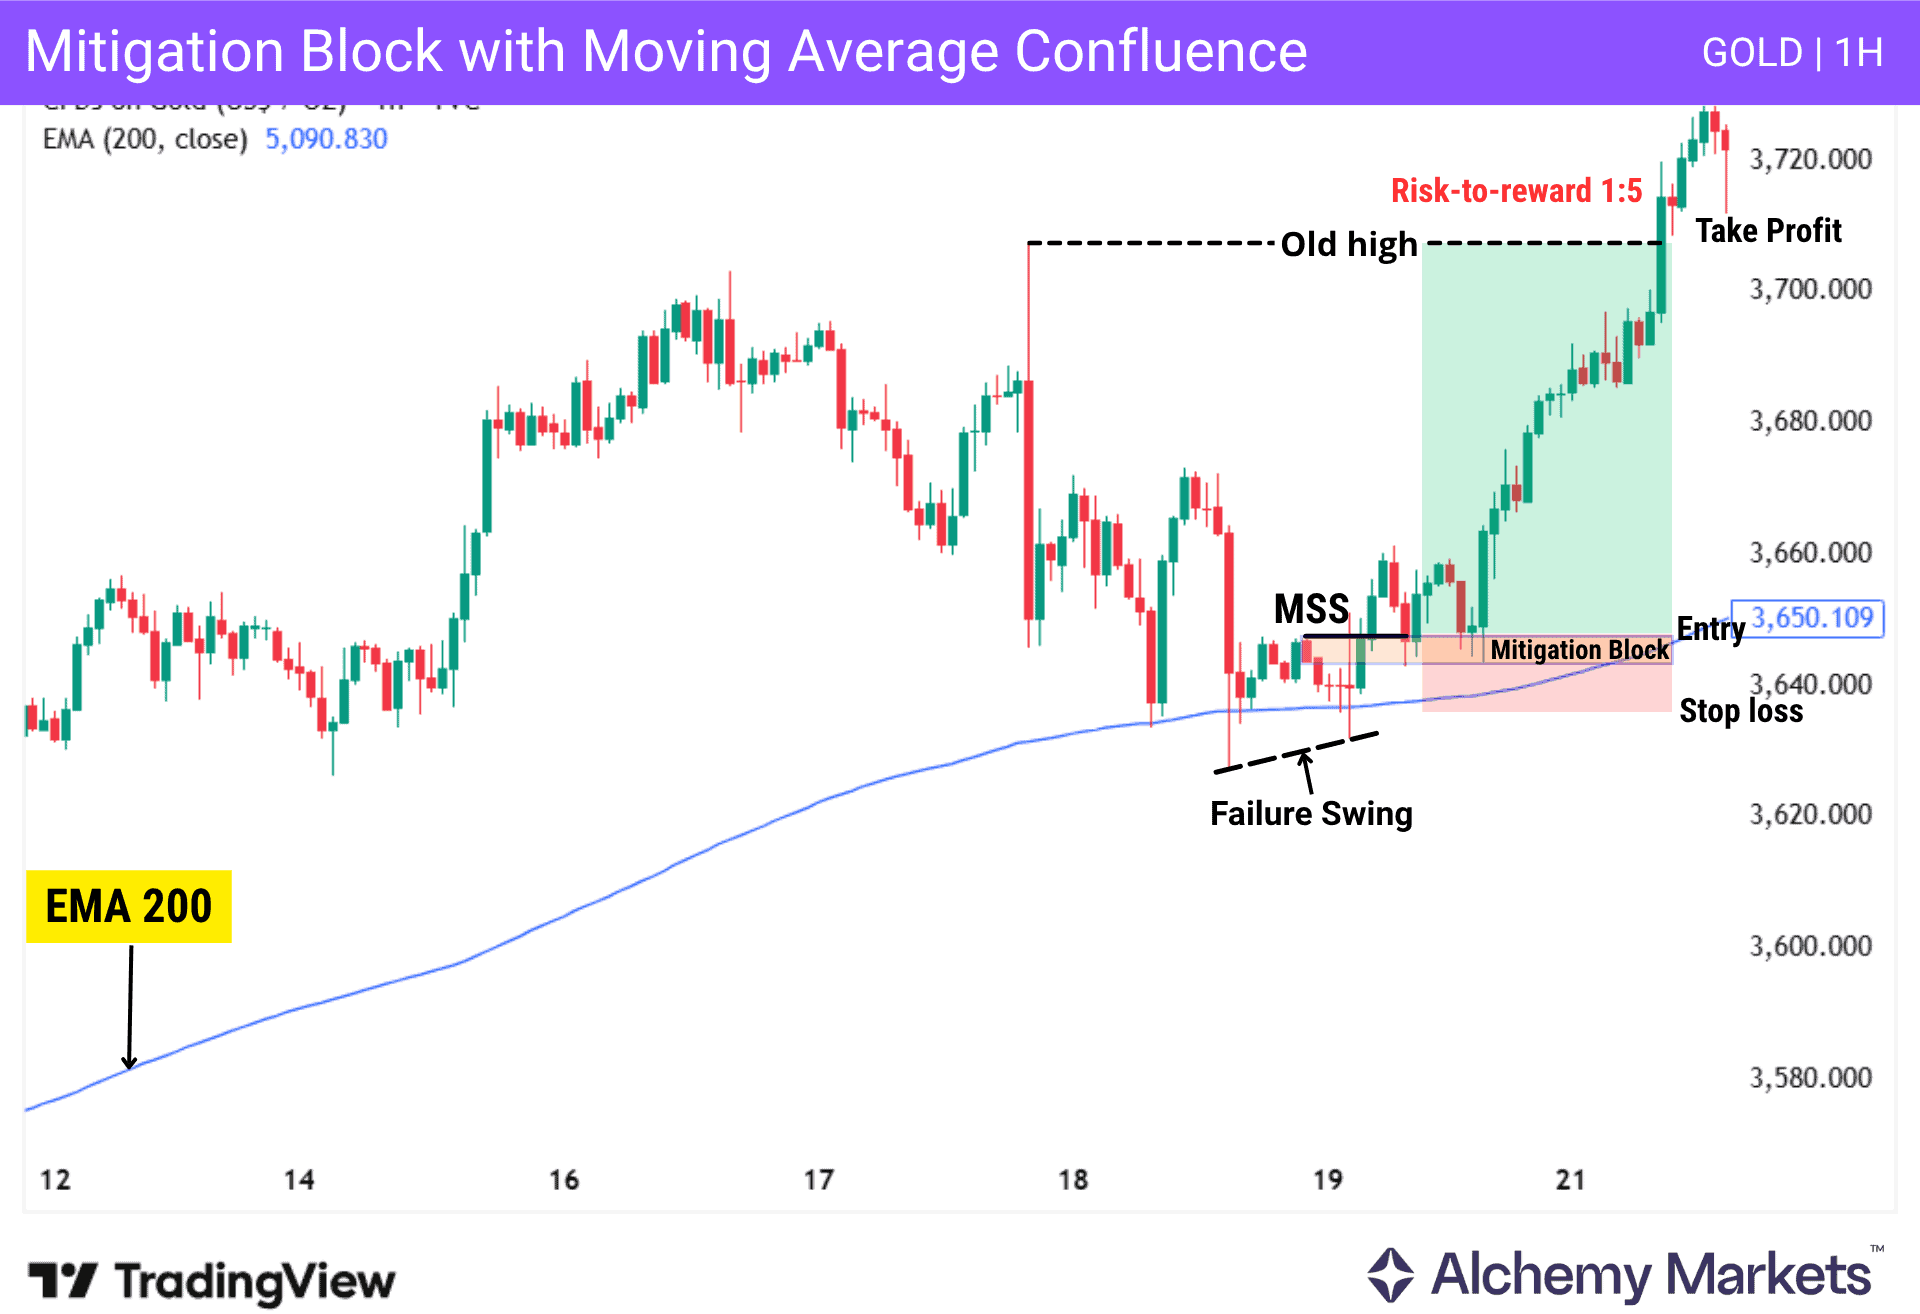
In this example, price approaches the 200 EMA and reacts from it, showing that the moving average is acting as dynamic support. As price tests the area, it fails to break the recent low, forming a failure swing, and then creates an MSS to the upside, establishing a bullish mitigation block.
When price returns to the mitigation block, it reacts from the zone and continues higher in line with the direction of the EMA. Entry is taken at the mitigation block, with the stop loss placed below the moving average for added safety and the target set at the previous high.
Mitigation Block with Fibonacci Retracements
Fibonacci retracements can help identify where price may pull back within a trend. Traders often focus on the 0.50 level, which separates premium and discount, or on deeper retracement levels such as 0.618–0.786, as these levels can act as key areas of interest.
If a mitigation block forms within this range, it can strengthen the setup by aligning with pullbacks.
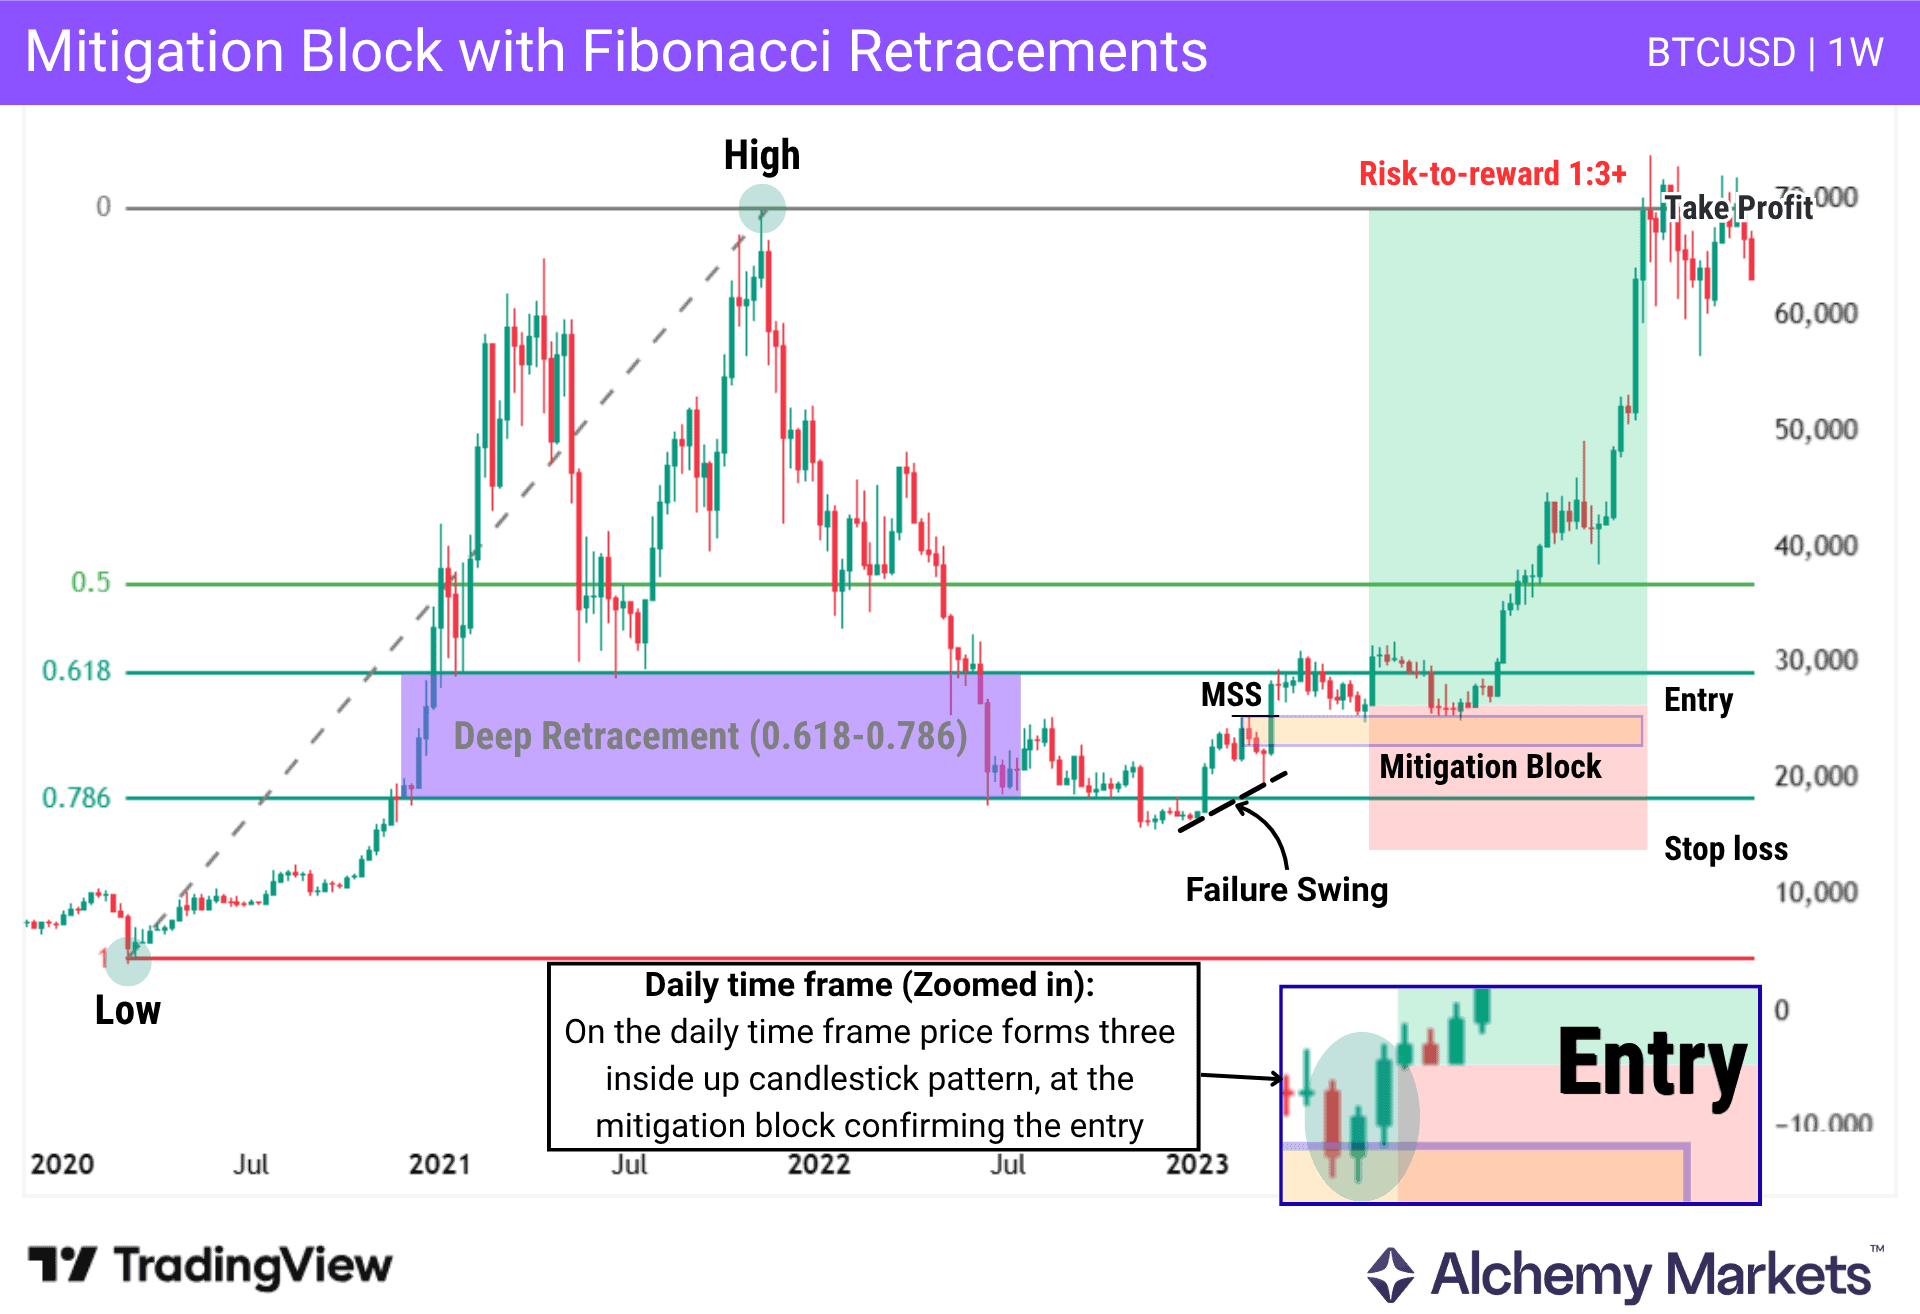
This chart represents the BTCUSD weekly time frame, with the Fibonacci retracement drawn from the lowest point to the highest price of the 2020–2021 move.
Price retraces into the deep retracement zone (0.618–0.786) with a series of lower highs and lower lows, and after moving below 0.786, it fails to break the previous low, creating a failure swing, then reverses to the upside with an MSS, establishing a bullish mitigation block.
When price returns to the mitigation block, it reacts from the area, and the entry is taken on the daily time frame after price forms a Three Inside Up candlestick pattern at the mitigation block, confirming the entry, with the stop loss placed below 0.786 and the target set at the high.
Mitigation Block with Volume Profile
Volume Profile can add context to a mitigation block by showing where the highest trading activity occurred within a specific range. The Point of Control (POC), which represents the level with the most volume, can act as a key area of interest.
For example, a fixed range volume profile can help confirm whether a mitigation block is strong by forming around the Point of Control. This alignment shows that price is reacting from a high-activity area, and the POC can also help provide a more precise entry for the setup.
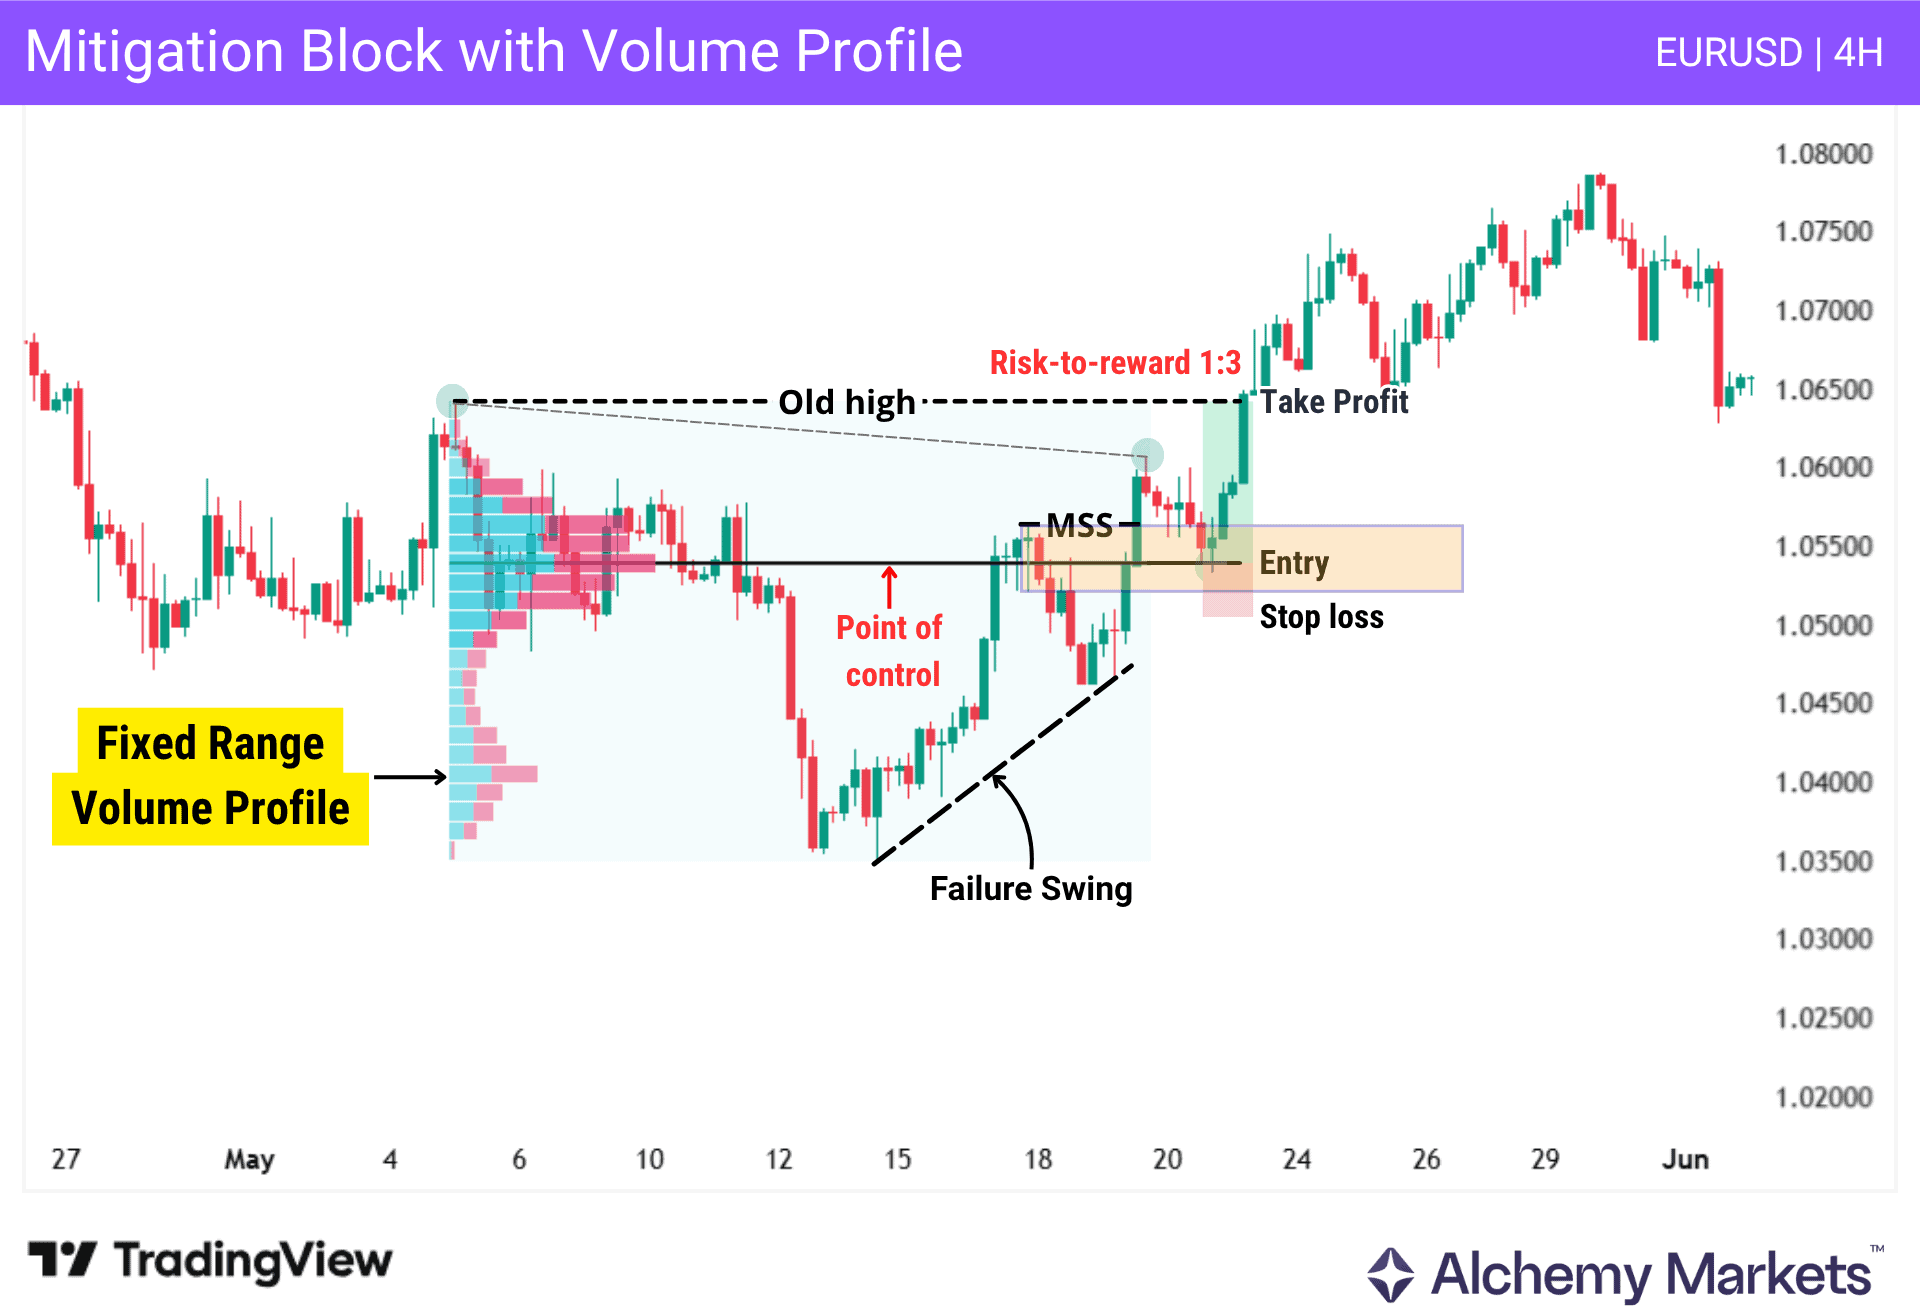
This chart shows a combination between a fixed range volume profile and a mitigation block. Price forms a failure swing and then creates an MSS to the upside, establishing a bullish mitigation block. The mitigation block aligns with the Point of Control, strengthening the setup.
When price returns to the mitigation block, it reacts from the zone, with the entry taken inside the mitigation block at the Point of Control, the stop loss placed below the block, and the target set at the old high.
Note: In this example, the fixed range volume profile is drawn from the swing high down to the first high formed after the MSS, covering the full price action before entering the trade.
Advantages of the Mitigation Block
Mitigation blocks can help traders identify structured setups by focusing on how price reacts after a possible shift in direction.
| Advantage | Explanation |
| Clearer entry points | The mitigation block provides defined entry points within a specific price zone, especially when price returns to the area. |
| Structured risk management | Traders can place stop losses beyond the block and target logical exit points such as a swing high or swing low. |
| Frequent opportunities | Mitigation blocks can provide signals whether price is forming a reversal, a pullback, or a continuation. |
| Works across all assets and time frames | It can be applied on both HTF and LTF, although higher time frames help filter noise. The best setups come from multi-timeframe analysis, using HTF for context and key areas of interest, and LTF for identifying the mitigation block and executing the trade. |
| Works well with confluence tools | When combined with FVG, Fibonacci, or Volume Profile, it can increase the probability of a strong setup. |
Disadvantages of the Mitigation Block
Mitigation blocks are useful, but they require proper context and experience to avoid low-quality setups.
| Disadvantage | Explanation |
| Sensitive to market conditions and false signals | During volatile conditions or strong momentum, price may ignore the mitigation block and move through the zone, leading to failed setups. |
| Weak without context and confirmation | Using a mitigation block without a key area of interest or relying solely on the pattern without confirmation can reduce the quality of the setup. |
| Requires experience | Mitigation blocks require more than just understanding the concept itself. Traders need to understand market structure, key confluences, and how different tools interact to identify high-quality setups. |
| Identification errors | Traders may misidentify the correct candle forming the mitigation block, which can lead to incorrect entry points and poor execution. |
What Works Best with Mitigation Blocks?
Mitigation blocks tend to perform best when they form around key price areas where the market is likely to react. These areas act as reference points for price and can increase the probability of a meaningful response.
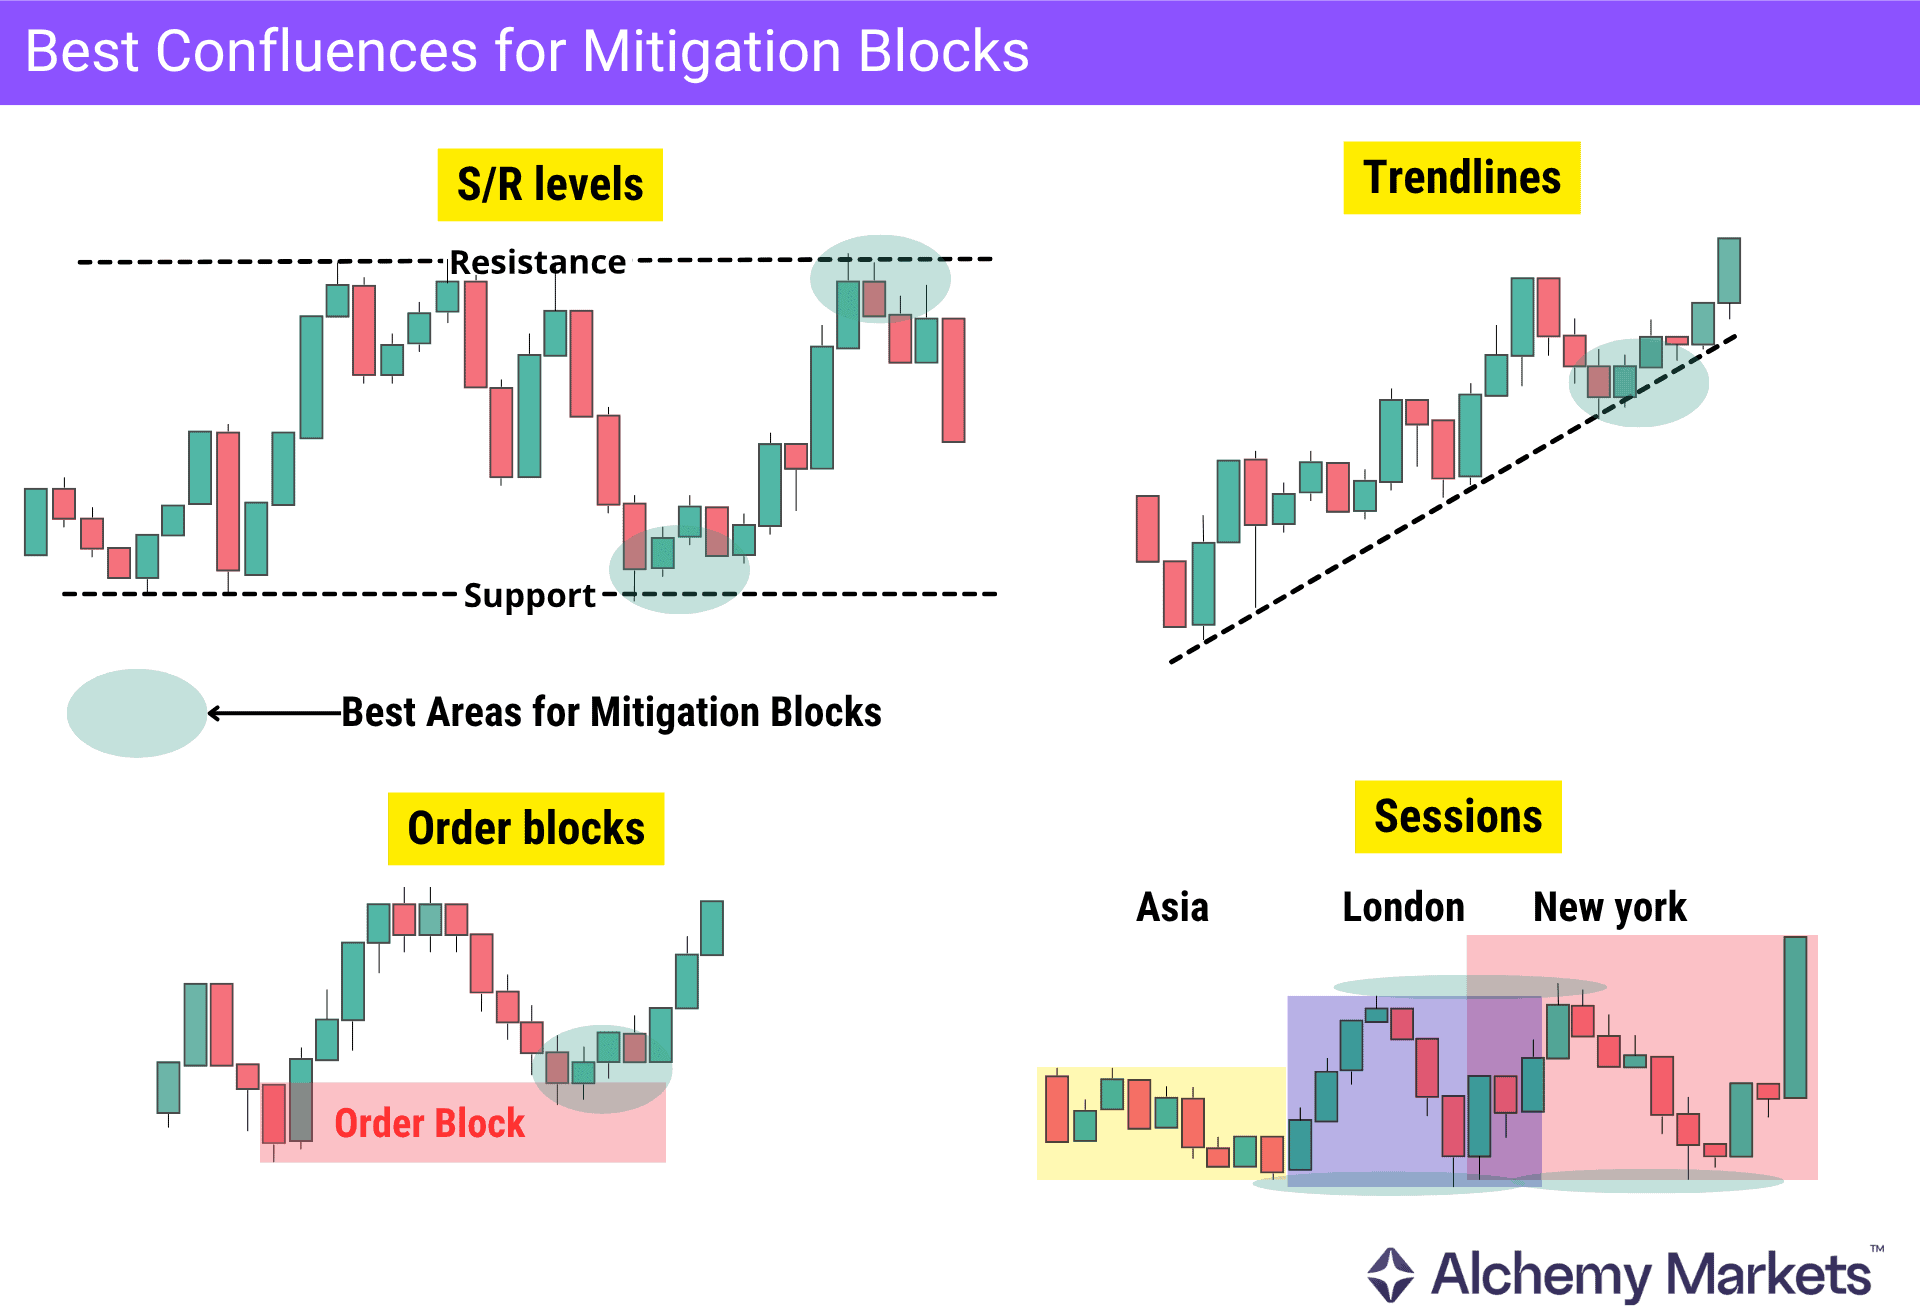
Key Levels
Common areas to watch include support and resistance, trendlines, old highs and lows, moving averages, and Fibonacci retracement levels. These zones often attract price and create conditions where a mitigation block can develop.
Key Zones
Supply and demand, order blocks (OBs), and fair value gaps (FVGs) represent areas of prior market activity and imbalance, where price may return to rebalance before continuing. When a mitigation block forms near these zones, it can strengthen the overall setup.
Session-Based Levels
Session highs and lows, such as Asia, London, and New York levels, also play a role. These areas often contain liquidity and can provide a clear context when mitigation blocks form around them.
Multi-Timeframe Analysis
Multi-timeframe analysis can further improve the reliability of mitigation blocks. Higher timeframes help identify the overall context and key zones, while lower timeframes provide more precise entries and confirmation.
Aligning a mitigation block on a lower timeframe with a key level from a higher timeframe can significantly improve decision-making and help validate the setup.
When multiple factors align within the same price zone, the setup becomes more structured and easier to validate. This type of confluence helps filter weaker setups and focus on higher-probability opportunities.
Mitigation Block vs Breaker Block
A mitigation block forms when price fails to continue a move and does not break the previous swing in the same direction (no break of structure), then shifts direction.
A breaker block forms after price breaks structure (BOS) and takes liquidity above a swing high or below a swing low before reversing. When price returns to that zone, it often reacts more aggressively due to trapped traders.
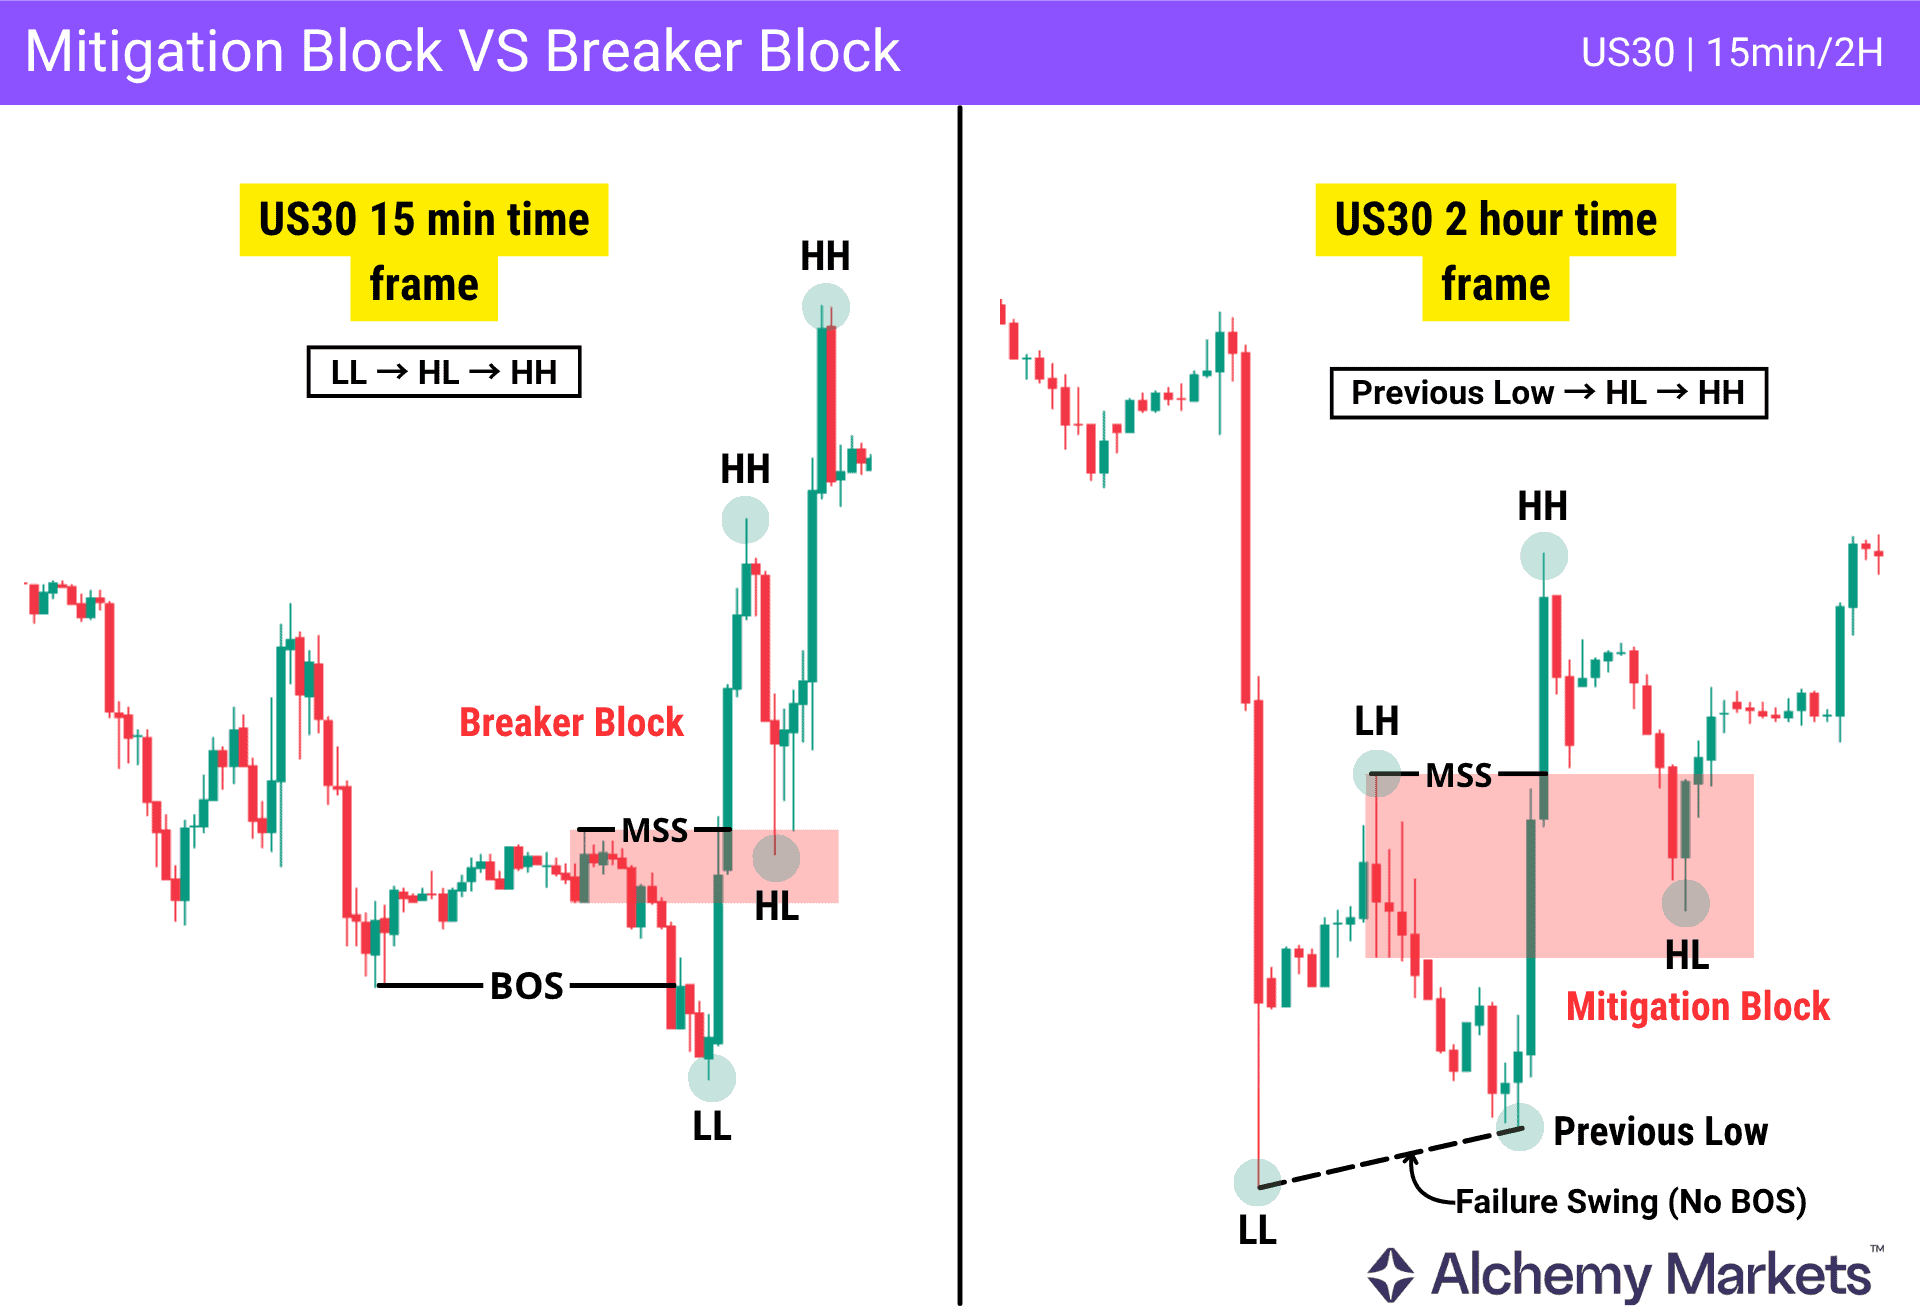
Key Differences
- Formation logic:
Mitigation block forms after a failure swing without a break of structure.
Breaker block forms after a break of structure, followed by a market structure shift (MSS) in the opposite direction. - Liquidity behaviour:
Mitigation block forms without a clear liquidity grab.
Breaker block typically forms after a liquidity grab or stop hunt. - Outcome:
Mitigation block can appear in a continuation, reversal, or pullback.
Breaker block is mainly associated with reversal behaviour. - Confluences:
Mitigation blocks require confluence and work best around key areas of interest.
Breaker blocks can still form without strong confluence, as they are driven by liquidity and structure breaks, but they are more reliable when aligned with key areas.
Mitigation Block vs Order Block
An order block represents the last bullish or bearish candle before a strong impulsive move, these zones show where price previously reacted to a rebalancing phase, where price reacts before continuing.
A mitigation block forms after a failure swing and market structure shift, when price revisits a zone linked to the previous move. This return reflects a rebalancing phase, where price reacts before continuing.
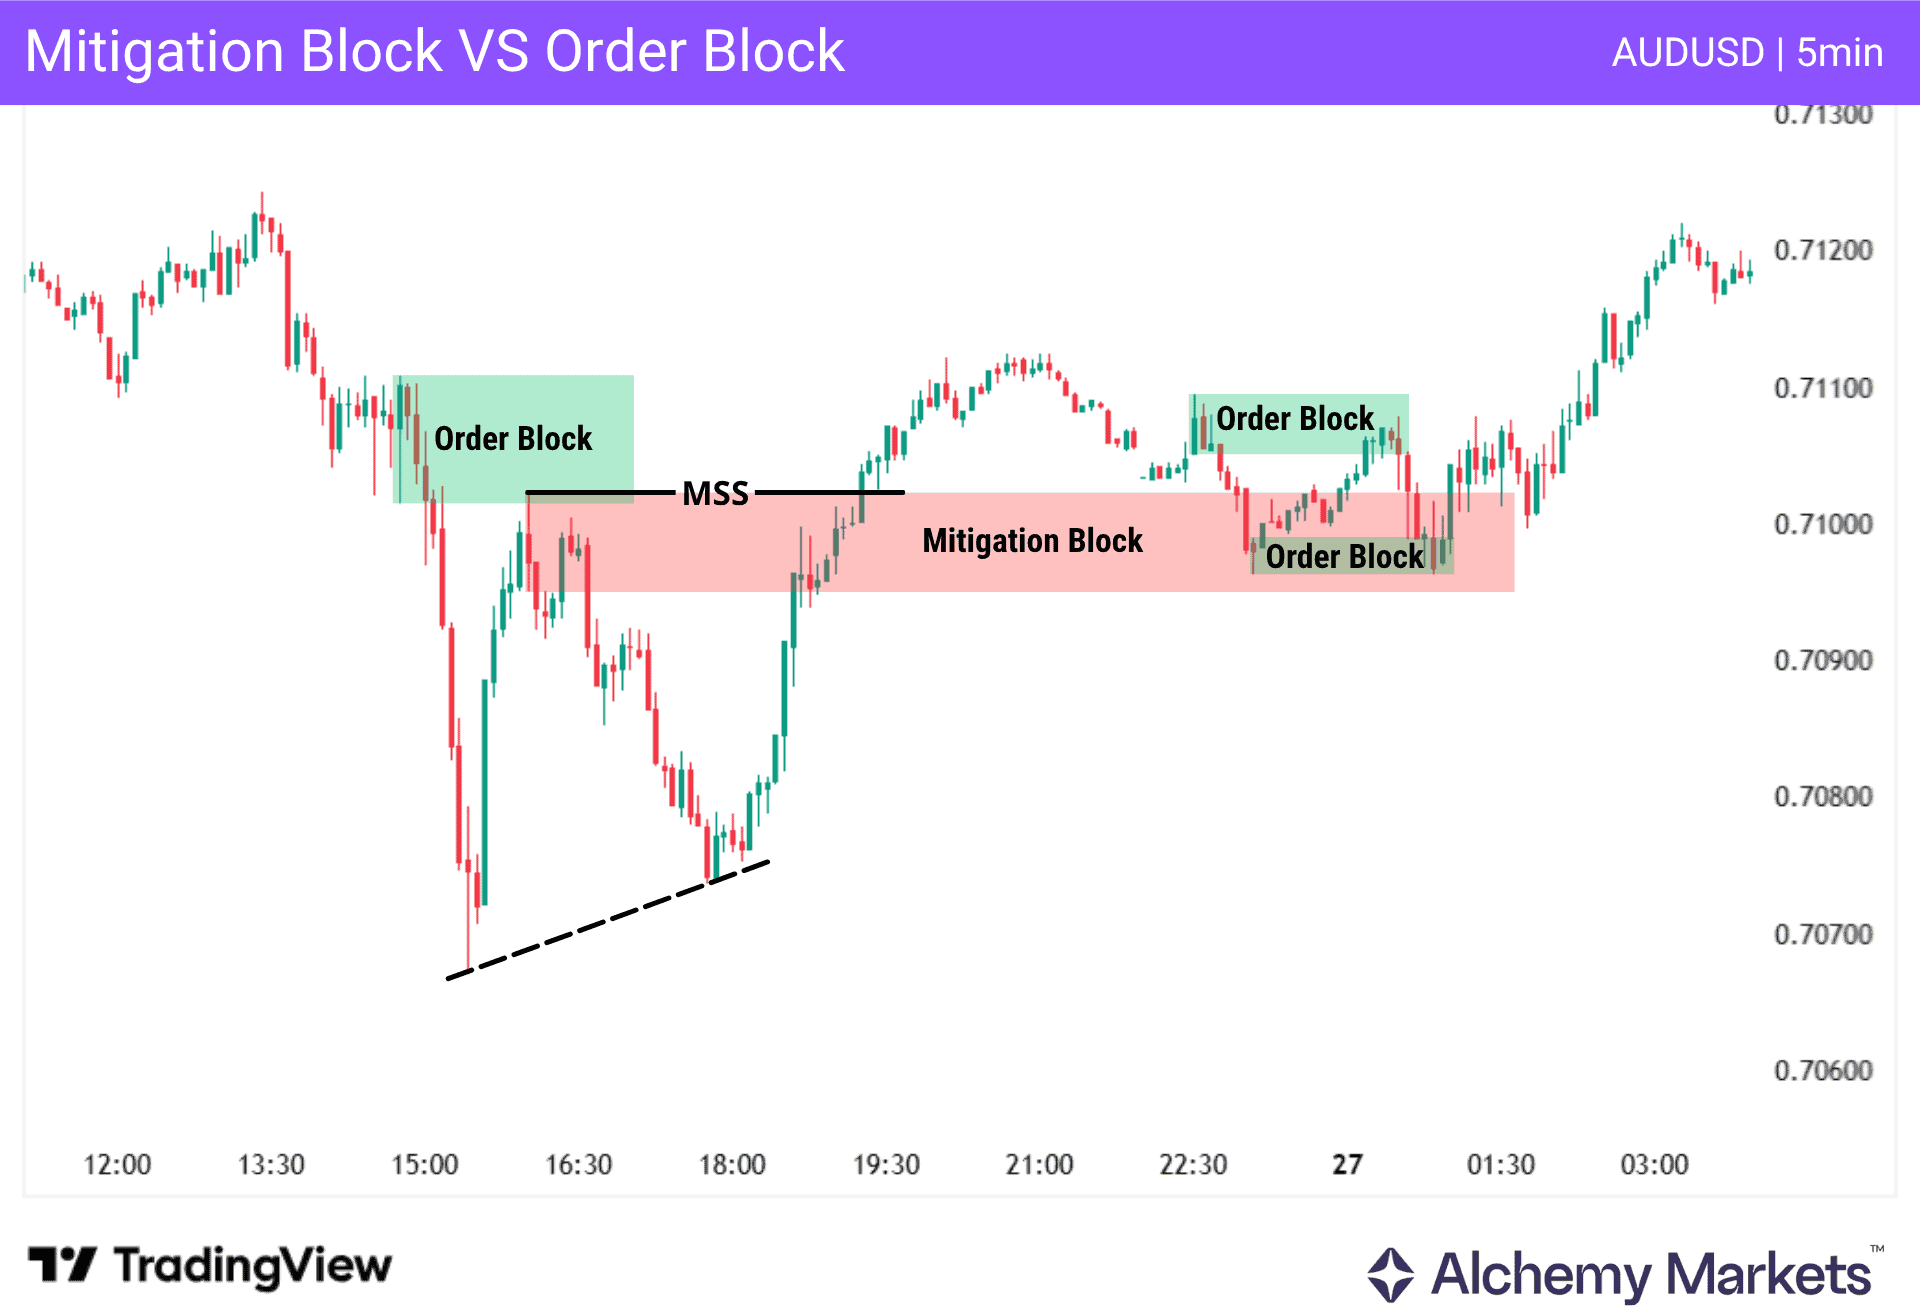
Key Differences:
- Formation logic:
Order block forms before a strong impulsive move (last candle before the impulsive move).
Mitigation block forms after a failure swing and a market structure shift (MSS). - Usage:
Order blocks are used to identify key areas of interest and for entries.
Mitigation blocks are mainly used for entries and require a key area of interest. - Market context:
Order block exists within the original move and defines where price moved from.
Mitigation block forms after a shift and reflects where price may return before continuing in the new direction.
Both order blocks and mitigation blocks can be used together. For example, order blocks (OBs) can be used to identify key areas of interest, then traders can wait for price to reach them and form a mitigation block.
They can also be used together as entry areas, especially when a mitigation block forms and price does not return to it. In this case, if price continues in the same direction and forms order blocks, they can be used as entry points, as shown in the chart:
Mitigation Block vs Unmitigation Block
The term “Unmitigation Block” is not a standard concept within Smart Money Concepts (SMC) or ICT terminology. In most cases, it refers to what traders commonly describe as an unmitigated block, meaning a price zone that has not yet been revisited after its formation.
The following example illustrates how an unmitigated order block transitions into a mitigation block:
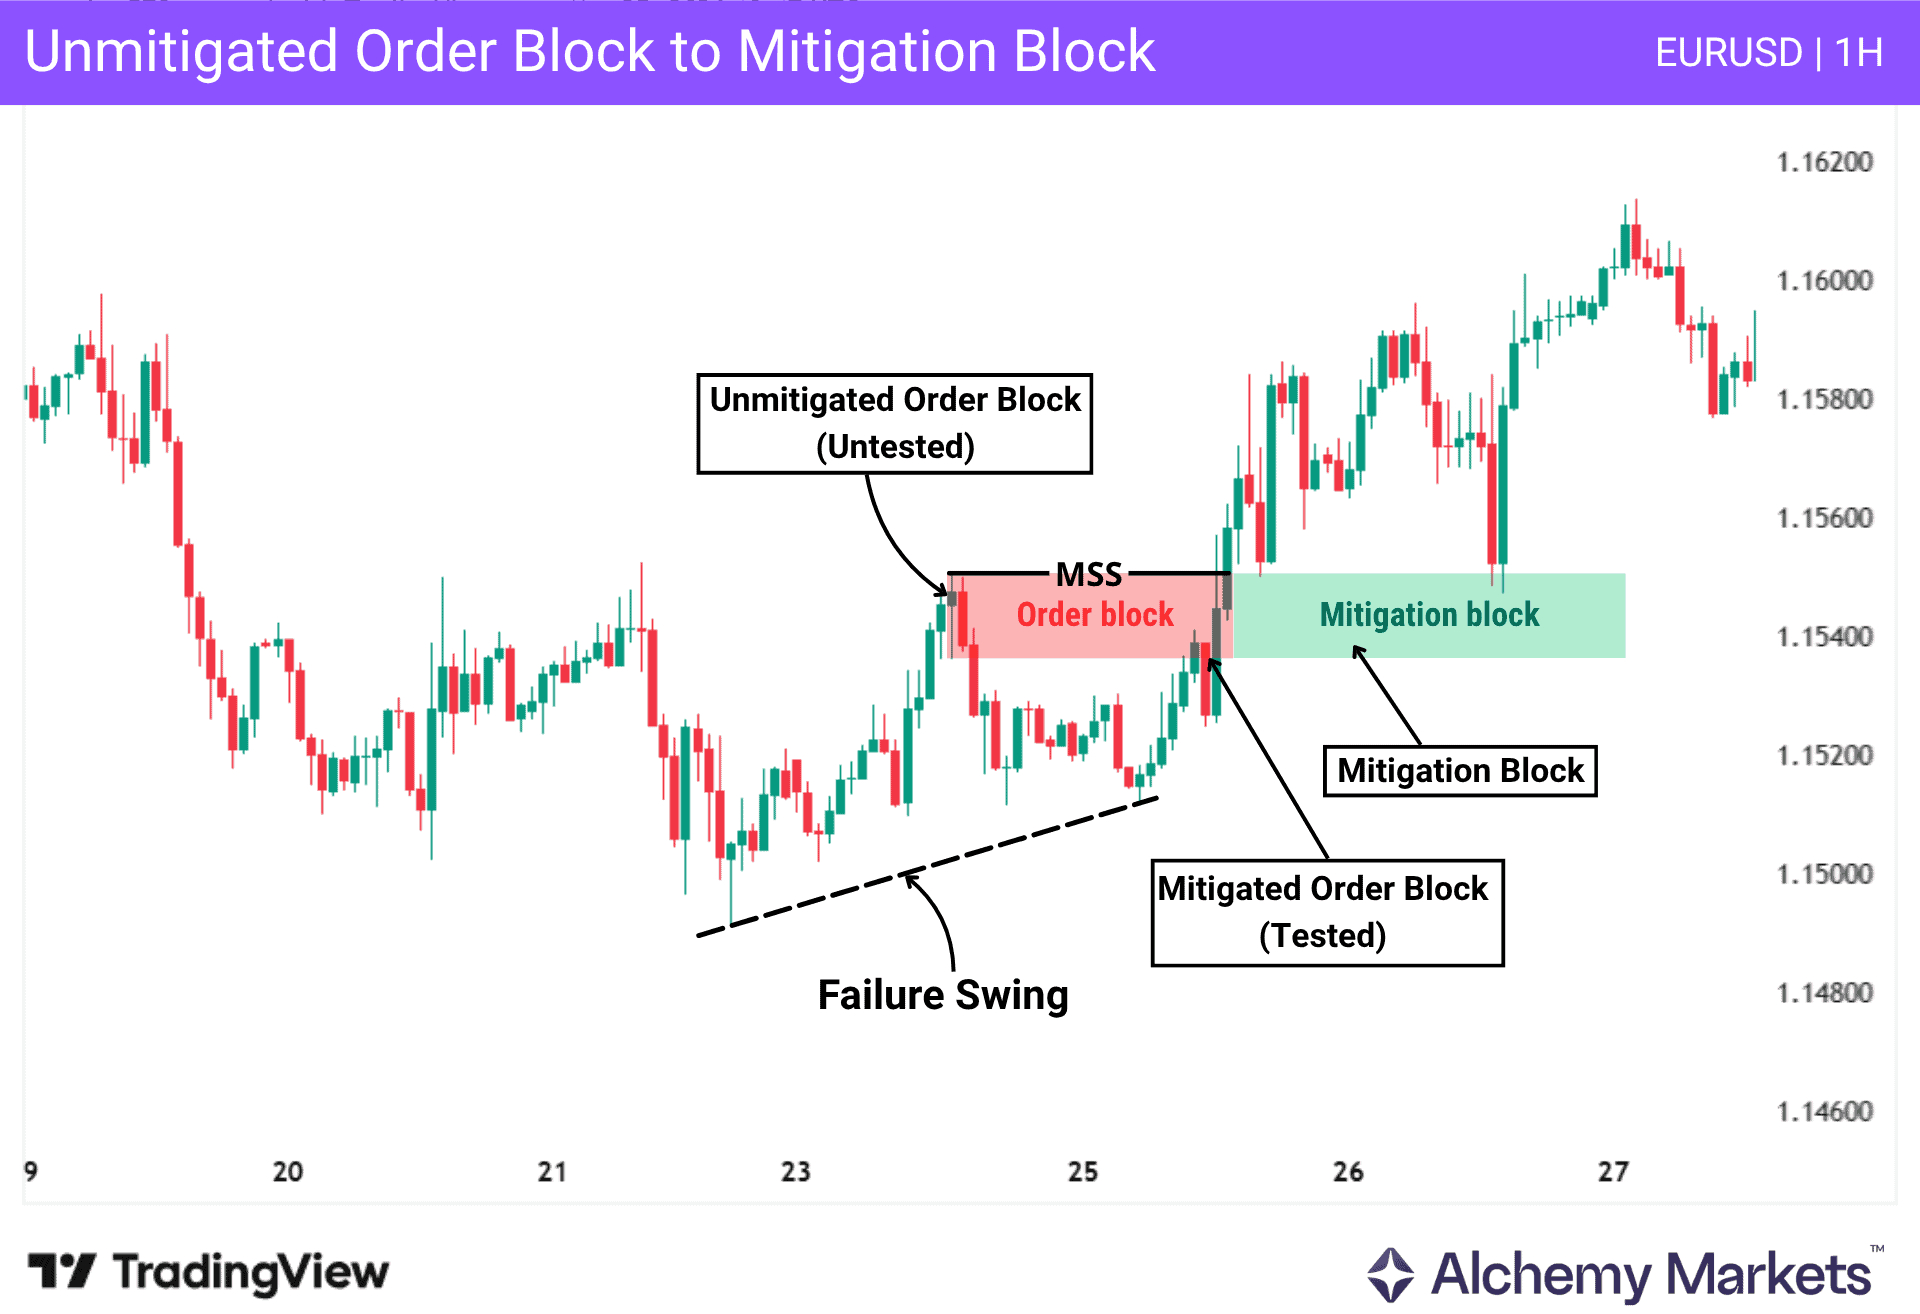
In practice, this usually relates to an untested order block, where price has moved away without returning to rebalance or mitigate positions within that zone. These areas can attract future price movement, as the market may return to fill remaining inefficiencies or rebalance positions.
Once price returns to the zone and reacts, the order block becomes a mitigated order block, as the positions within that area are considered to be rebalanced.
If price breaks through the order block, it may later be retested and, depending on the structure that forms, contribute to the formation of a mitigation block (if a failure swing and a shift in structure occur), or act as a breaker block if liquidity is taken and no failure swing is present.
Although the terms may sound similar, an unmitigated order block refers to an untested zone, while a mitigation block is a reaction zone that forms after a shift in structure.
FAQ
Which timeframes work best for beginners to spot mitigation blocks?
Beginners often find mitigation blocks easier to identify on timeframes such as H1, H4, or the daily chart. These timeframes provide clearer structure, making it easier to recognise a failure swing, (MSS), and key areas of interest.
For better decision-making, using two timeframes is recommended: a higher timeframe to identify key areas and a lower timeframe to find the mitigation block and execute the trade.
What is a mitigation block in SMC trading?
Mitigation block is not a standard concept in SMC terminology. The concept originates from ICT, but some SMC traders may use similar ideas with different terminology, depending on how they describe structure and price behaviour.
What is a mitigation block in ICT trading?
In ICT methodology, a mitigation block is a price zone formed after a failure swing and a market structure shift or a break of structure, where price may later return before reacting to it.
Can mitigation blocks be used for day trading?
Yes. Mitigation blocks can be used for day trading, especially when they form at meaningful support or resistance. A common approach is to use a higher timeframe for context, then drop to a lower timeframe to wait for the failure swing and market structure shift. They tend to work best during active sessions such as London and New York, where liquidity is stronger and price is more likely to respect structure.
What is a mitigation block in Forex trading?
In forex trading, mitigation blocks are used to identify areas where price may retrace after a shift in direction. They are commonly applied on major pairs where structure and liquidity are clearer.
How reliable is the Mitigation Block?
Mitigation blocks can be reliable when used with proper context, such as forming around key areas of interest. On their own, they are less effective.
Are mitigation blocks reliable for intraday trading?
Yes, mitigation blocks can be used on intraday charts, especially when they form around key areas of interest. They are commonly applied on timeframes from 5-minute to 4-hour, particularly during active sessions such as London or New York, where liquidity is higher and entries can be more precise.
Is mitigation block trading safe?
Mitigation block trading can be considered safe when used correctly and combined with proper context, such as key areas of interest and structure. Applying strict risk management rules and backtesting the setup can help reduce risk.
What common mistakes should traders avoid when using the mitigation block?
Common mistakes include ignoring higher timeframe context, entering without a clear shift in structure, placing stop losses too close, and relying solely on the pattern without confluence. These reduce the quality of setups.
What is a mitigated and unmitigated order block?
A mitigated order block is a zone where price has already returned and reacted, meaning the initial orders have likely been filled. An unmitigated order block is a zone that price has not yet revisited and may attract future price reactions.


