


Written by:

Reviewed by:


- April 27, 2026
- 28 min read
Commodity Channel Index (CCI Indicator)
There are many ways to analyse financial markets. Some traders focus on trend direction, others on volatility. But another powerful approach is measuring how far price has deviated from its average and using that imbalance as an opportunity.
The question is how you define that average and how you measure the deviation objectively?
One of the most practical tools built for this purpose is the Commodity Channel Index (CCI).
In this guide, you will learn how the CCI indicator works, how to interpret its key levels, how it behaves in trending and ranging markets, and how traders apply it within structured analysis to improve decision-making.
What Is the Commodity Channel Index Indicator?
The Commodity Channel Index (CCI) is a momentum oscillator used in technical analysis to measure how far the current price has deviated from its average level over a selected time period. It was developed in 1980 by Donald Lambert to identify cyclical behaviour in commodity markets.
The indicator was originally created for commodities, but it is now widely applied across forex, indices, and stocks. The logic works seamlessly across different asset classes because it measures deviation from the average using typical price.
When price deviates significantly from its average, CCI values expand away from the zero level. The greater the distance from the average, the further CCI moves from 0 into extreme values.
Key Characteristics of the CCI Indicator
Understanding how the CCI behaves is more important than memorising CCI signals. Its structure can be summarised through four defining characteristics that explain how it responds to price movements.
Momentum Oscillator
The CCI measures the speed and intensity of price expansion relative to its average. Rising readings reflect increasing buying pressure, while falling readings indicate growing selling pressure.
Because it tracks short-term deviation rather than long-term trend direction, it often reacts earlier than slower moving average–based tools.
Unbounded Indicator
The CCI has no fixed upper or lower limits. While +100 and −100 are commonly referenced overbought and oversold levels, they are reference zones rather than hard caps.
In strong market conditions or high volatility periods, the CCI can extend to +200, −200, or even +300 and beyond. The greater the deviation from the average price level, the further the indicator can move away from the zero level.
For this reason, extreme readings must always be interpreted within broader market context and structure, rather than treated as automatic reversal signals.
Versatile Across Trading Styles
The CCI adapts to short-term, swing, and position trading. Shorter settings increase responsiveness and generate more entry points, while longer settings smooth fluctuations and reduce noise.
This flexibility allows traders to adjust the indicator’s sensitivity based on their trading style and market conditions.
Leading Indicator
The CCI can act as both a confirmation tool and an early signal of shifting momentum. Sustained movement above or below key levels may confirm strength already in progress.
Because it reacts quickly to changes in price, it is often used alongside price action and other analysis.
How Does the CCI Indicator Work?
The CCI measures how far price moves from its recent average over a selected period and converts that distance into numerical values. It standardises deviation so it can be compared across different volatility conditions.
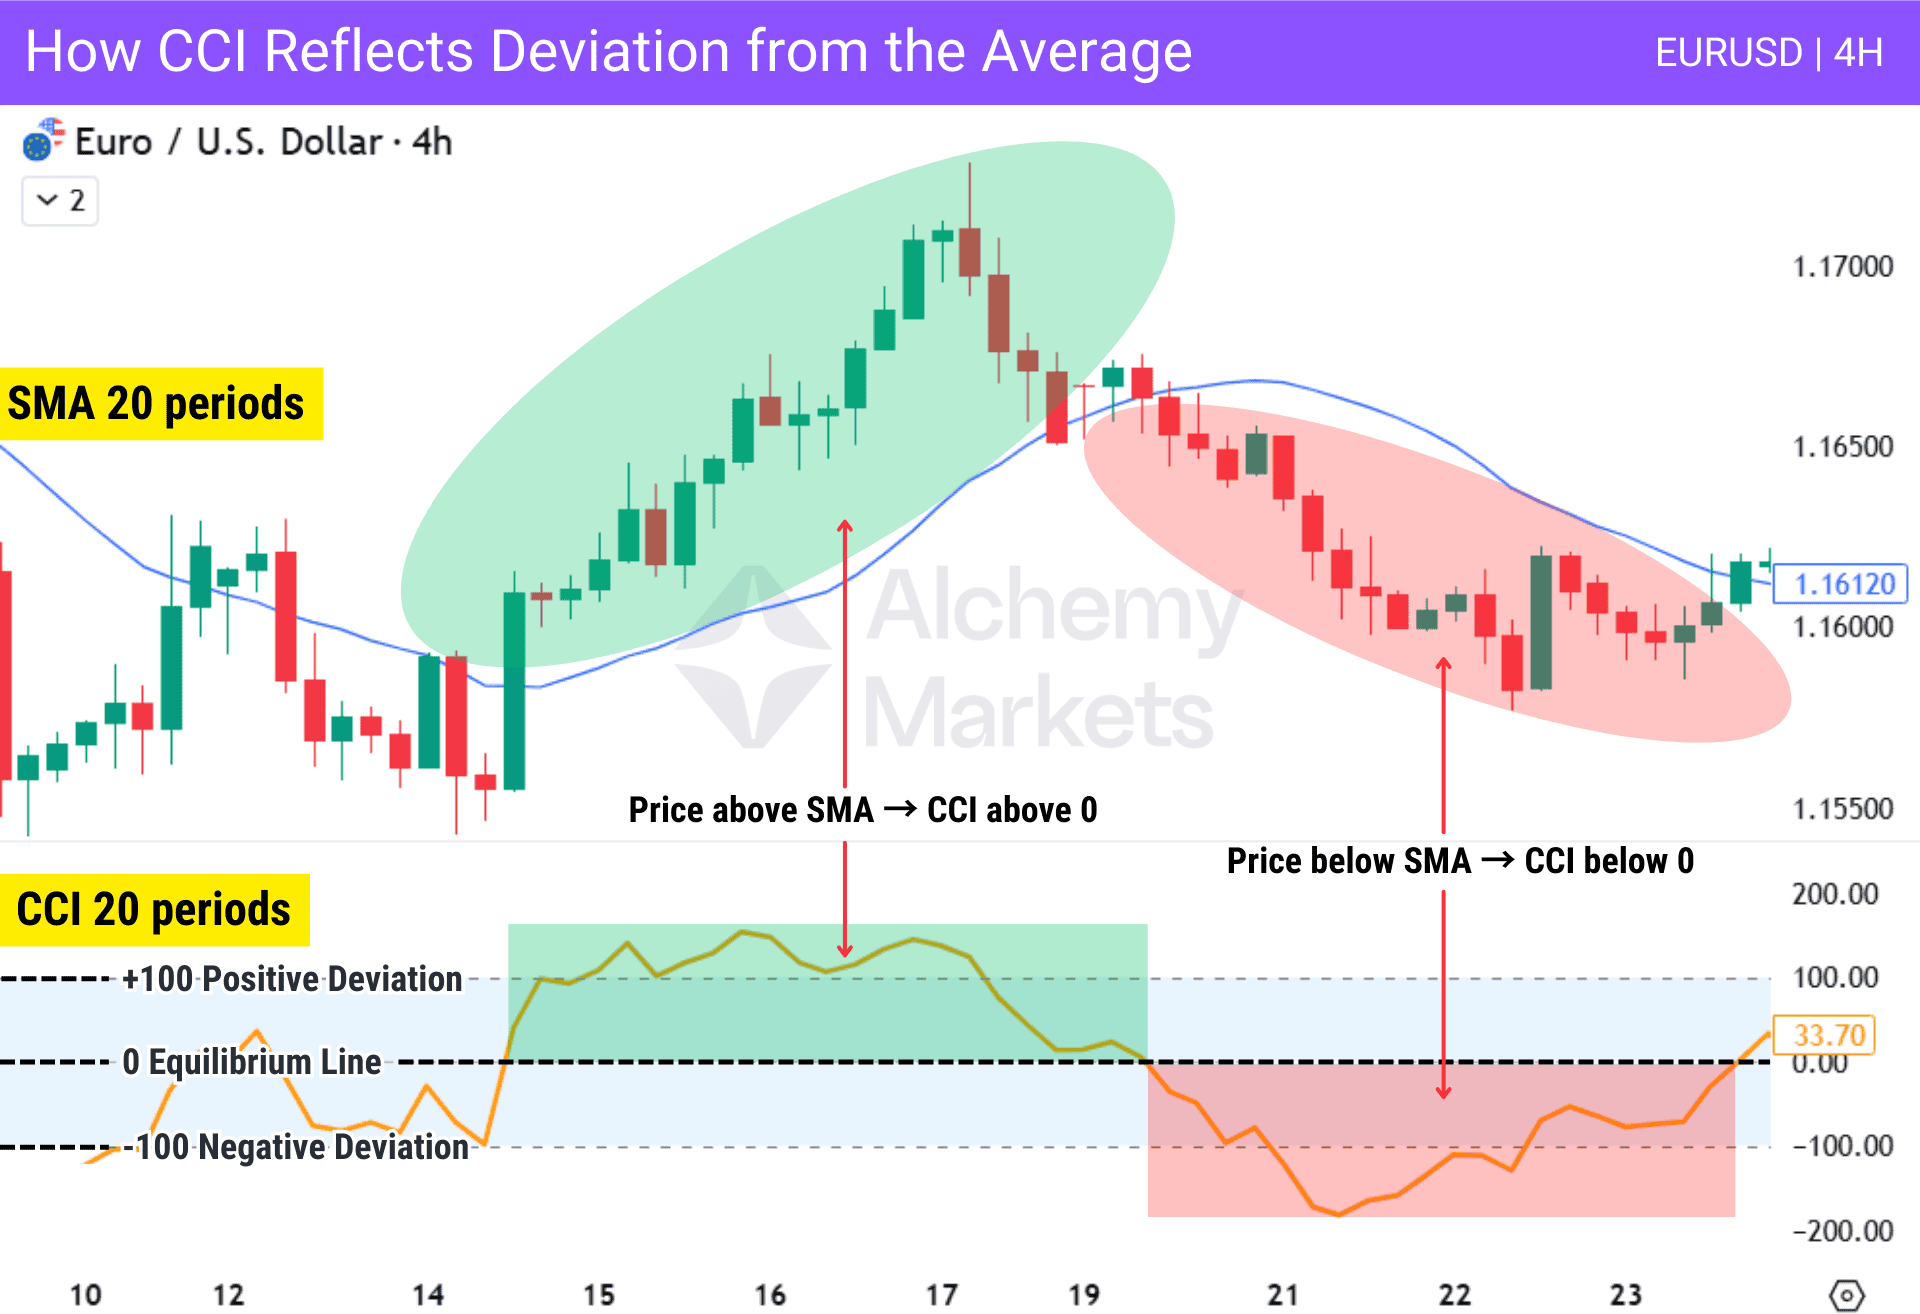
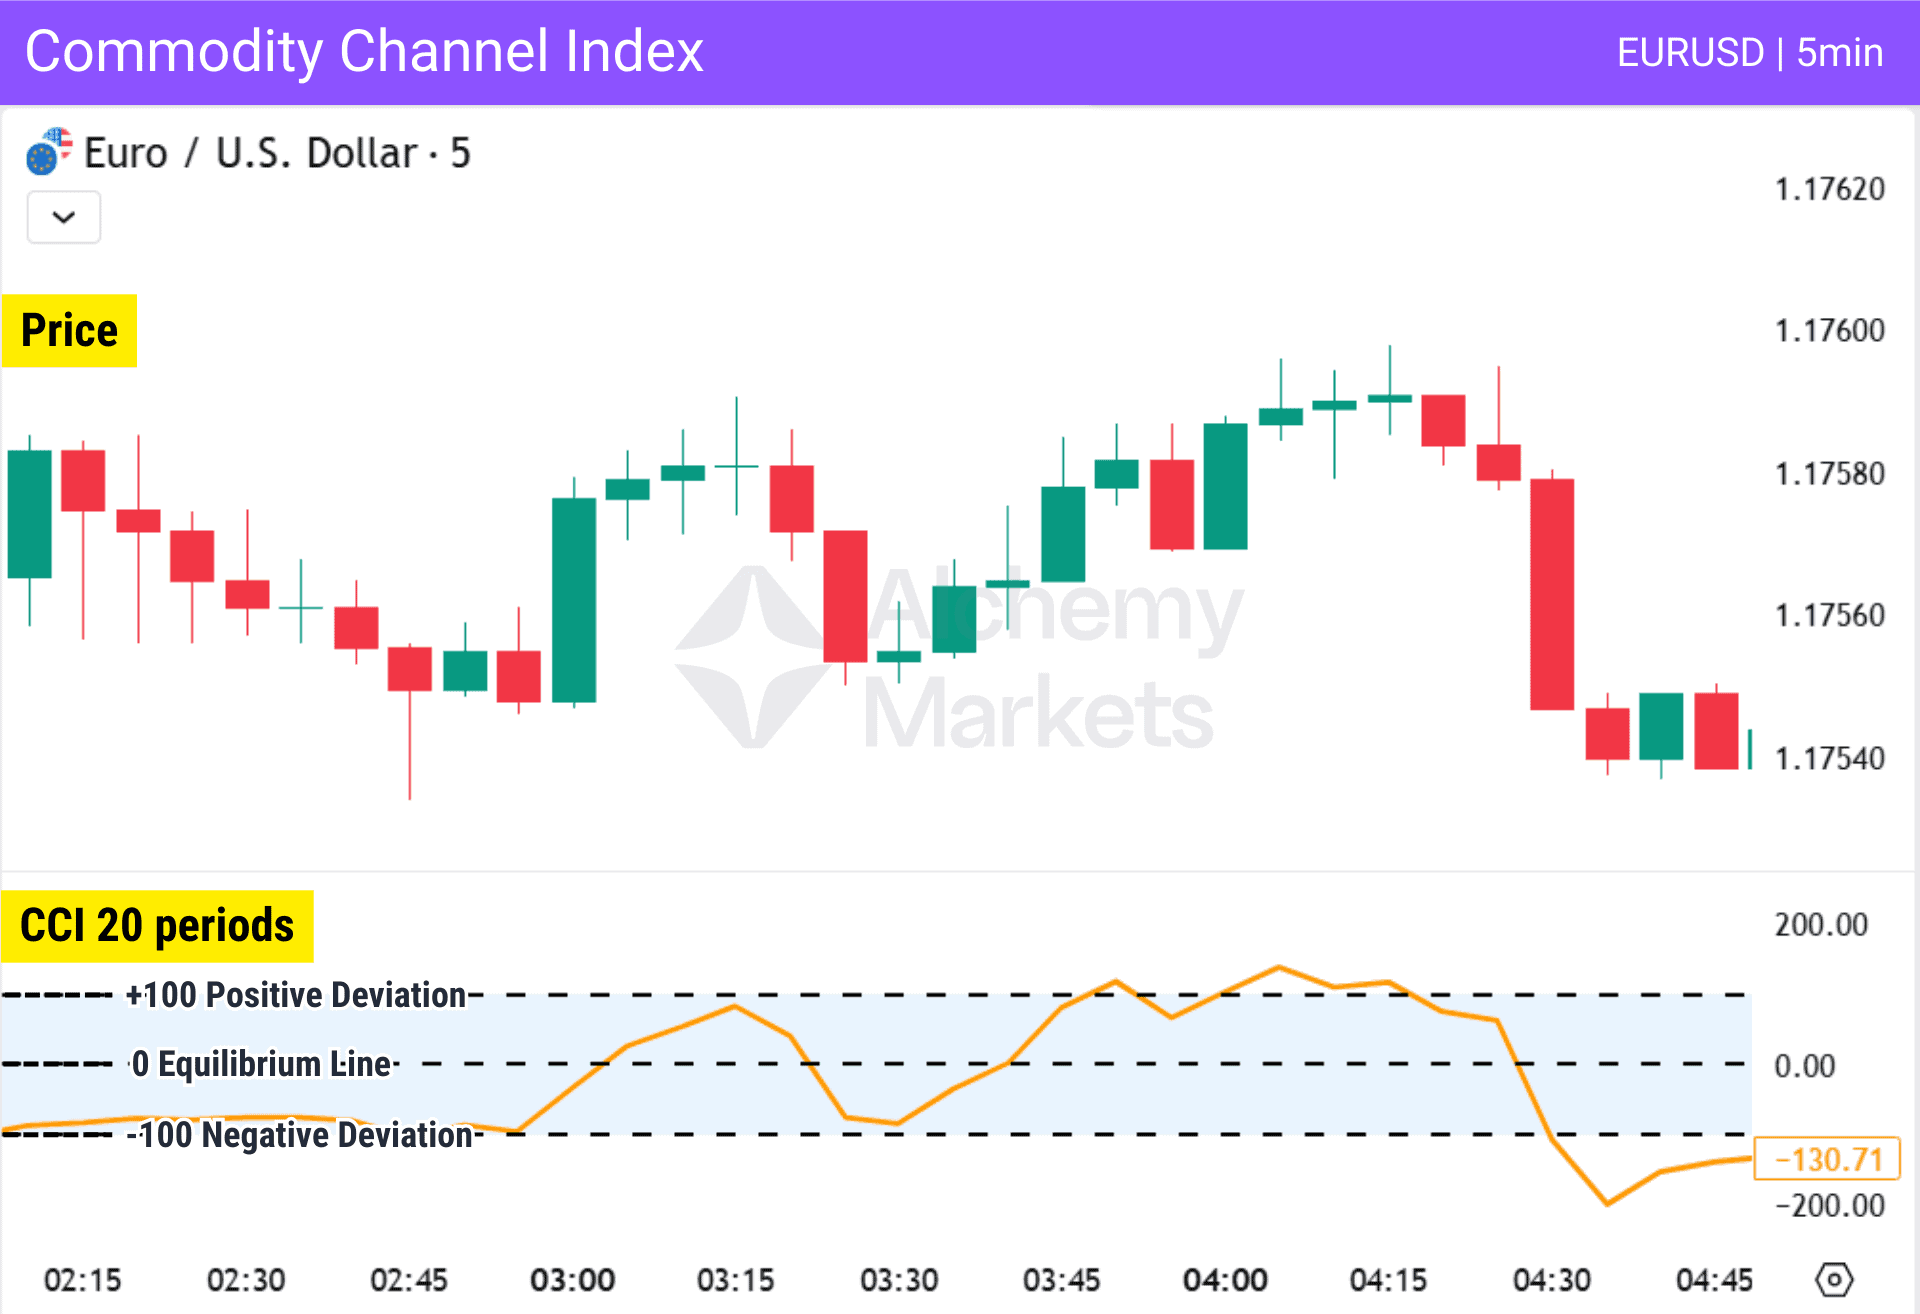
The zero level represents equilibrium. When price trades above its average, CCI shifts into positive territory (positive deviation). When price trades below it, CCI shifts into negative territory (negative deviation).
Larger deviations push CCI further away from 0. The +100 and −100 levels highlight stronger deviation, while moves toward +200 or −200 reflect extreme momentum or volatility rather than automatic reversal signals.
| Key note: In practice, our review of the indicator suggests that the ±200 levels are more effective for timing overbought and oversold conditions. The ±100 threshold is reached more frequently and may occur while price still has room to extend within a trend. By contrast, moves into the ±200 zone typically reflect stronger deviation from the average and often align with clearer reactions where price begins to reverse. |
Overbought and Oversold Signals
One of the most common uses of the commodity channel index CCI is identifying overbought and oversold conditions.
Traditionally:
- CCI above +100 is the overbought zone
- CCI below −100 is the oversold zone
These thresholds are not arbitrary. Donald Lambert introduced the 0.015 constant in the CCI formula so that approximately 70–80% of readings fall between −100 and +100 under normal market conditions.
This means moves beyond ±100 represent statistically meaningful deviation.
In highly volatile conditions, the CCI may extend to ±200 or beyond. Extreme readings reflect strong price expansion relative to the recent mean.
Two Interpretations of Extremes
Extreme CCI readings always represent deviations from the average, but their interpretation depends on whether the market is trending or ranging.
In an uptrend, negative deviation (−100 or −200) often forms during pullbacks. If CCI reverses upward from that level while structure remains intact, it may signal the pullback is ending and price is ready to continue higher.
In a downtrend, positive deviation (+100 or +200) often appears during temporary rallies. A downward reversal from that level may indicate the pullback is ending and price is ready to continue lower.
In ranging markets, both extremes matter. Moves toward +100 or +200 may reflect overbought conditions near resistance, while −100 or −200 may reflect oversold conditions near support, especially when aligned with price action, volume, or other analysis.
Understanding this distinction prevents mechanical trading decisions.
Convergence and Divergence Indicators
The Commodity Channel Index (CCI) can identify both convergence and divergence by comparing price movement with the behaviour of the indicator.
Typically, a divergence refers to when momentum (as displayed by oscillator indicators like the CCI) stops moving in unison with the price. For example, the momentum should in nature, form a higher high if the price does — but if it doesn’t, that’s a divergence away from the norm. It means something is wrong and a pivot is about to happen.
But, in the context of convergence/divergence trading, these definitions change a little. It refers directly to how the price and momentum is diverging.
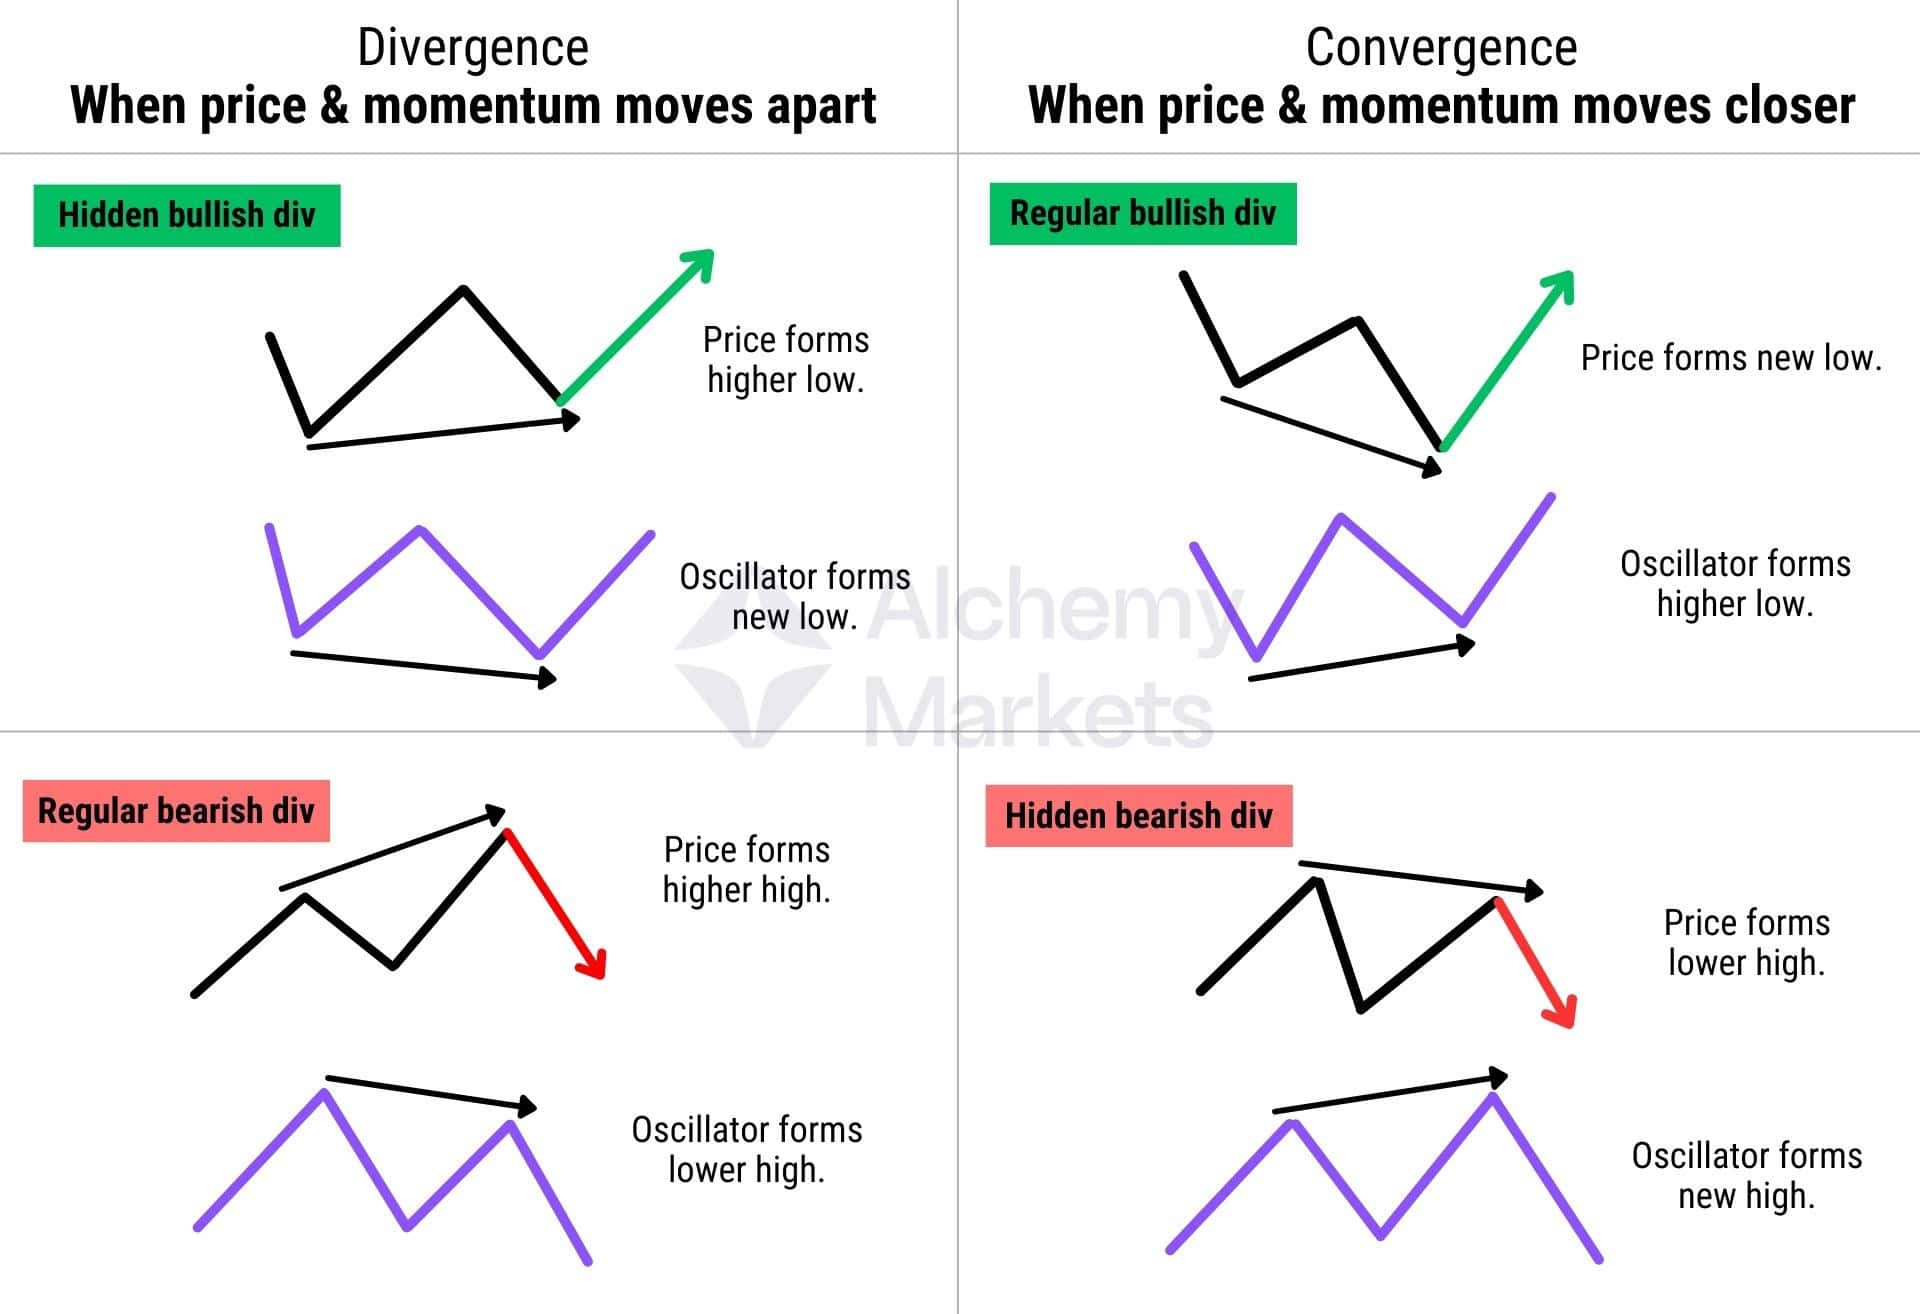
- Divergence signals in this context means when price and momentum are moving away from each other.
- Convergence signals refer to when price and momentum are moving closer to each other.
Below is a simple cheatsheet for your understanding:
The classic terminologies of divergence can still be applied here.
Basically, it’s as follows…
- Divergences are regular bearish divergence, and hidden bullish divergence patterns.
- Convergences are regular bullish divergence, and hidden bearish divergence patterns.
Just remember how the price and momentum are breaking their normal correlation, and it’ll be easier to remember.
What Does the Commodity Channel Index Indicate?
The Commodity Channel Index (CCI) provides insight into momentum intensity, relative price position, and the strength or weakness of ongoing trend phases. It shows how forcefully price movements are expanding or contracting within a defined period.
When CCI values remain consistently positive, price trades above its recent average price level. When values remain negative, price trades below it. Sustained distance from the zero level reflects directional pressure, while contraction toward 0 signals momentum compression.
The CCI does not forecast direction. It measures imbalance between price and its average, helping traders evaluate whether current conditions support continuation or indicate fading momentum.
Importance of the CCI Indicator
The CCI indicator remains relevant because it converts raw price fluctuations into measurable momentum data. It allows traders to quantify overbought and oversold conditions while precisely measuring deviation from the average price level.
Its importance lies in its ability to:
- Measure deviation from the average precisely
- Identify momentum shifts
- Distinguish between expansion and contraction
- Provide extreme levels that signal when deviation may be reaching exhaustion
- Adapt to different trading styles and timeframes
Unlike slower trend tools, CCI responds quickly to changes in price while still referencing an average price level. This balance allows it to integrate with support and resistance, price action, volume, and other analysis without encouraging mechanical decisions.
How to Calculate the CCI Indicator
Understanding how the CCI is calculated helps interpret its behaviour correctly. The calculation is based on the typical price, its moving average, and the mean deviation, which together measure how far price fluctuates from its average level.
The indicator is built in four structured steps:
Step 1: Calculate the Typical Price
| Typical Price = (High + Low + Close) ÷ 3 |
Instead of relying only on the closing price, CCI uses the average of the period’s high, low, and close. This creates a more balanced representation of price activity during that period.
Step 2: Calculate the Simple Moving Average
The next step is calculating the simple moving average (SMA) of the typical price over a chosen number of periods. The most common default setting is 20 periods.
| SMA = Sum of Typical Prices over N periods ÷ N |
This moving average becomes the referenced average price level used to measure deviation.
Step 3: Calculate the Mean Deviation
Mean deviation measures how far prices fluctuate from the average over the same period.
| Mean Deviation = Σ |Typical Price − SMA| ÷ N |
Where:
- Σ = sum of values
- | | = absolute value
- N = number of periods
This step measures the average distance of price from its moving average and represents normal variation around the reference level.
Step 4: Apply the CCI Formula
| CCI = (Typical Price − SMA of Typical Price) ÷ (0.015 × Mean Deviation) |
The 0.015 constant scales the result so that most CCI values fall between −100 and +100 during typical market conditions. Unlike the RSI or Stochastic, the CCI indicator has no fixed upside or downside limits, so strong volatility can push readings well beyond ±200.
CCI Indicator Formula
The complete formula can be summarized as:
| CCI = (TP − SMA(TP)) / (0.015 × MD) |
Where:
- TP = Typical Price
- SMA(TP) = Moving Average of Typical Price
- MD = Mean Deviation
The formula scales deviation relative to normal price fluctuations, allowing CCI values to remain comparable across different markets and timeframes.
The period setting controls how sensitive the CCI reacts to price movements. Scalpers and day traders often use 5–10 periods for faster signals, while swing traders prefer 14–20 for balance. Position traders may use 30+ periods to focus on broader trend phases and reduce noise.
CCI Indicator Example
Consider a 20-period CCI applied to a currency pair (EURUSD) on the 1-hour timeframe during an uptrend:
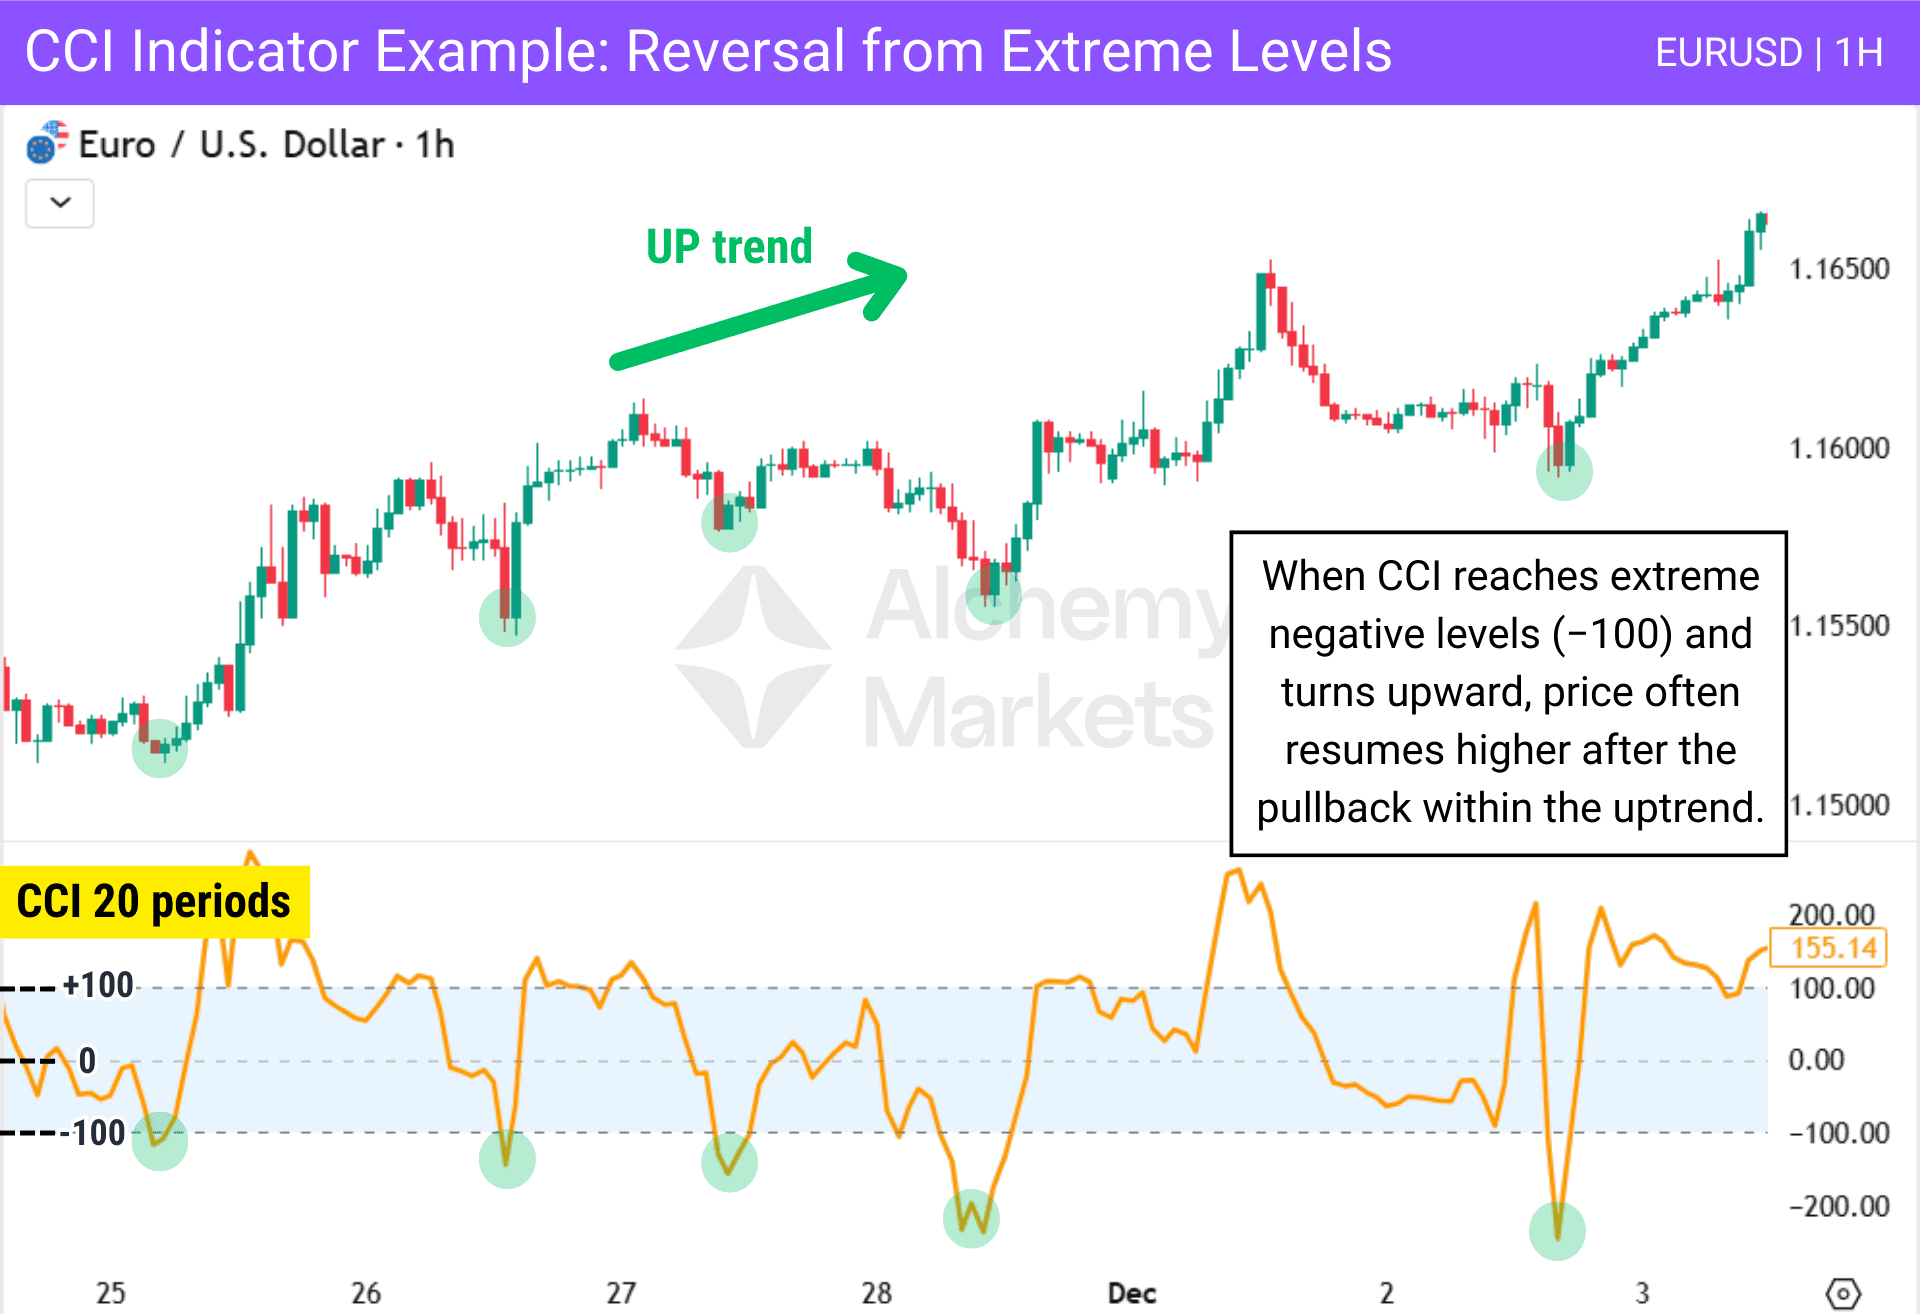
Consider a 20-period CCI applied to EURUSD on the 1-hour timeframe during an uptrend.
Price forms higher highs and higher lows, while temporary pullbacks occur within the broader bullish structure. During each pullback, CCI drops below −100, indicating short-term negative deviation from the average price level.
When CCI turns upward after moving below −100, it signals that the pullback is weakening, and price resumes its original trend. The indicator does not predict a reversal; it helps identify entry points aligned with the prevailing uptrend.
CCI Indicator Trading Strategies
The CCI indicator becomes effective when used within a structured trading strategy. On its own, it measures how far price has deviated from its recent average price level. When combined with other approaches from technical analysis or other indicators, it becomes a practical tool.
Different market conditions require traders to use CCI differently, adapting its interpretation to trending, ranging, or breakout environments. Below are several practical strategies for applying CCI.
Overbought and Oversold Strategy
This strategy works best in ranging markets where price rotates between support and resistance. In trending environments, CCI can remain extended for longer periods, reducing the reliability of early reversal signals.
While ±100 are commonly referenced values, ±200 often provide stronger sell signals and buy signals especially in trending markets and volatile conditions. For this reason, the examples and strategies in this guide will primarily reference the ±200 levels when identifying extreme CCI levels.
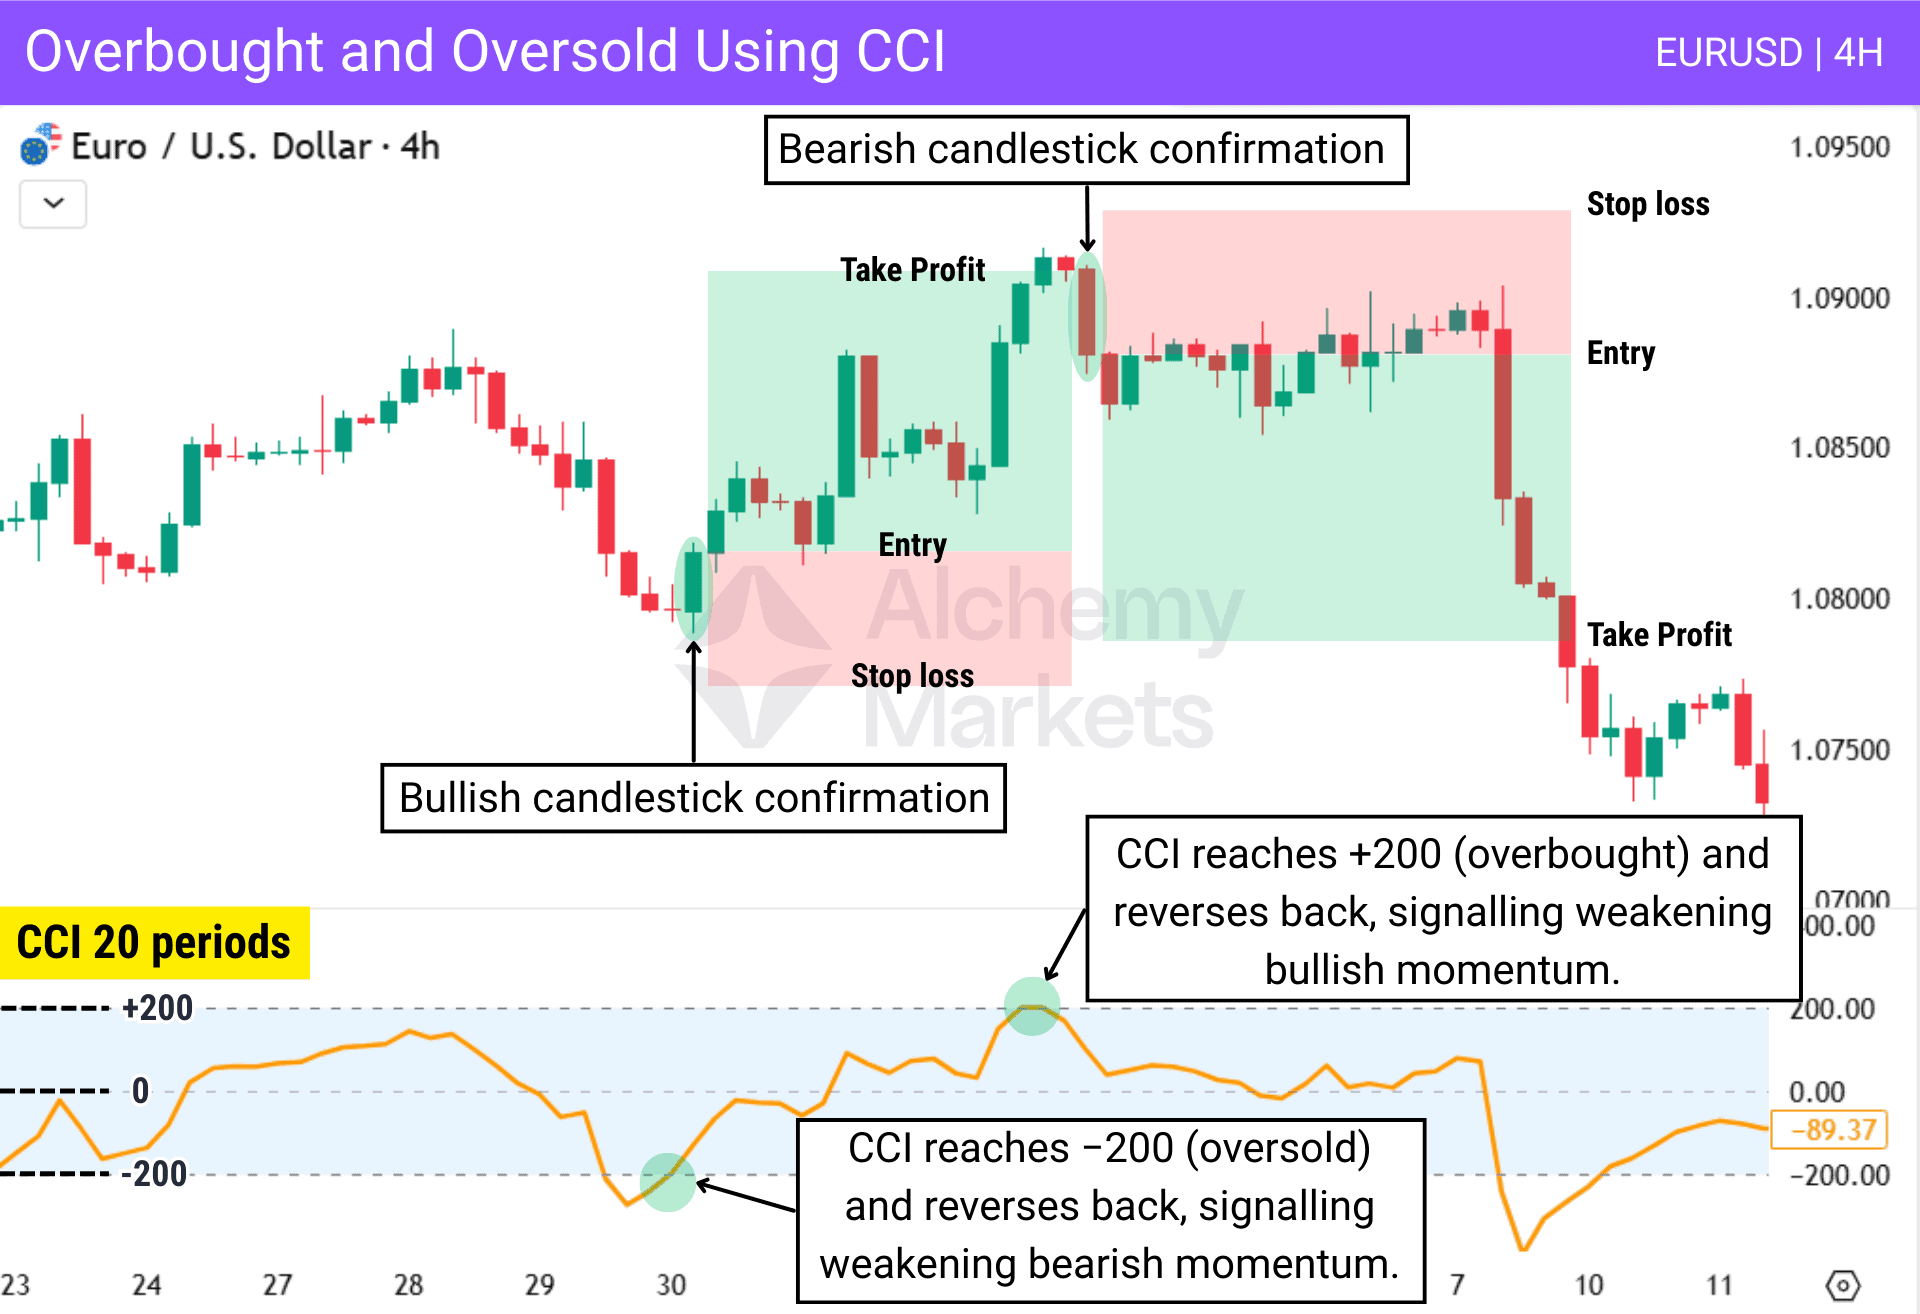
Entry and exit rules
Buy (Long)
Wait for CCI to move below −200 and reverse upward. Then wait for a bullish candlestick confirmation before entering the trade.
Exit when CCI approaches the opposite extreme +200 and begins reversing, indicating price may start turning bearish.
Sell (Short)
Wait for CCI to move above +200 and reverse downward. Then wait for a bearish candlestick confirmation before entering the trade.
Exit when CCI approaches the opposite extreme −200 and begins reversing, indicating price may start turning bullish.
Convergence and Divergence Strategy
A convergence and divergence strategy focuses on identifying moments when price momentum begins to disagree with the underlying price trend.
By comparing price action with an oscillator such as the Commodity Channel Index (CCI), traders can spot when momentum is strengthening or weakening before it becomes obvious on the chart.
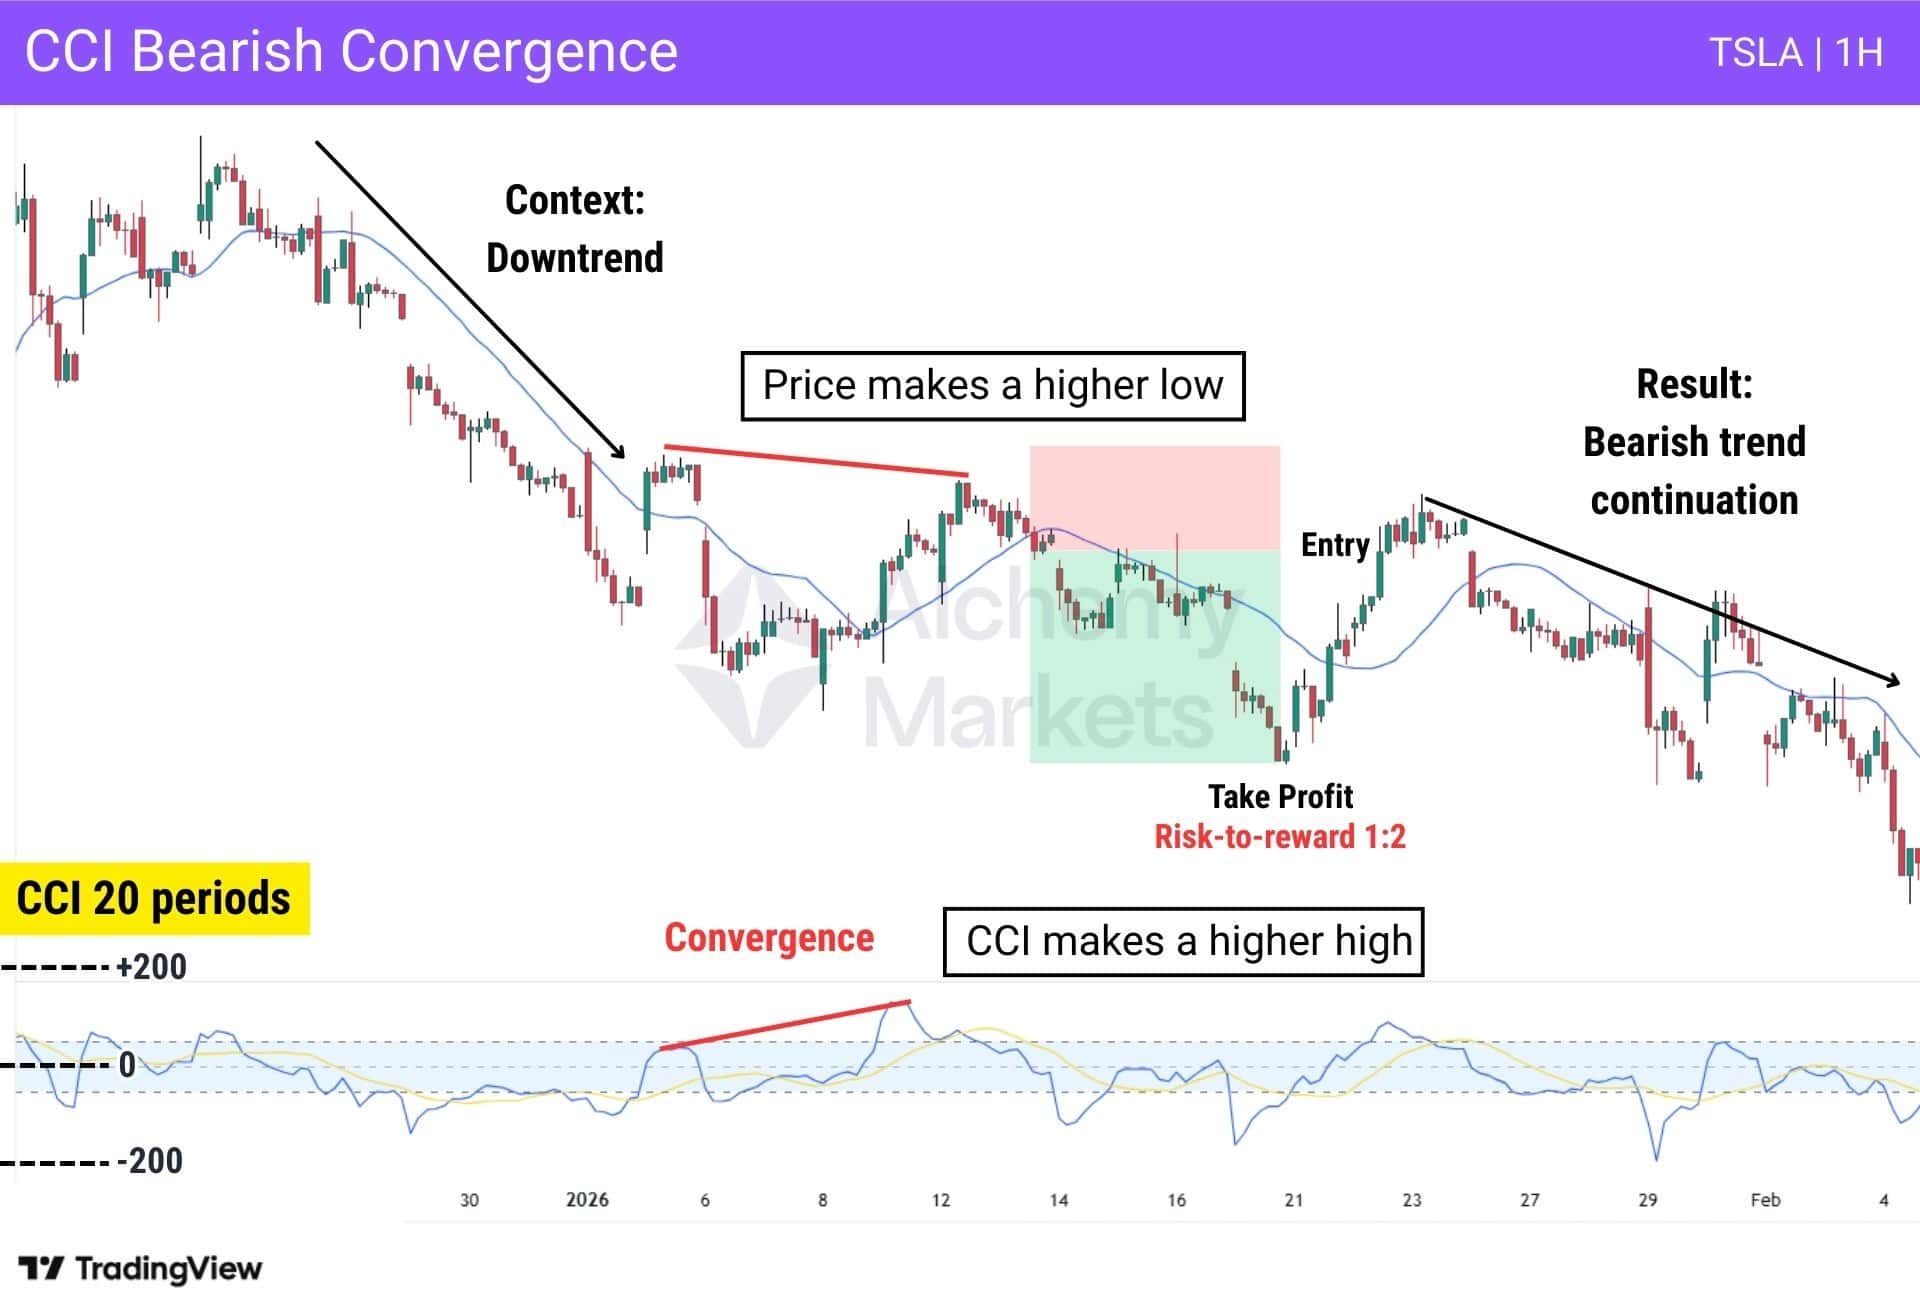
Convergence
Convergence happens when price and the CCI begin moving closer together. In practice, this usually appears in classic setups such as regular bullish divergence or hidden bearish divergence.
The key idea is that the distance between price movement and momentum movement starts to narrow.
This suggests that the previous imbalance is fading, and the market may be preparing either for a bullish reversal or a bearish continuation, depending on the structure.
Notice how in the chart below, price makes a higher low despite the momentum higher high. This is a hidden bearish divergence, which tells us that the market tried (with effort) to push prices higher, against the bearish trend, but ultimately failed to break the bearish market structure. Price then rolls over and continues the downtrend.
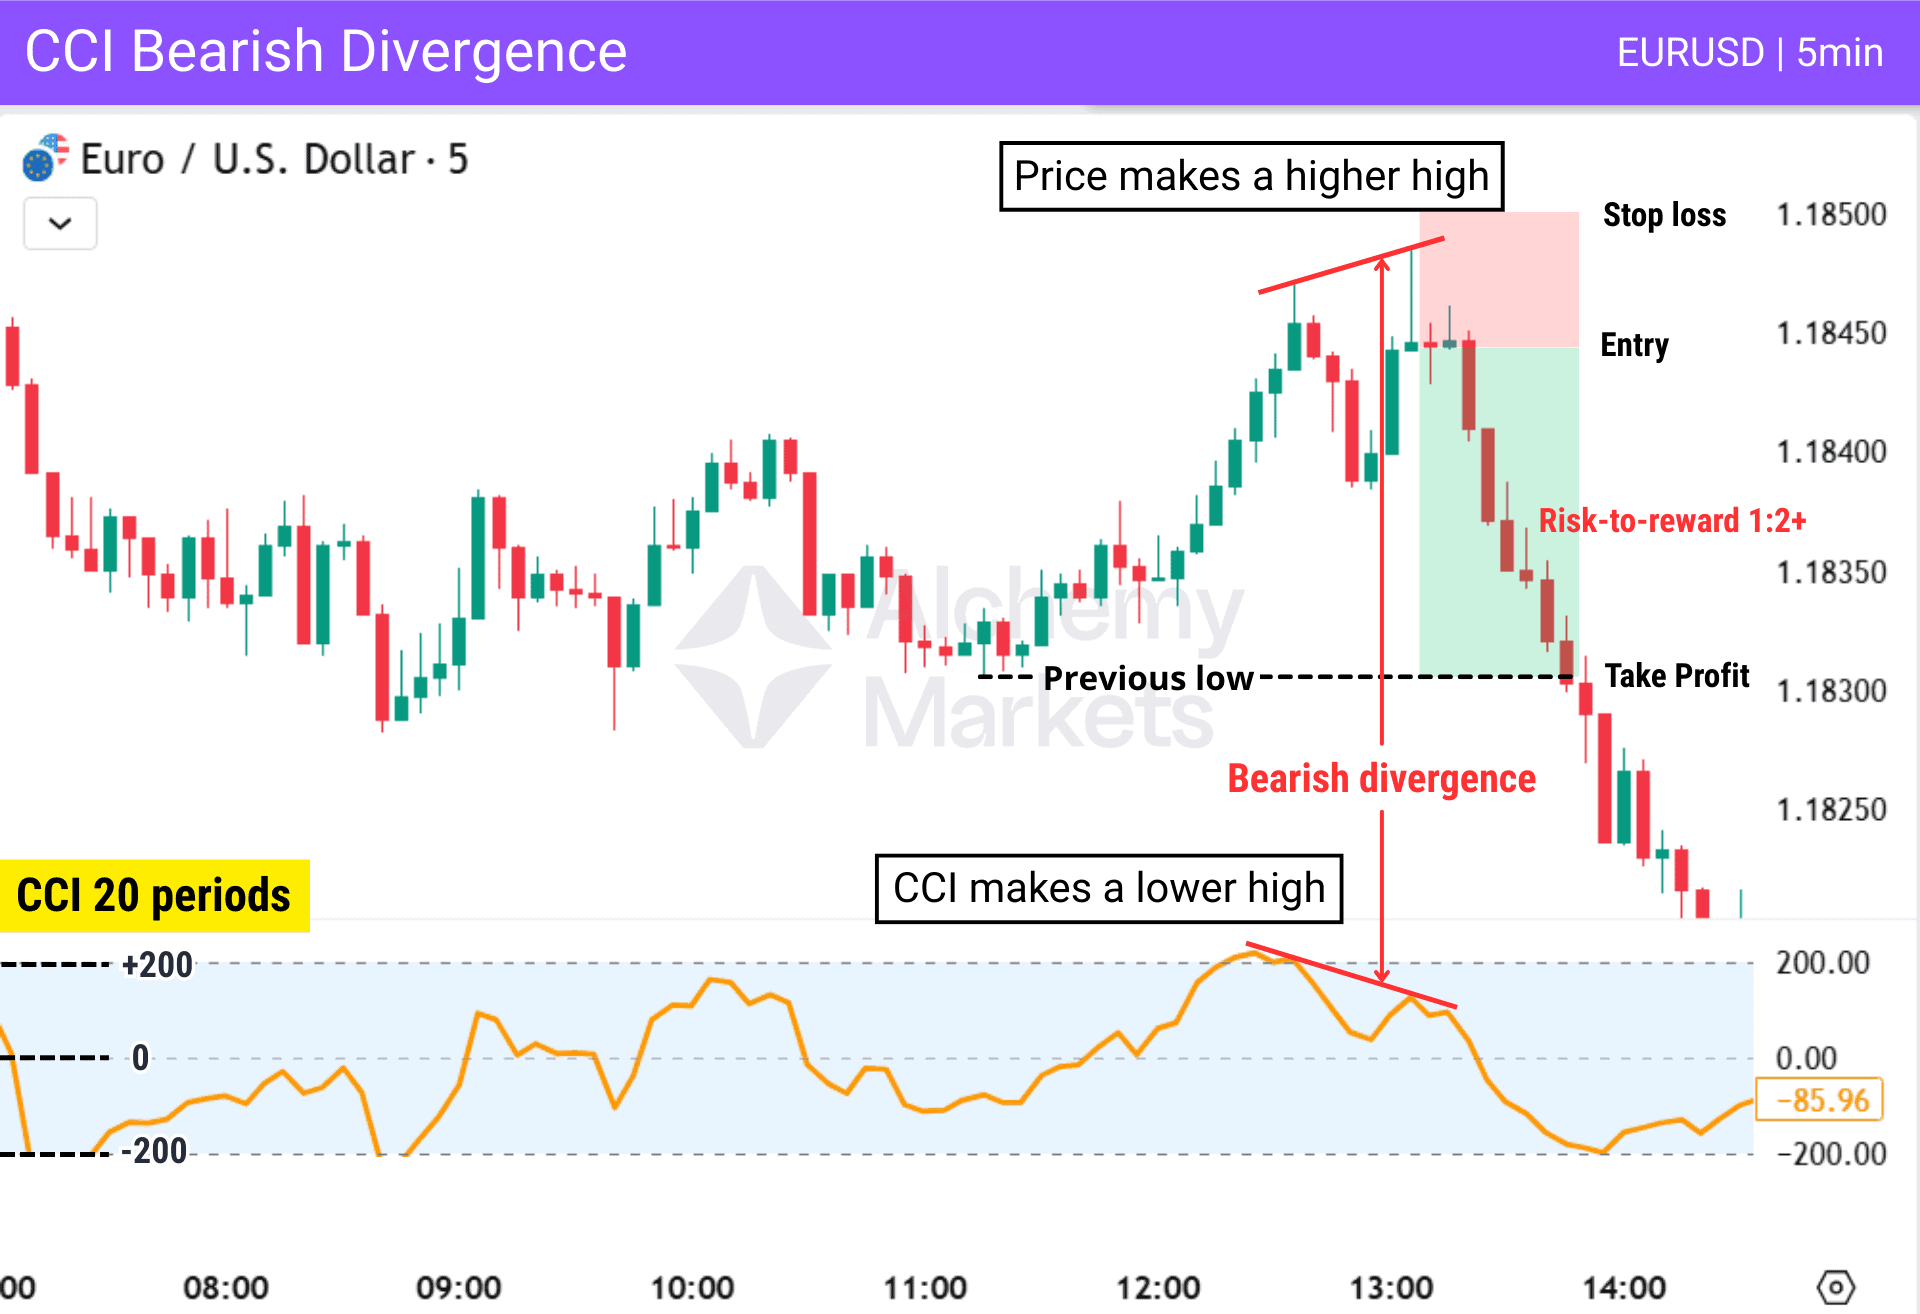
Divergence
Divergence happens when price and the CCI begin moving further apart. This usually appears in setups such as regular bearish divergence or hidden bullish divergence.
Here, the distance between price and momentum widens, showing that the two are no longer moving in sync. This separation can signal that momentum is shifting and that the market may be approaching either a bearish reversal or a bullish continuation, depending on the pattern.
The chart below shows an example of a bearish divergence on EURUSD. Note how the price and CCI spread further apart; eventually resulting in a bearish reversal.
CCI with MA
Moving averages show the market’s average price over a selected period and act as dynamic support or resistance. When combined with CCI, they can provide strong signals:
- You can use a moving average to define bias and entry when price reacts to it, and cci to confirm the trade when it reverses from its extremes.
- You can use a moving average as a target (price return to its average), and cci to confirm the trade.
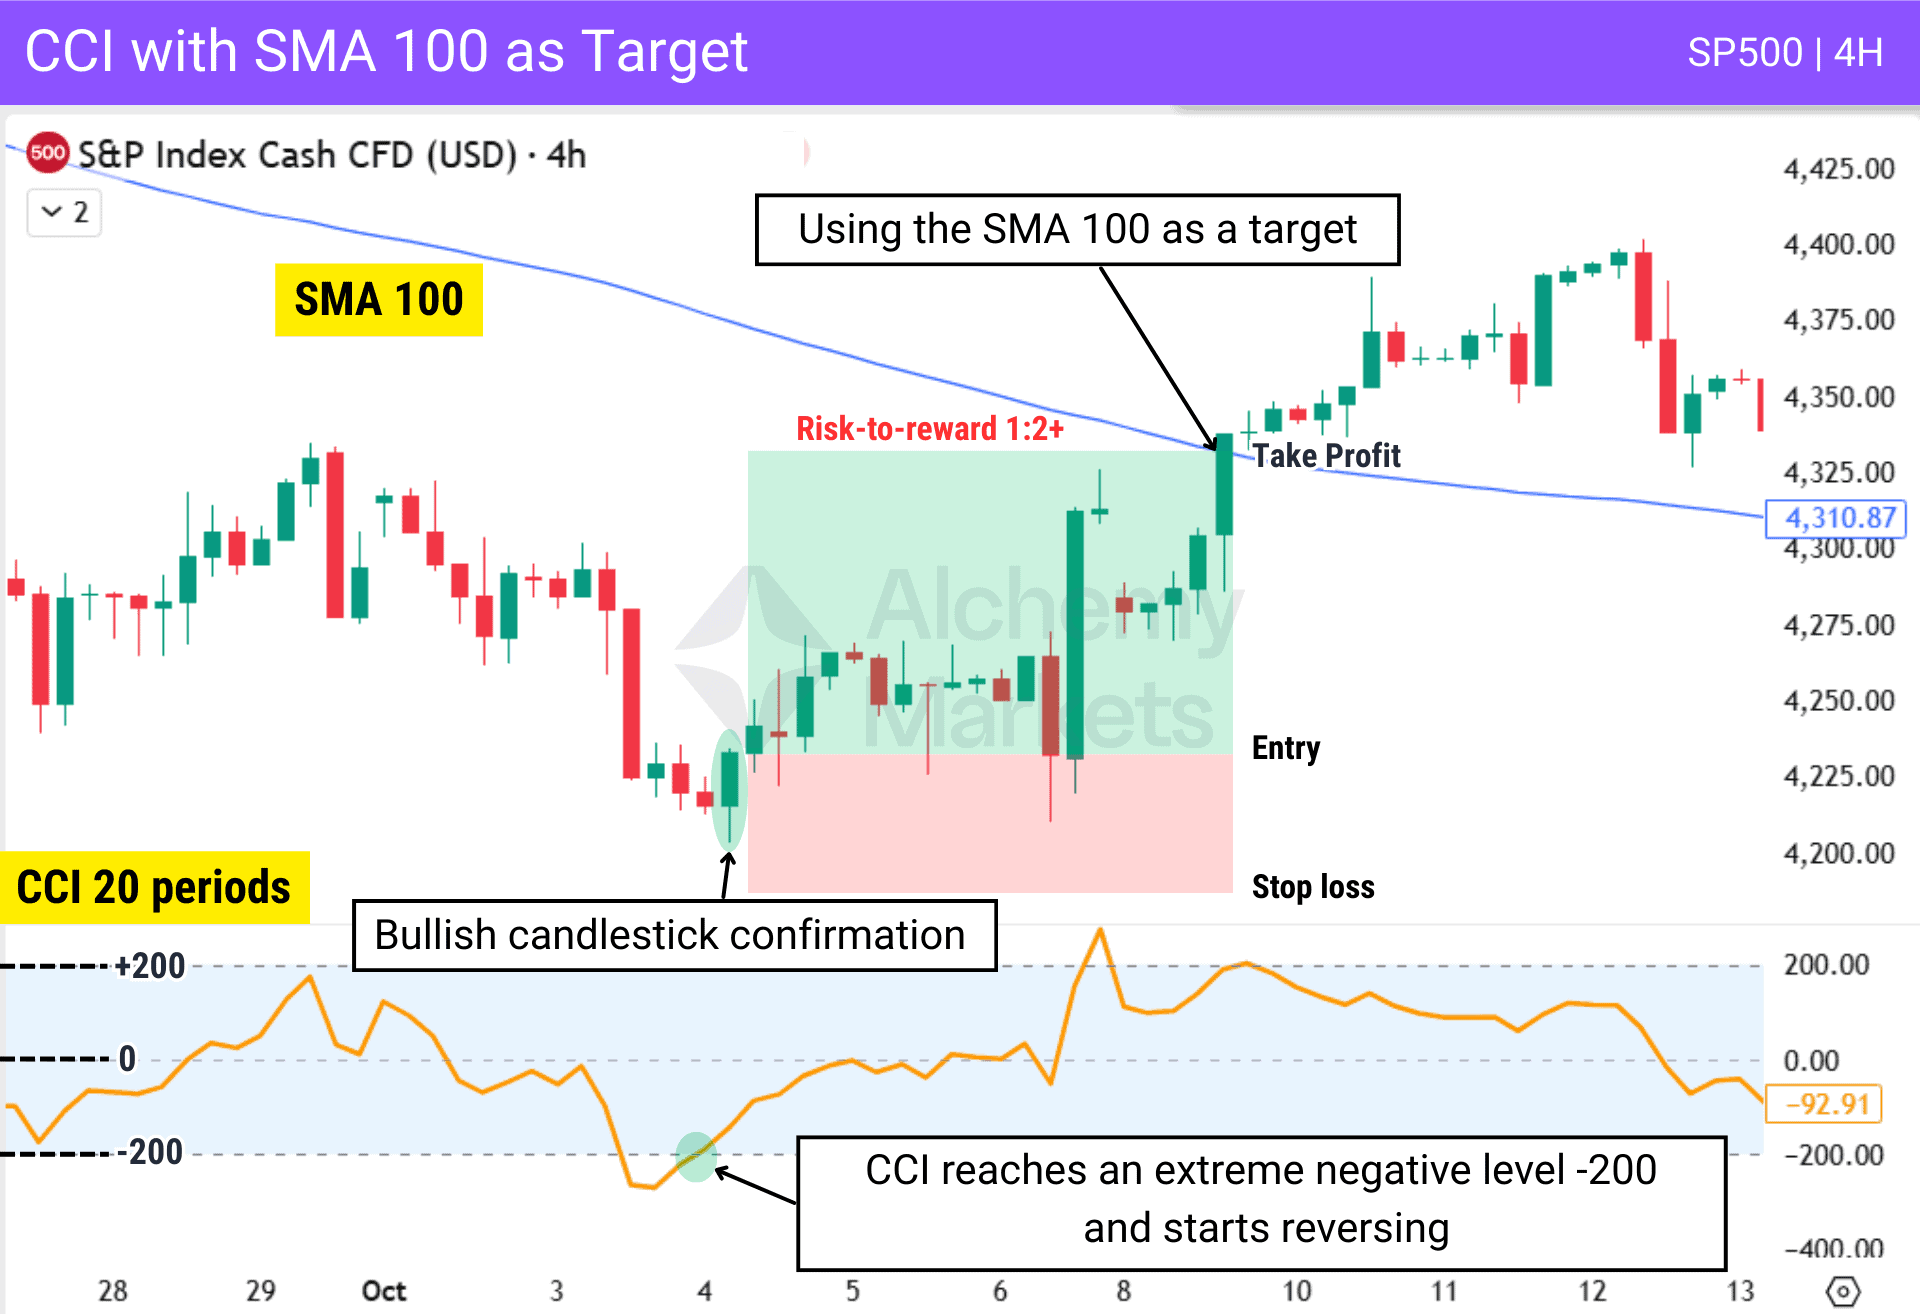
In this chart, the moving average is used as a target.
Price becomes strongly extended below the 100-period simple moving average while CCI falls below −200 and begins reversing upward. At the same time, a strong bullish candlestick forms, confirming the signal and entry.
The trade targets the moving average, where price often returns after an extreme deviation from its average. This reaction reflects the tendency of price to revert toward its mean after extended moves.
| Key Note: The period of a moving average can vary depending on the asset, timeframe, and market conditions. Traders often test different periods to identify averages that price repeatedly reacts to or respects. When price tends to react or reverse after touching a specific SMA or EMA, that moving average is considered respected by the market. |
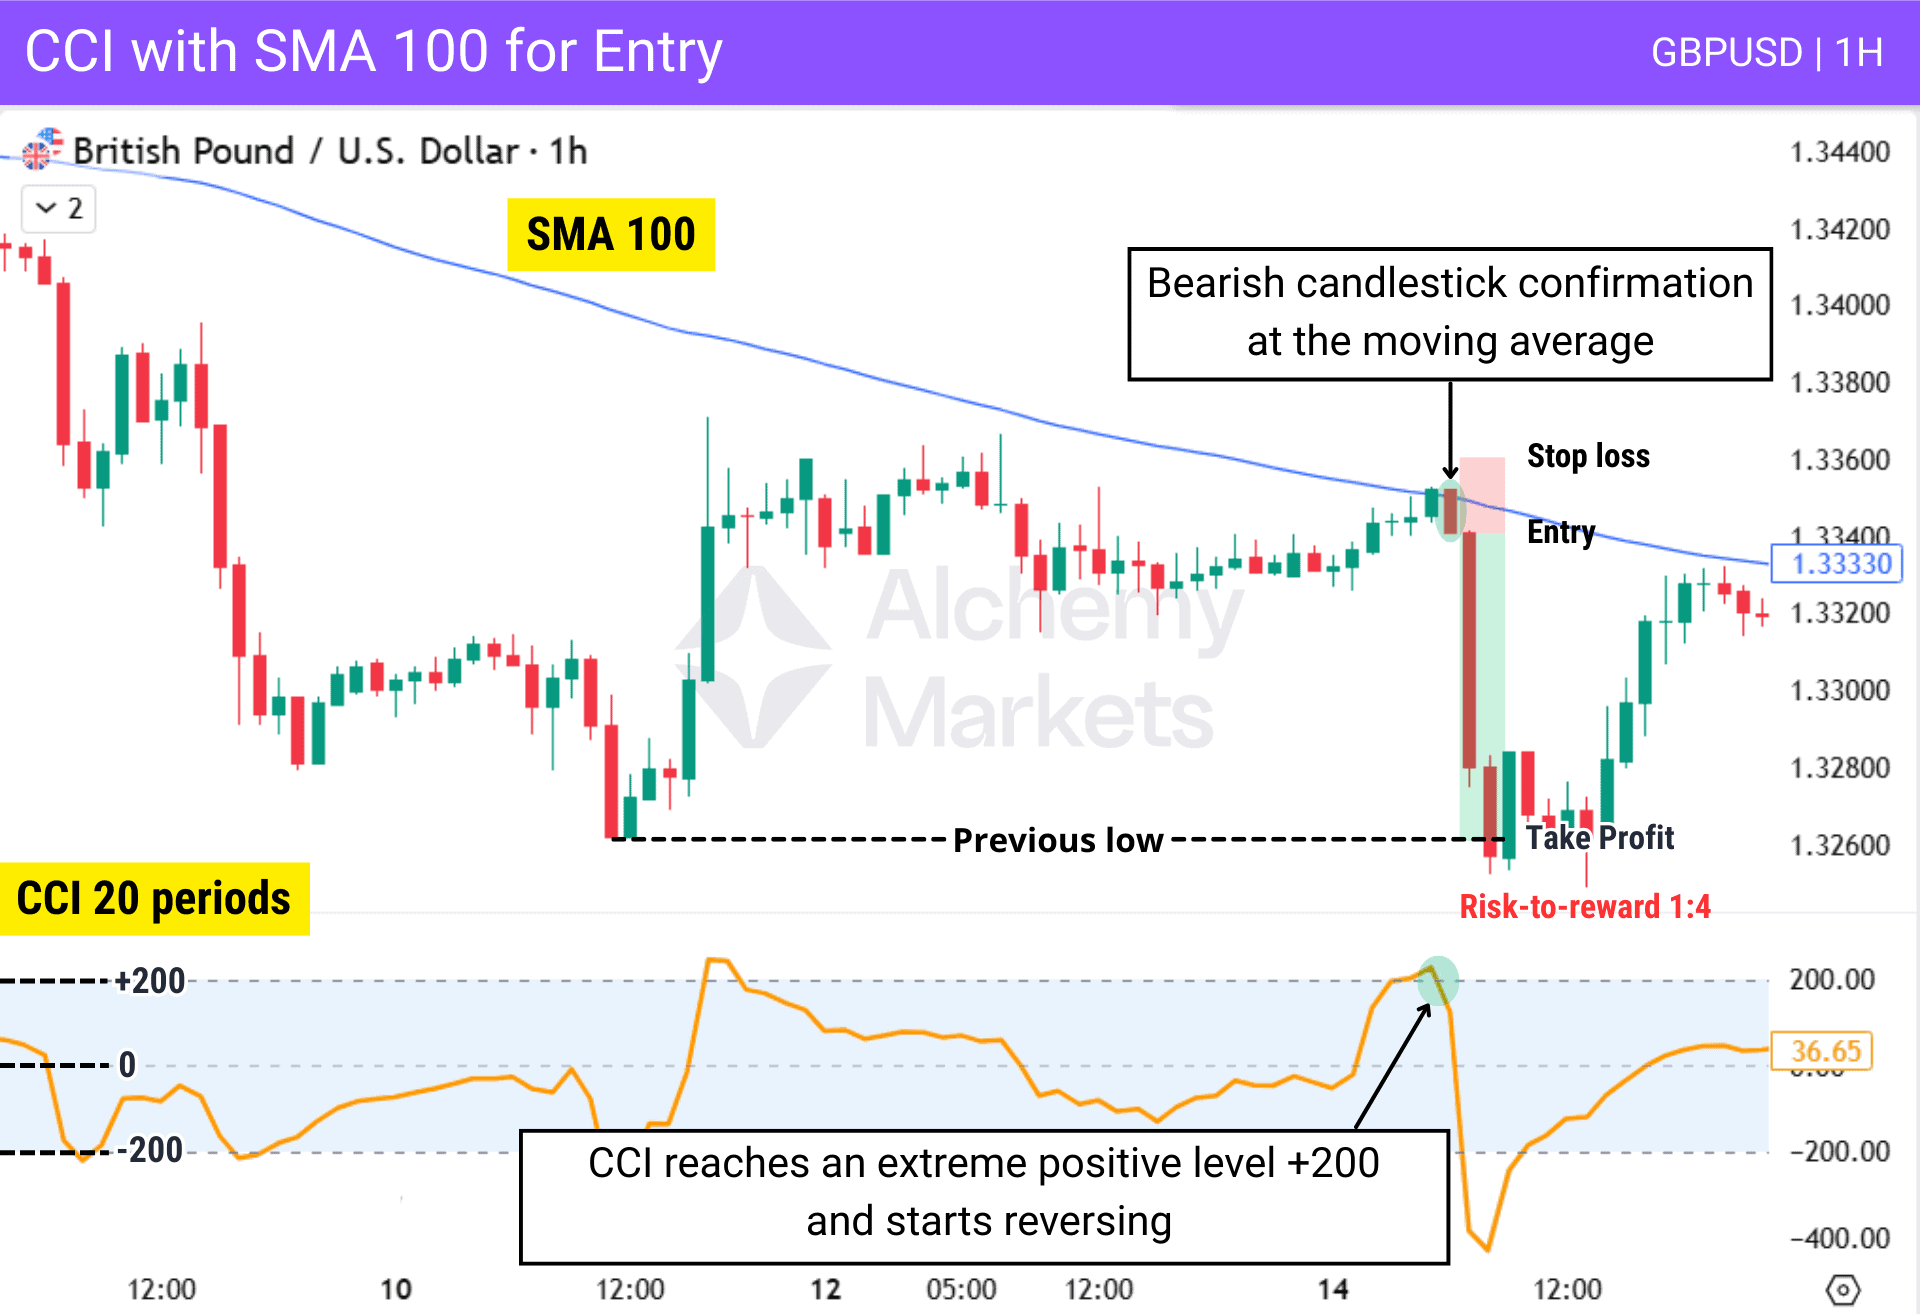
In this chart, the moving average is used as the entry location.
Price pulls back toward the moving average and rejects from it forming a bearish candlestick, while CCI reaches an extreme positive +200 and reverses.
These 2 signals provide a double confirmation to the setup.
CCI with Parabolic SAR
Parabolic SAR is a lagging, trend-following indicator that gives slightly delayed signals. Even though it reacts after price moves, combining it with CCI helps confirm trades and avoid false signals.
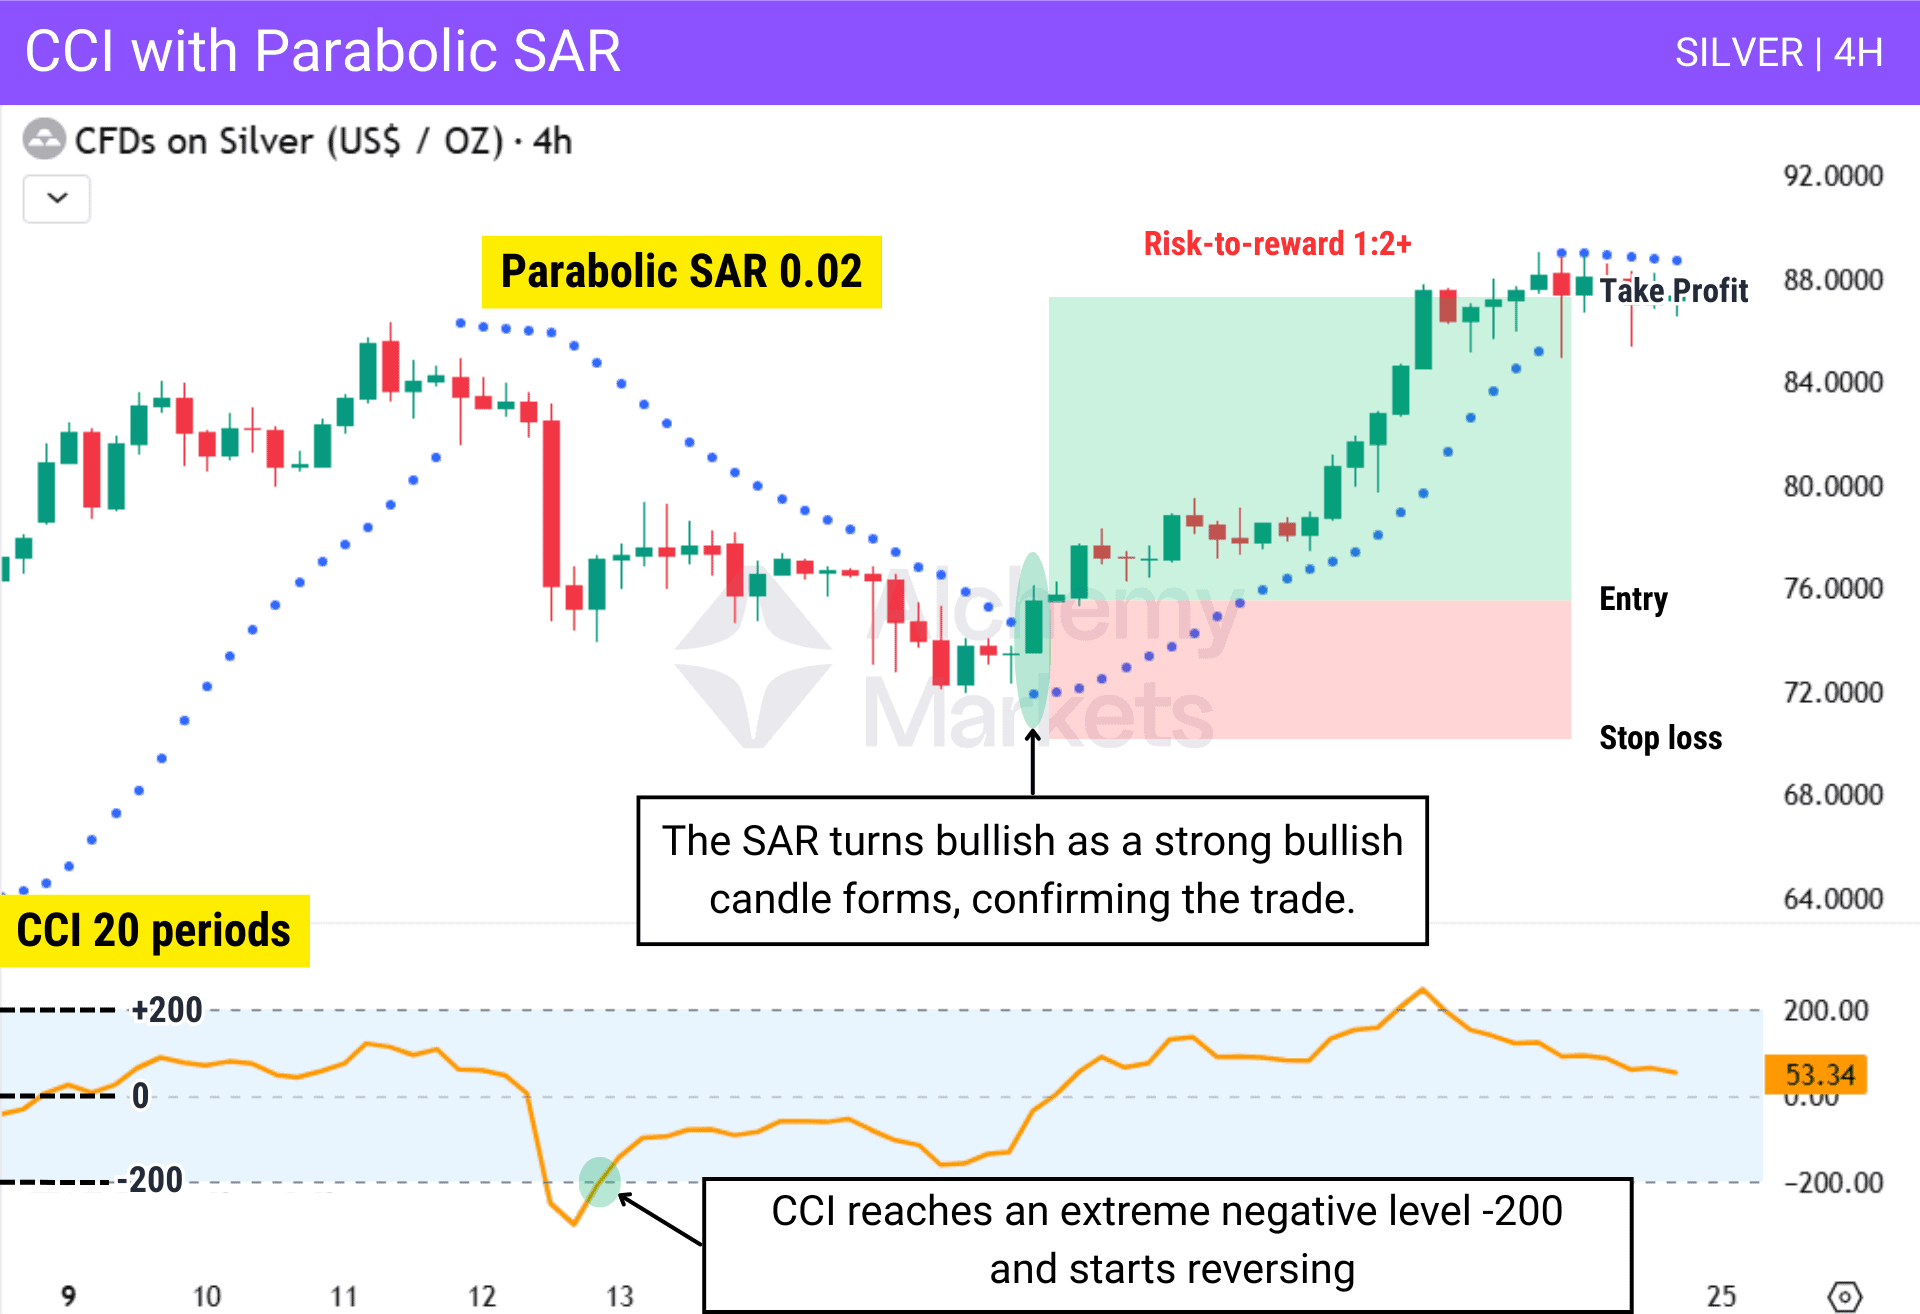
In this example, CCI reaches an extreme negative level -200 and starts reversing upward; but since the PSAR has not yet flipped, traders are able to avoid downward drift before the reversal.
The trade is only signalled when Parabolic SAR flips below price, validating bullish momentum, with the bullish candle confirming the entry.
Note
Parabolic SAR helps traders avoid entering too early because it only flips direction after price moves beyond the previous SAR dot level. This delay confirms that momentum has shifted, providing additional validation for the trade signal.
It can also provide an exit signal when it flips again in the opposite direction, acting similarly to a trailing stop loss.
CCI with Bollinger Bands
Bollinger Bands® and CCI can both be used to measure how far price has deviated from its average. Bollinger Bands show volatility expansion around a moving average, while CCI measures statistical distance from the mean.
When combined, they help identify deviations in price and provide additional confirmation for trades.
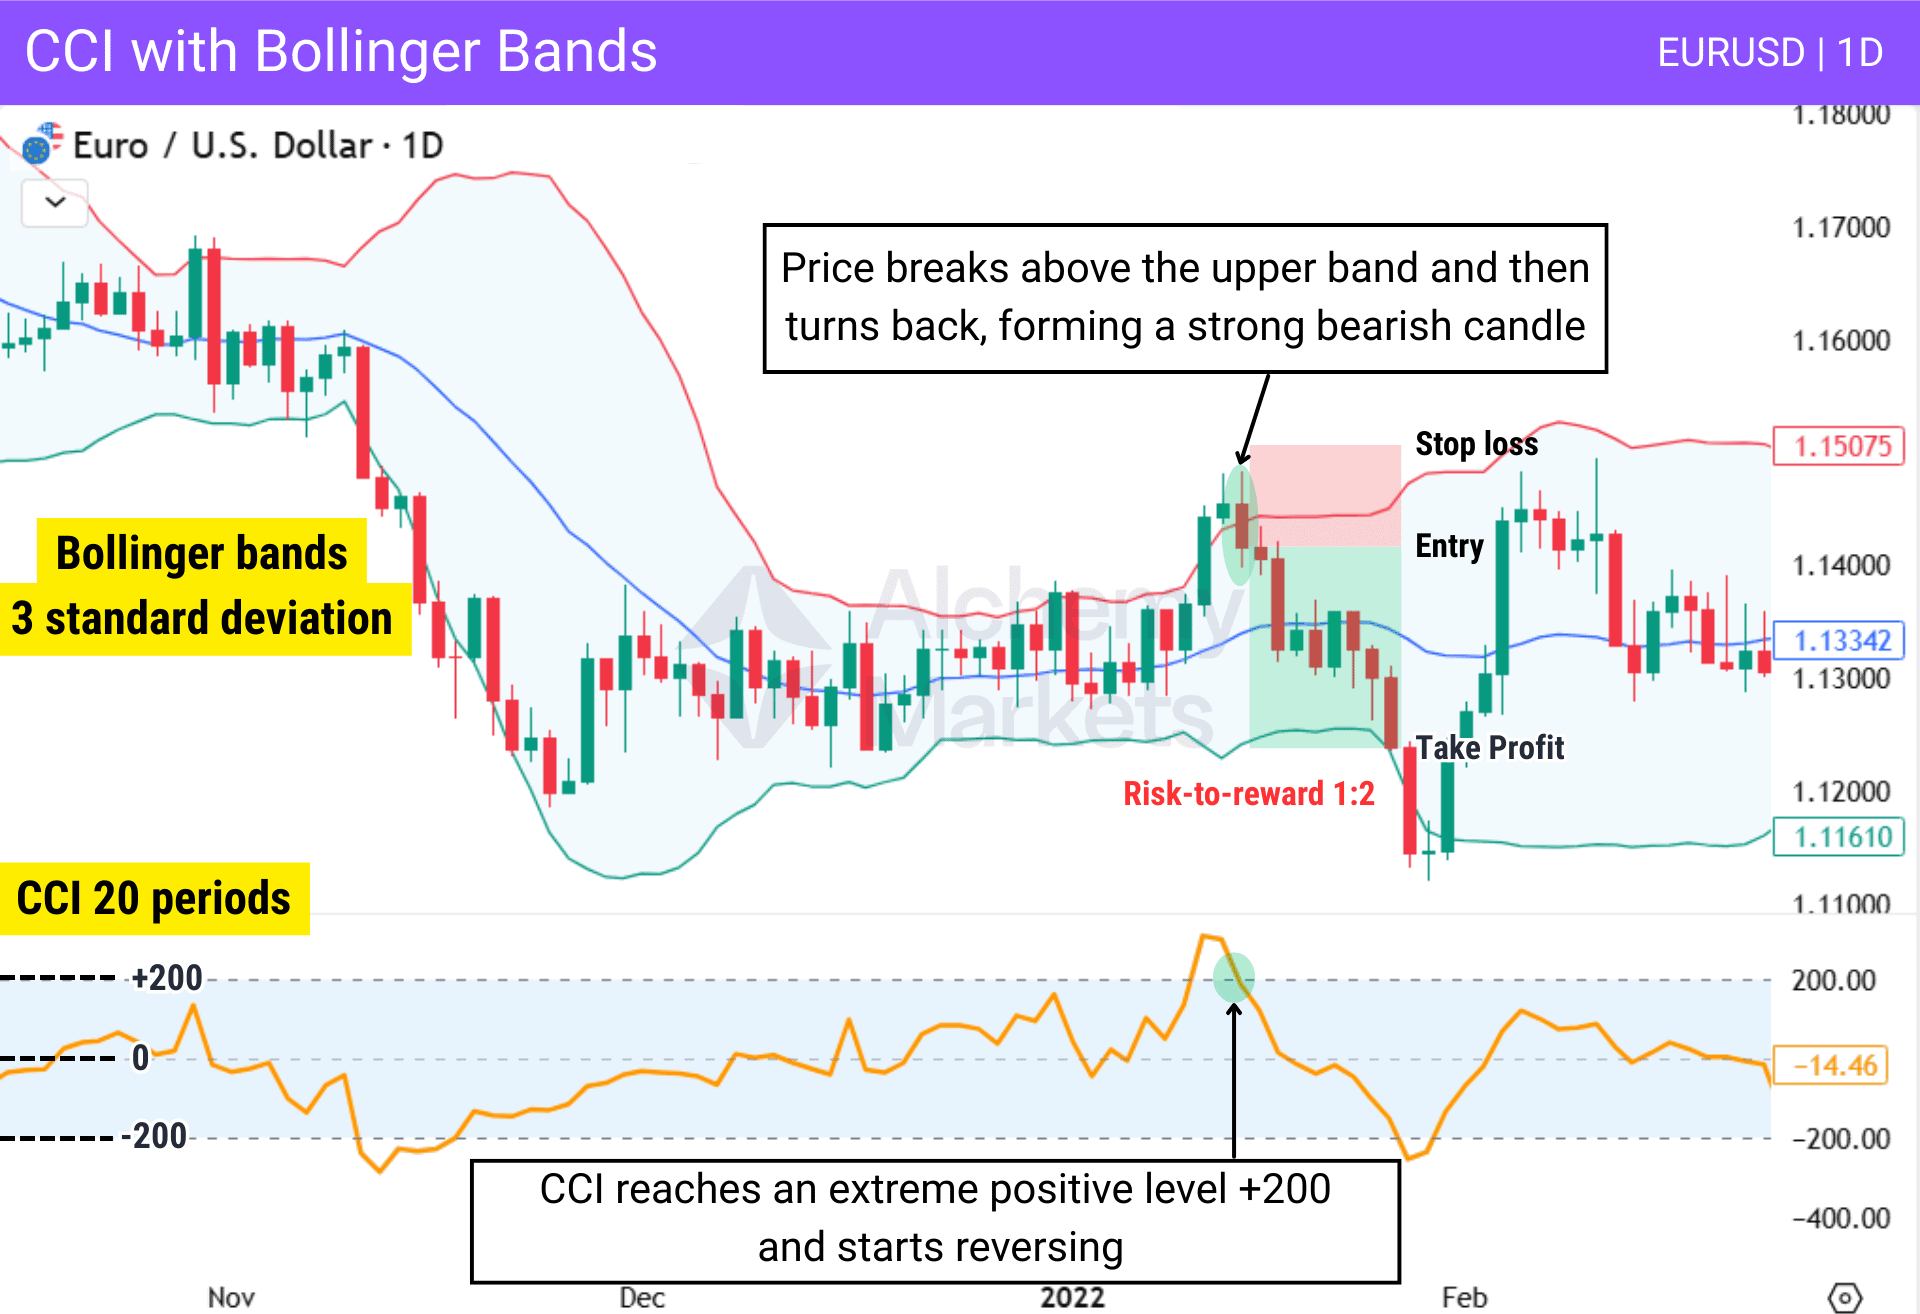
In this example, price breaks above the upper Bollinger Band and then turns back with a strong bearish candle, while CCI reaches an extreme positive level near +200 and starts reversing downward.
The bearish rejection candle at the upper band confirms the entry, with the lower band serving as an exit point.
Breakout Trading
CCI can also be used to confirm breakout strength. In this context, readings above +100 or below −100 reflect momentum expansion as price moves away from consolidation.
When CCI accelerates during a breakout, it suggests active participation behind the move.
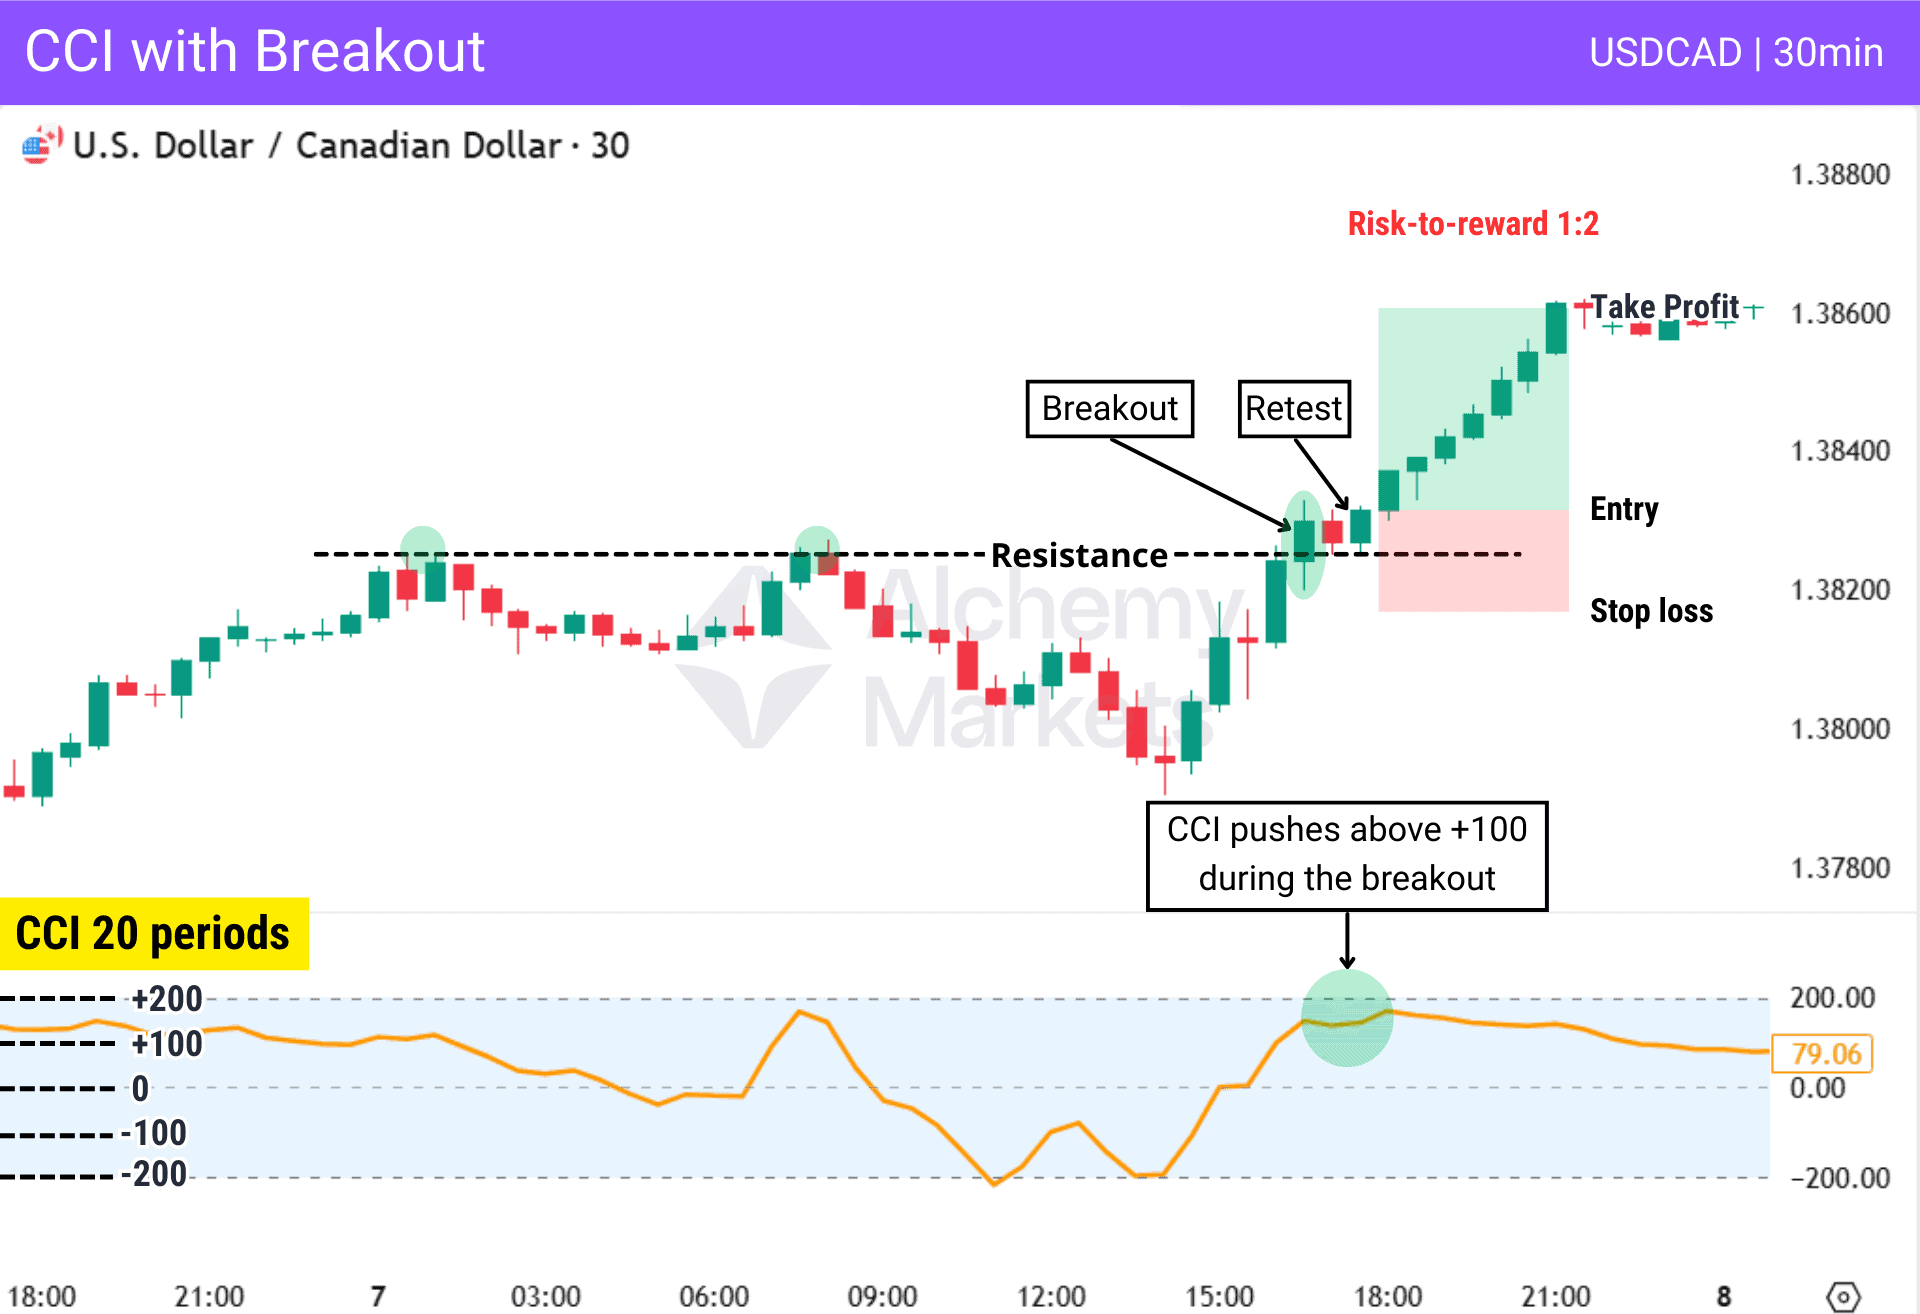
In this example, price breaks above a clear resistance level with a strong bullish close. At the same time, CCI pushes above +100, confirming upward momentum expansion.
Then price retests the broken level and forms a new bullish candle, providing a clear signal to enter, with the stop placed below the resistance and the target aiming for a 1:2 risk-to-reward ratio.
Mean Reversion Trading
Mean reversion assumes that price tends to return toward its statistical average after extended deviation.
Since CCI measures how far price has moved from its mean, it can be used for entries when the indicator reaches extreme levels and starts reversing. Traders can also define the mean using tools such as moving averages.
In this approach, price is allowed to stretch away from the average before the trade is taken. The target is the return toward that average as the market moves back toward equilibrium.
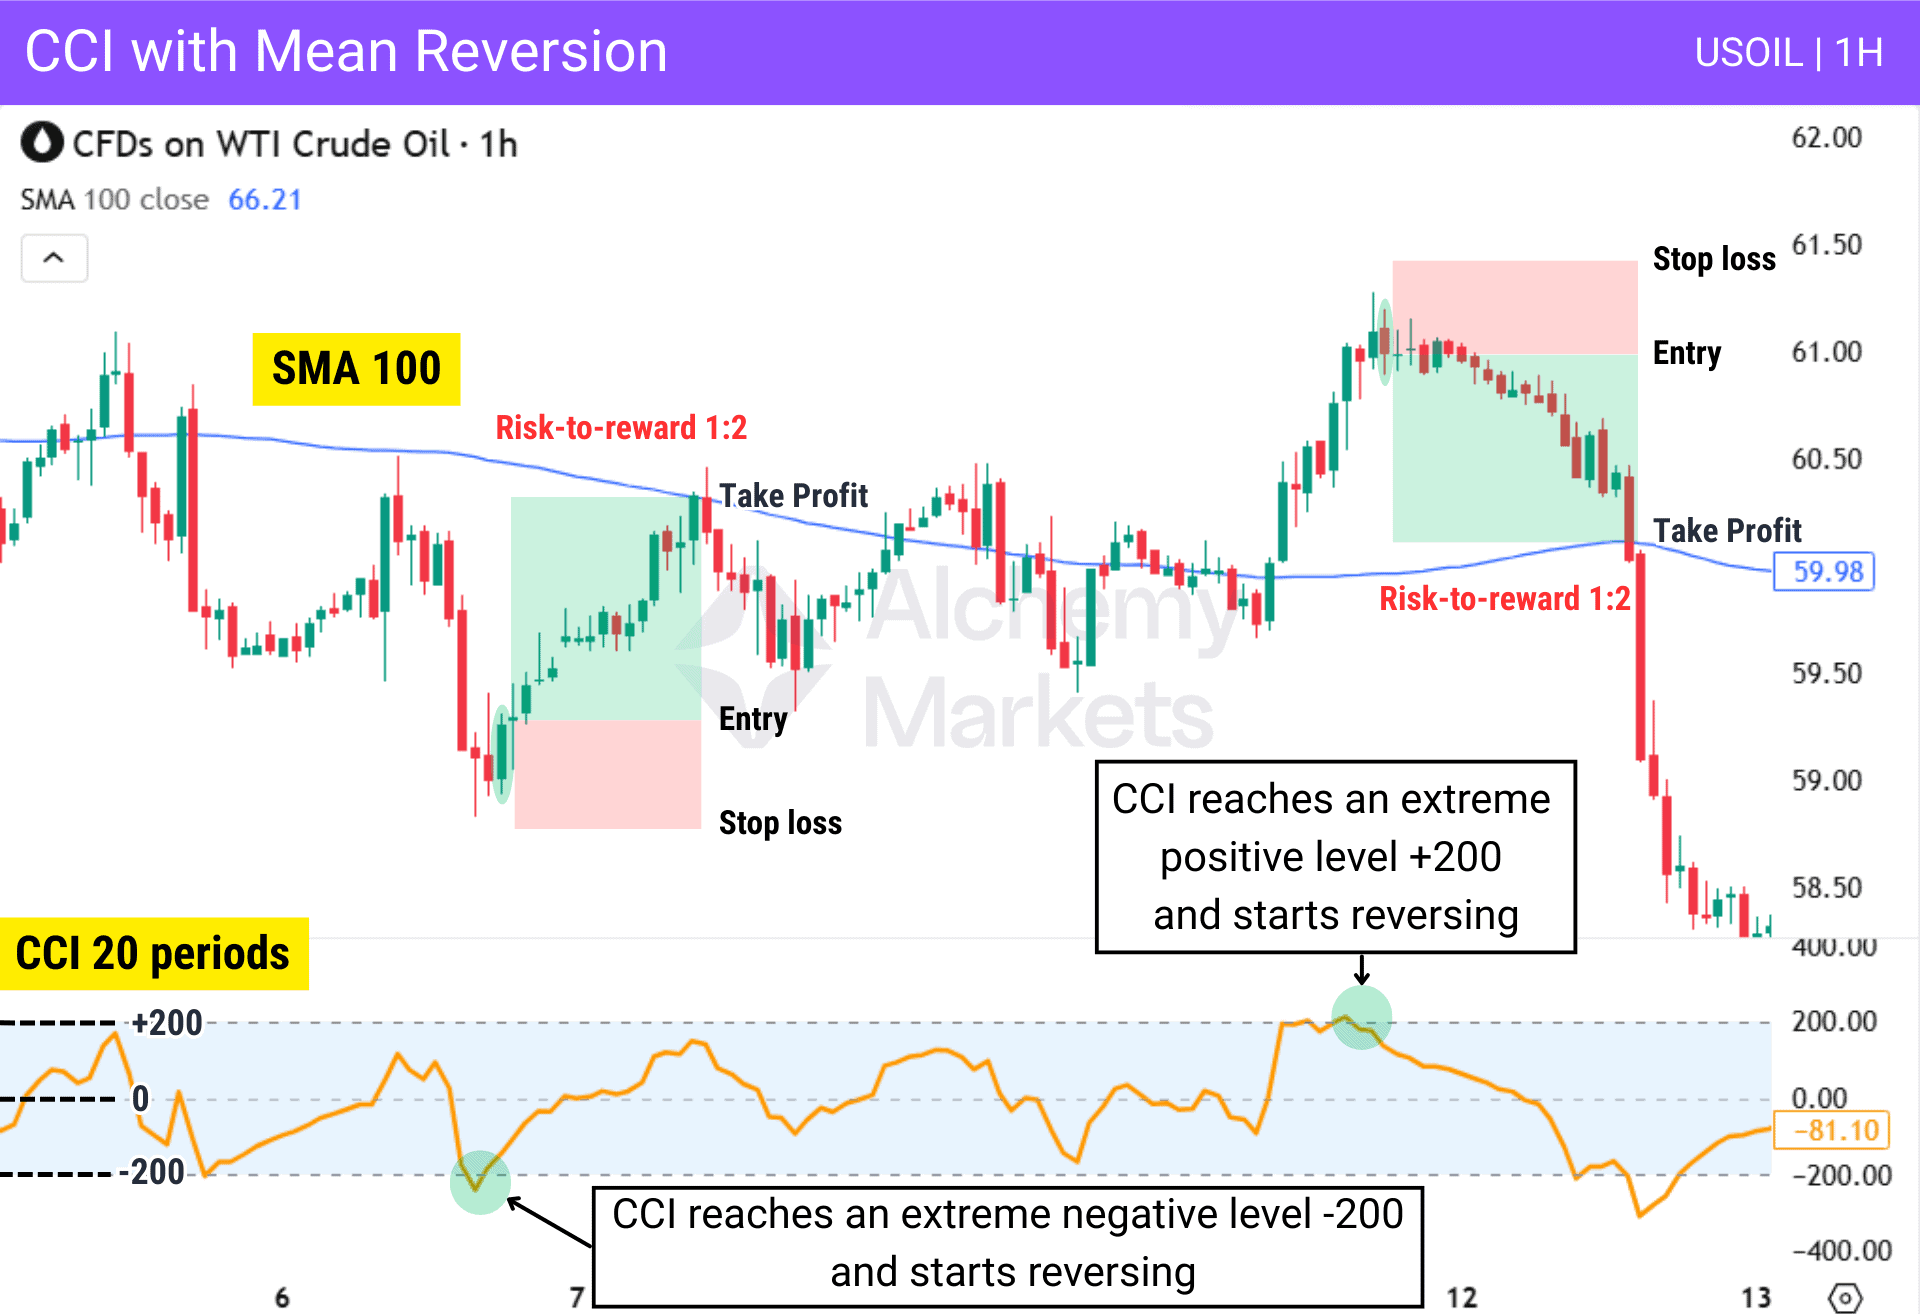
In this example, price deviates far below the 100-period simple moving average and forms a strong bullish candle, while CCI reaches −200 and starts reversing upward, which aligns with the long entry targeting the SMA as the mean of price.
Later, price deviates far above the same moving average while CCI reaches +200 and starts reversing downward, which aligns with the short entry targeting the SMA again.
The SMA acts as a magnet where price often returns after bullish or bearish movements.
Trend Following Approach
Trend-following strategies are all about capturing the majority of a trending move, and not about exiting at fixed risk-to-reward ratios. The CCI can be used in this regard to identify when the momentum of a trend is weakening, giving traders a clear sign to exit a winning trade.
Here’s how traders can apply a trend following approach with CCI:
In a trend, when price pulls back, CCI usually moves toward extreme levels before reversing. When it reverses, it signals that the pullback is weakening and that price may be ready to resume its trend.
When CCI is combined with trend following, it can help identify both entries and exit points.
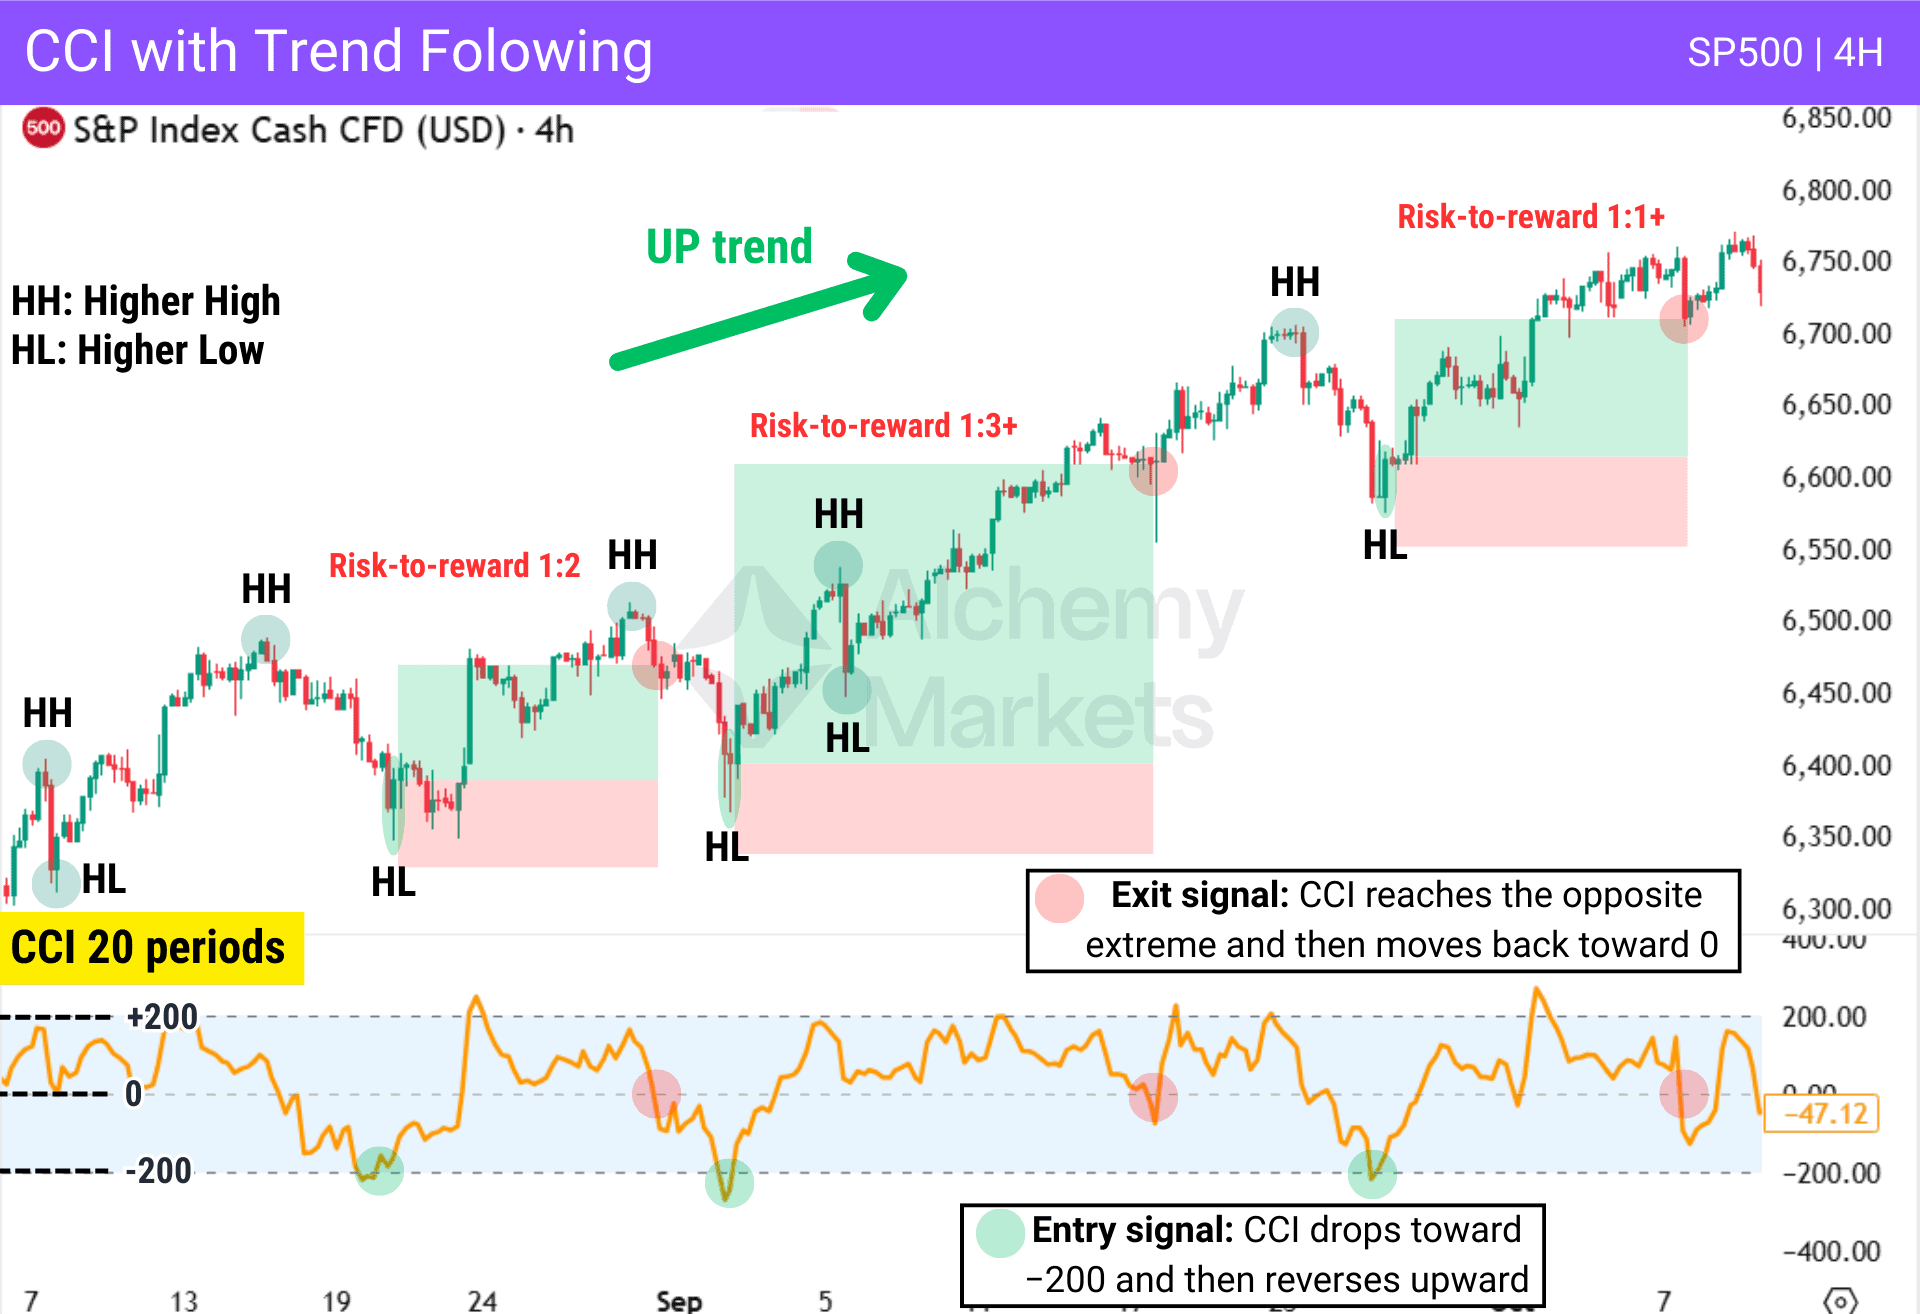
In this example, price forms a series of higher highs and higher lows, confirming that the market is in an uptrend. During pullbacks, CCI drops into the deep negative extreme −200 and then begins reversing upward.
This reversal suggests that bearish pressure inside the pullback is weakening and that price may be ready to resume the uptrend. A bullish candlestick confirmation then provides the entry signal.
CCI also provides exit signals when it reaches the opposite extreme and then moves back toward the zero line, signalling that bullish momentum may be weakening.
Ranging Markets
In ranging markets, price moves between levels such as support and resistance.
In these conditions, CCI extremes become more meaningful because deviations toward extremes may indicate overbought or oversold conditions, especially if that happens at the defined levels.
Traders often anticipate a range when price reacts twice at one key price level and forms a pivot at the opposite level. This suggests the market is starting to respect support and resistance.
Additionally, when momentum weakens, volume decreases, or when price rejects at the same levels — these conditions suggest that a range is in play.
Typical structure involves identifying clear horizontal support and resistance, waiting for price to react at the support or resistance, and using CCI extremes (+−100 or +−200) as additional confirmation. The trade then targets the opposite side of the range.
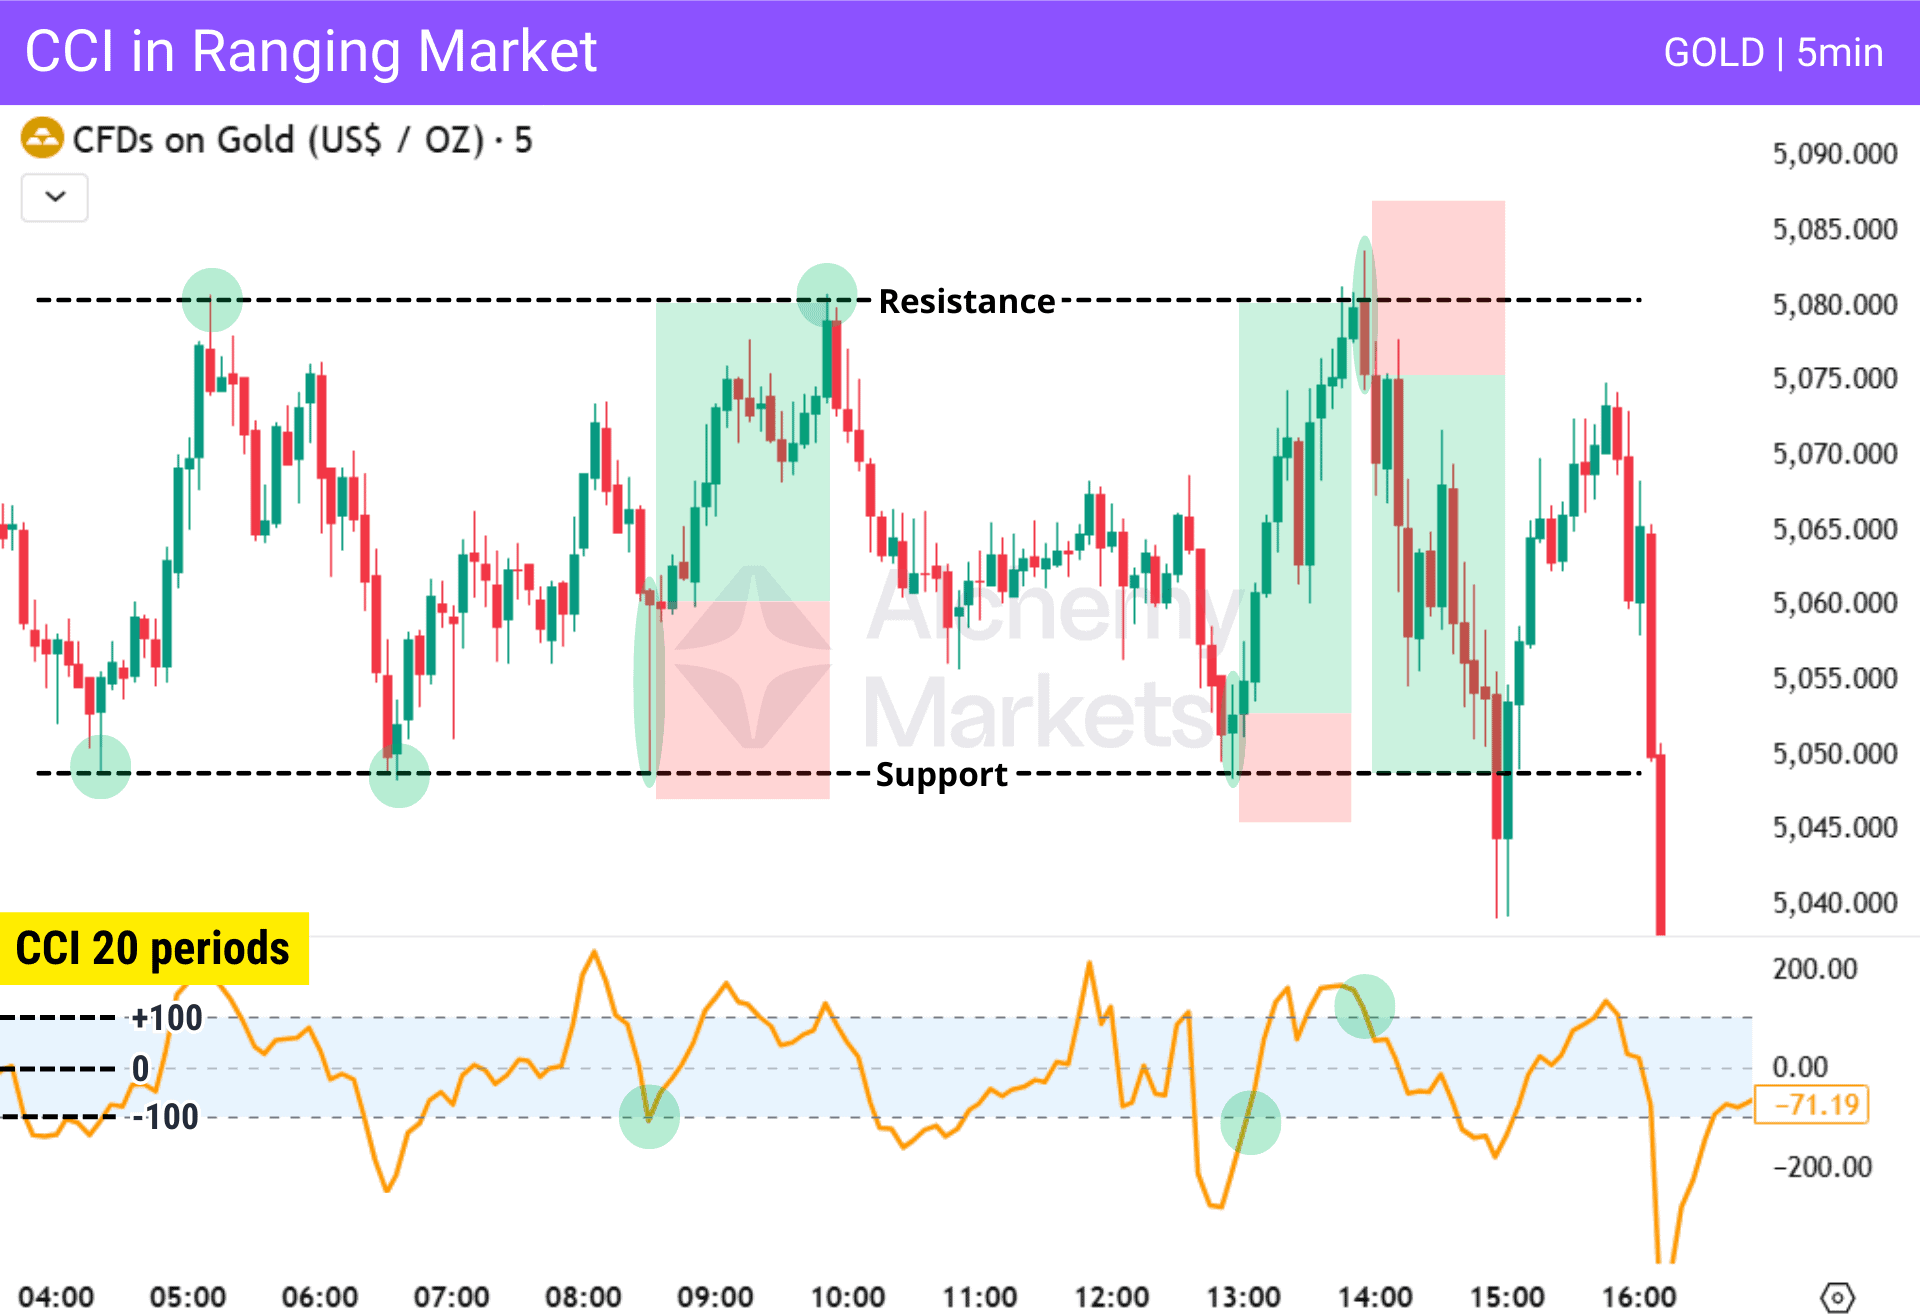
In this example, support and resistance define a clear sideways structure. Each time price reaches a boundary, it reacts with an opposite candlestick pattern while CCI reverses from extreme levels, reinforcing the setup.
Multi-Timeframe CCI Strategy
Multi-timeframe analysis is a structured approach that uses higher timeframes to identify trend direction and key levels, while lower timeframes are used to refine entries with greater precision. This helps align broader market context with tactical execution.
CCI can be integrated into this framework to identify deviations on each timeframe and provide additional confirmation for the trade.
Higher Timeframe (Daily)
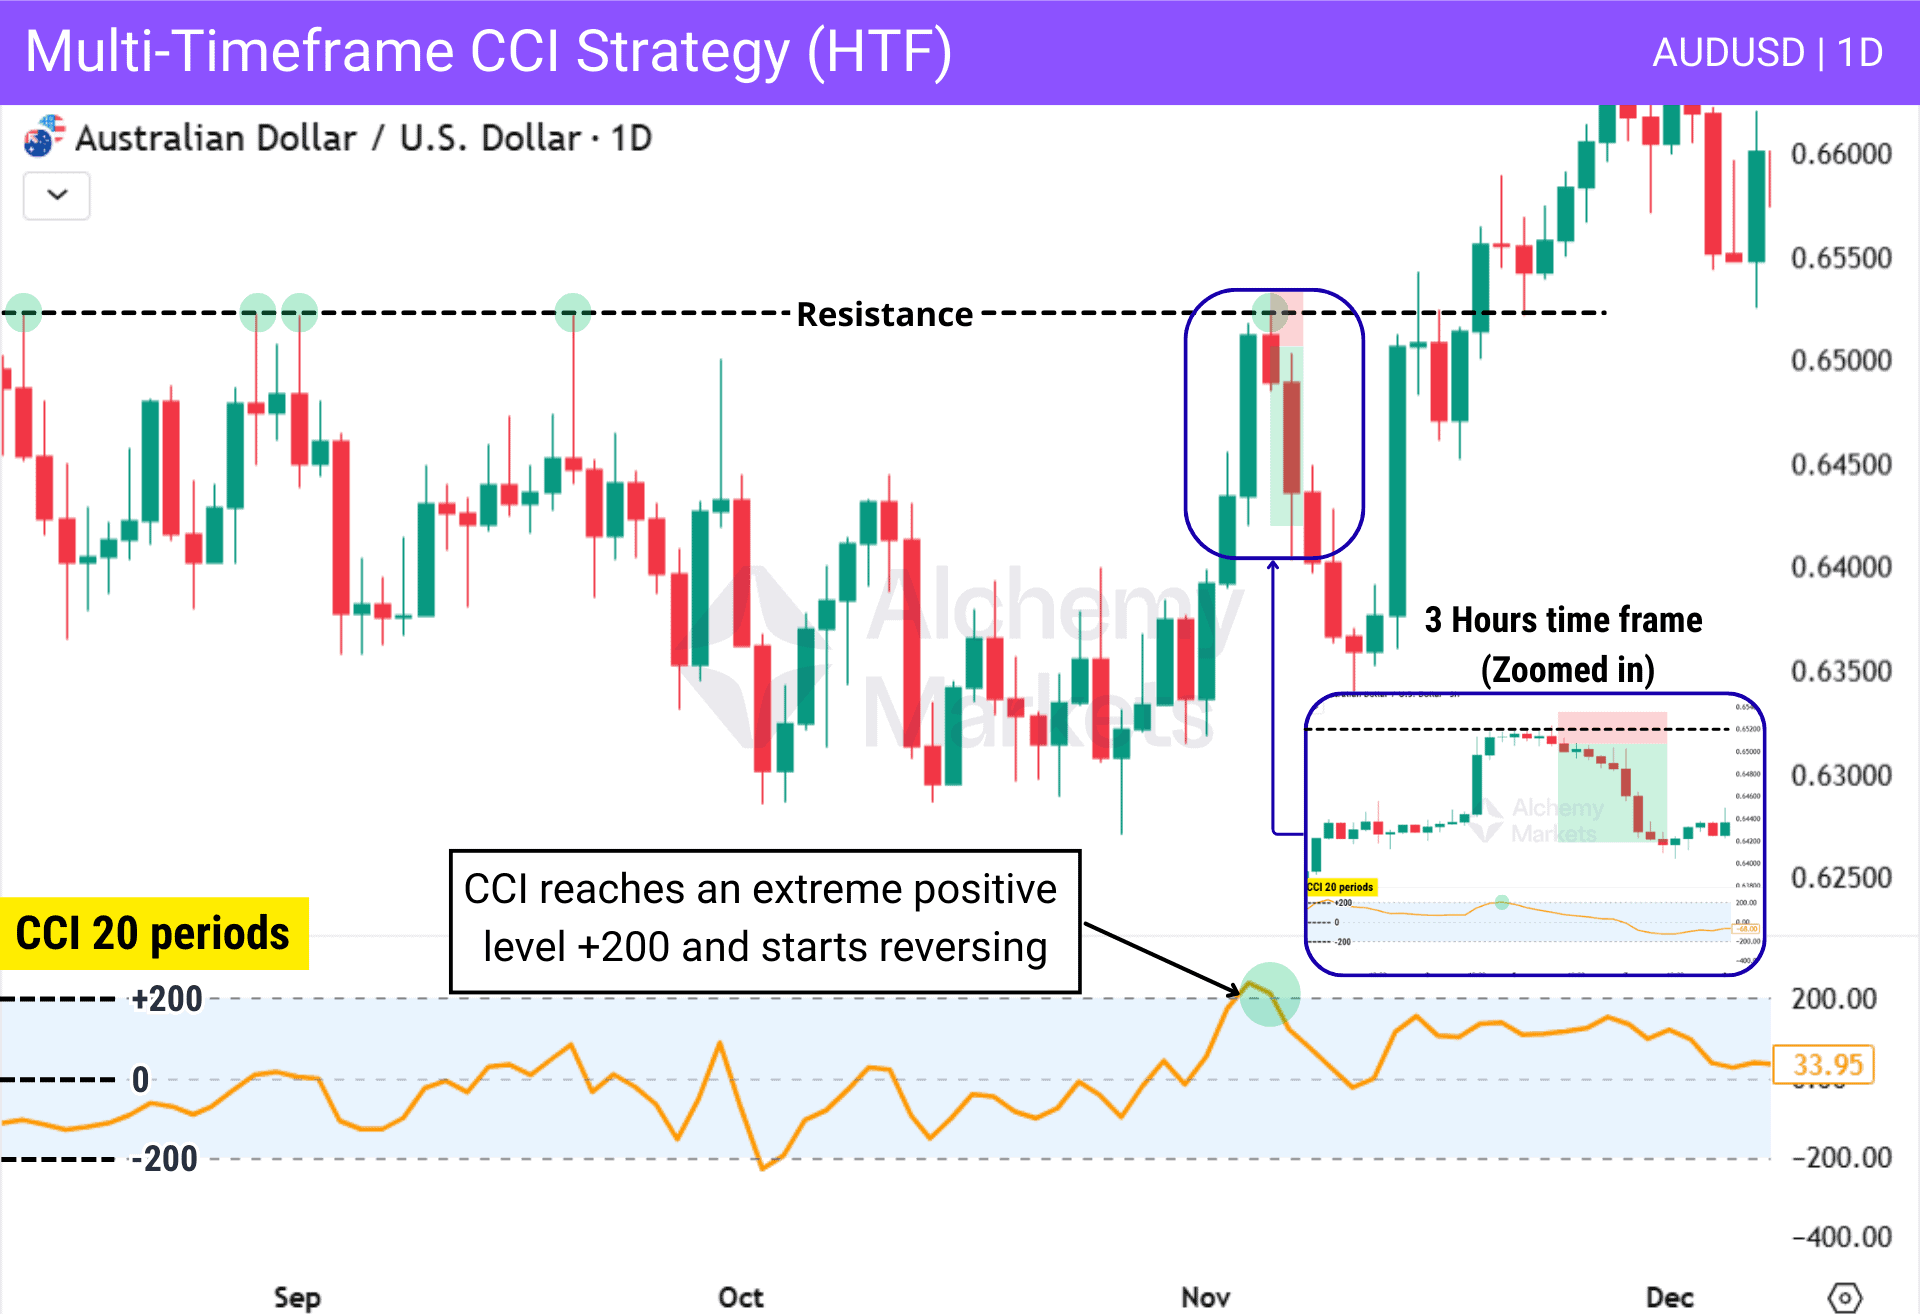
On the daily timeframe, AUDUSD forms a clear resistance level that has been tested multiple times. When price returns to this resistance, CCI simultaneously reaches an extreme positive level near +200 and begins reversing.
This alignment between price at a key level and CCI exhaustion suggests weakening bullish momentum on the higher timeframe.
Lower Timeframe (3Hours)
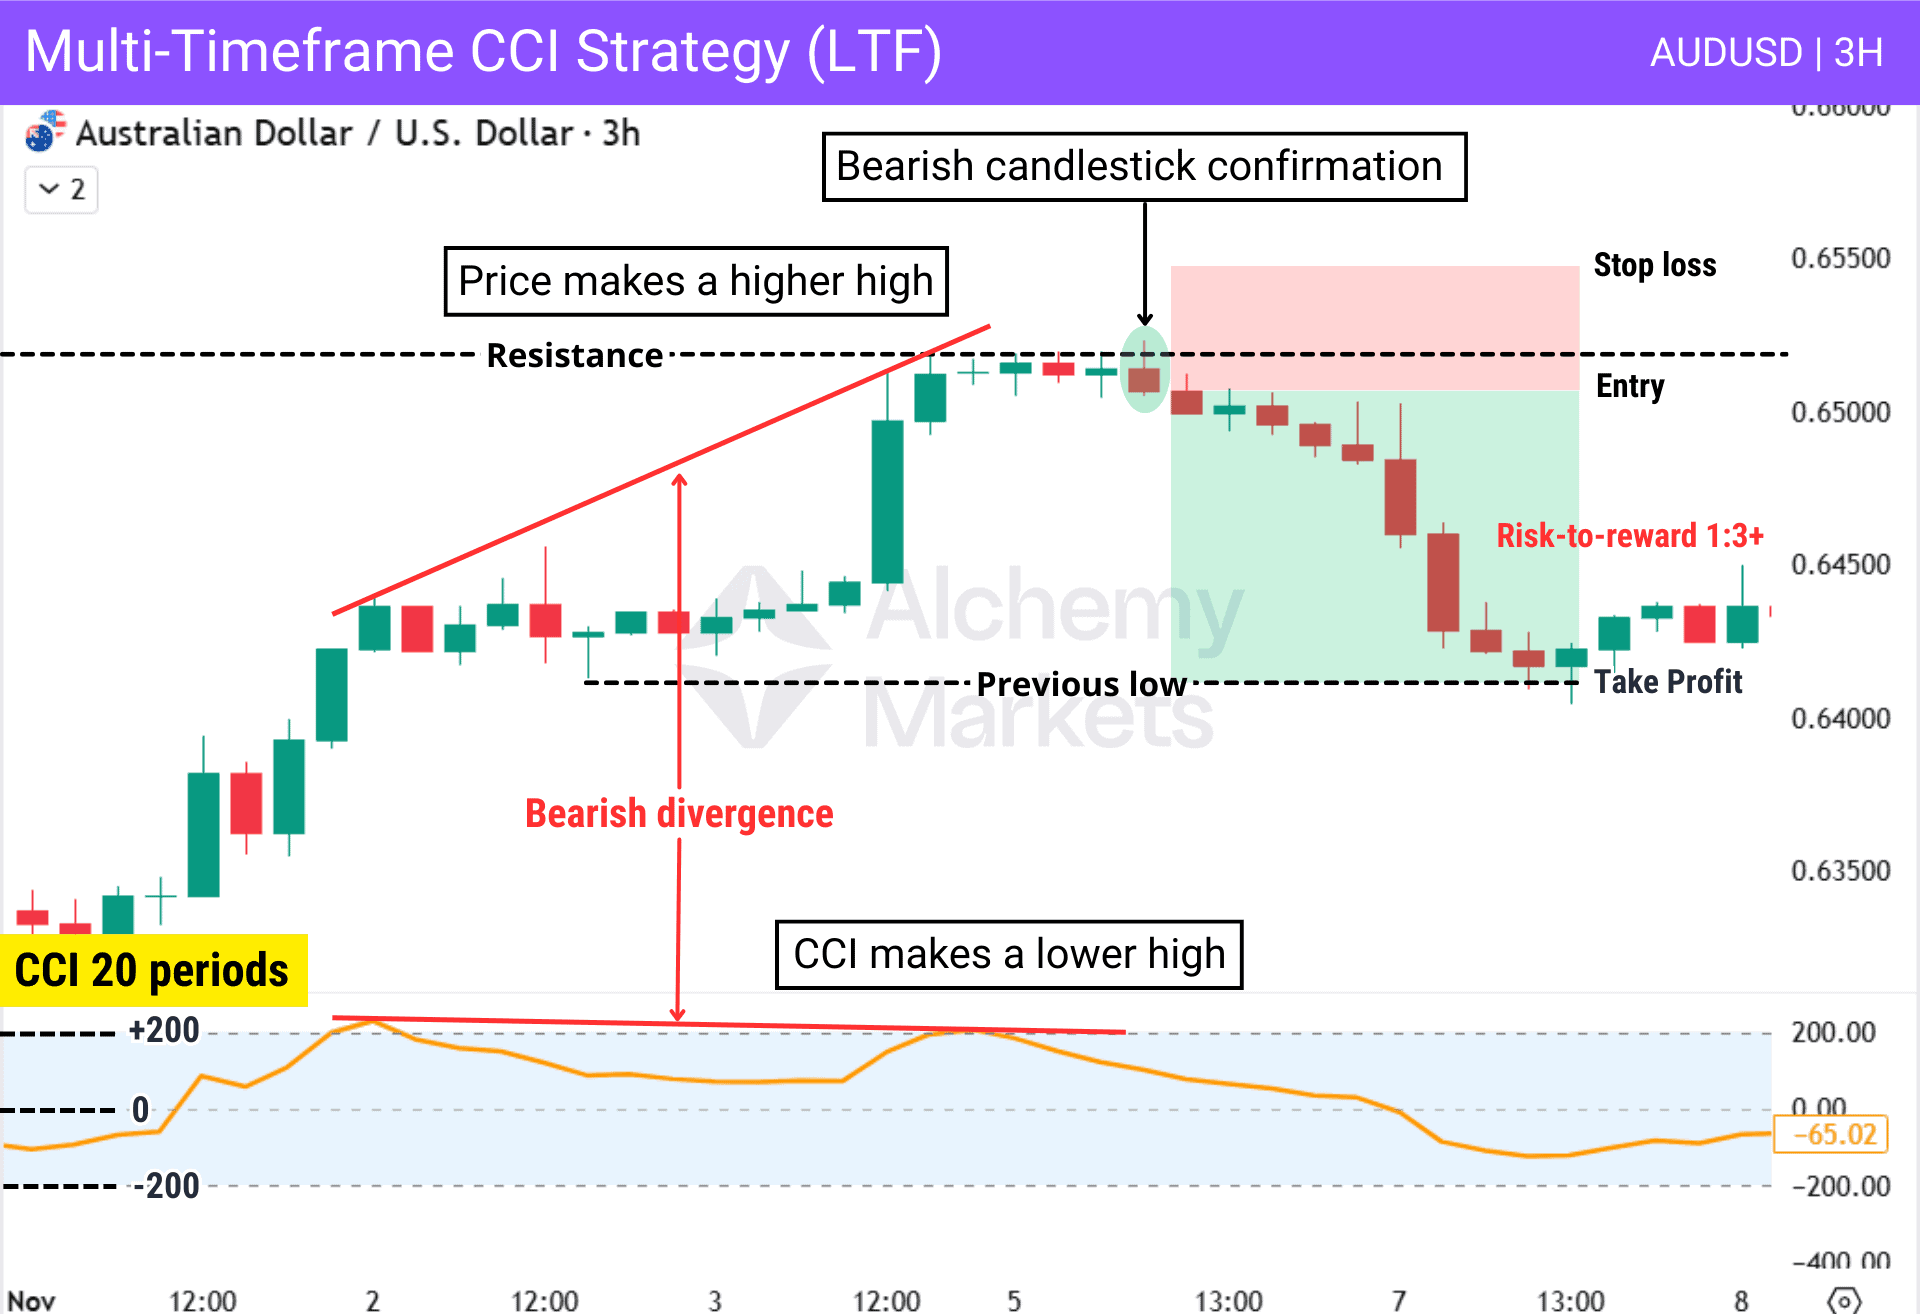
When we zoom into the 3-hour timeframe, more detail appears around the same higher-timeframe resistance.
Price forms a higher high at the resistance level while CCI makes a lower high, creating bearish divergence. Then price rejects the resistance level with a strong bearish candle, providing a precise short entry signal.
In this case, CCI behaviour aligns across both timeframes. On the higher timeframe, CCI reaches a positive extreme and begins reversing, while on the lower timeframe it forms bearish divergence near a positive extreme, reinforcing the setup.
Combining CCI with Price Action and Market Structure
CCI combined with market structure and price action can provide strong setups aligned with the trend.
By using break of structure (BOS) and change of character (CHoCH) to identify trend direction, swing points to define logical targets, and CCI extremes with price action to confirm entries.
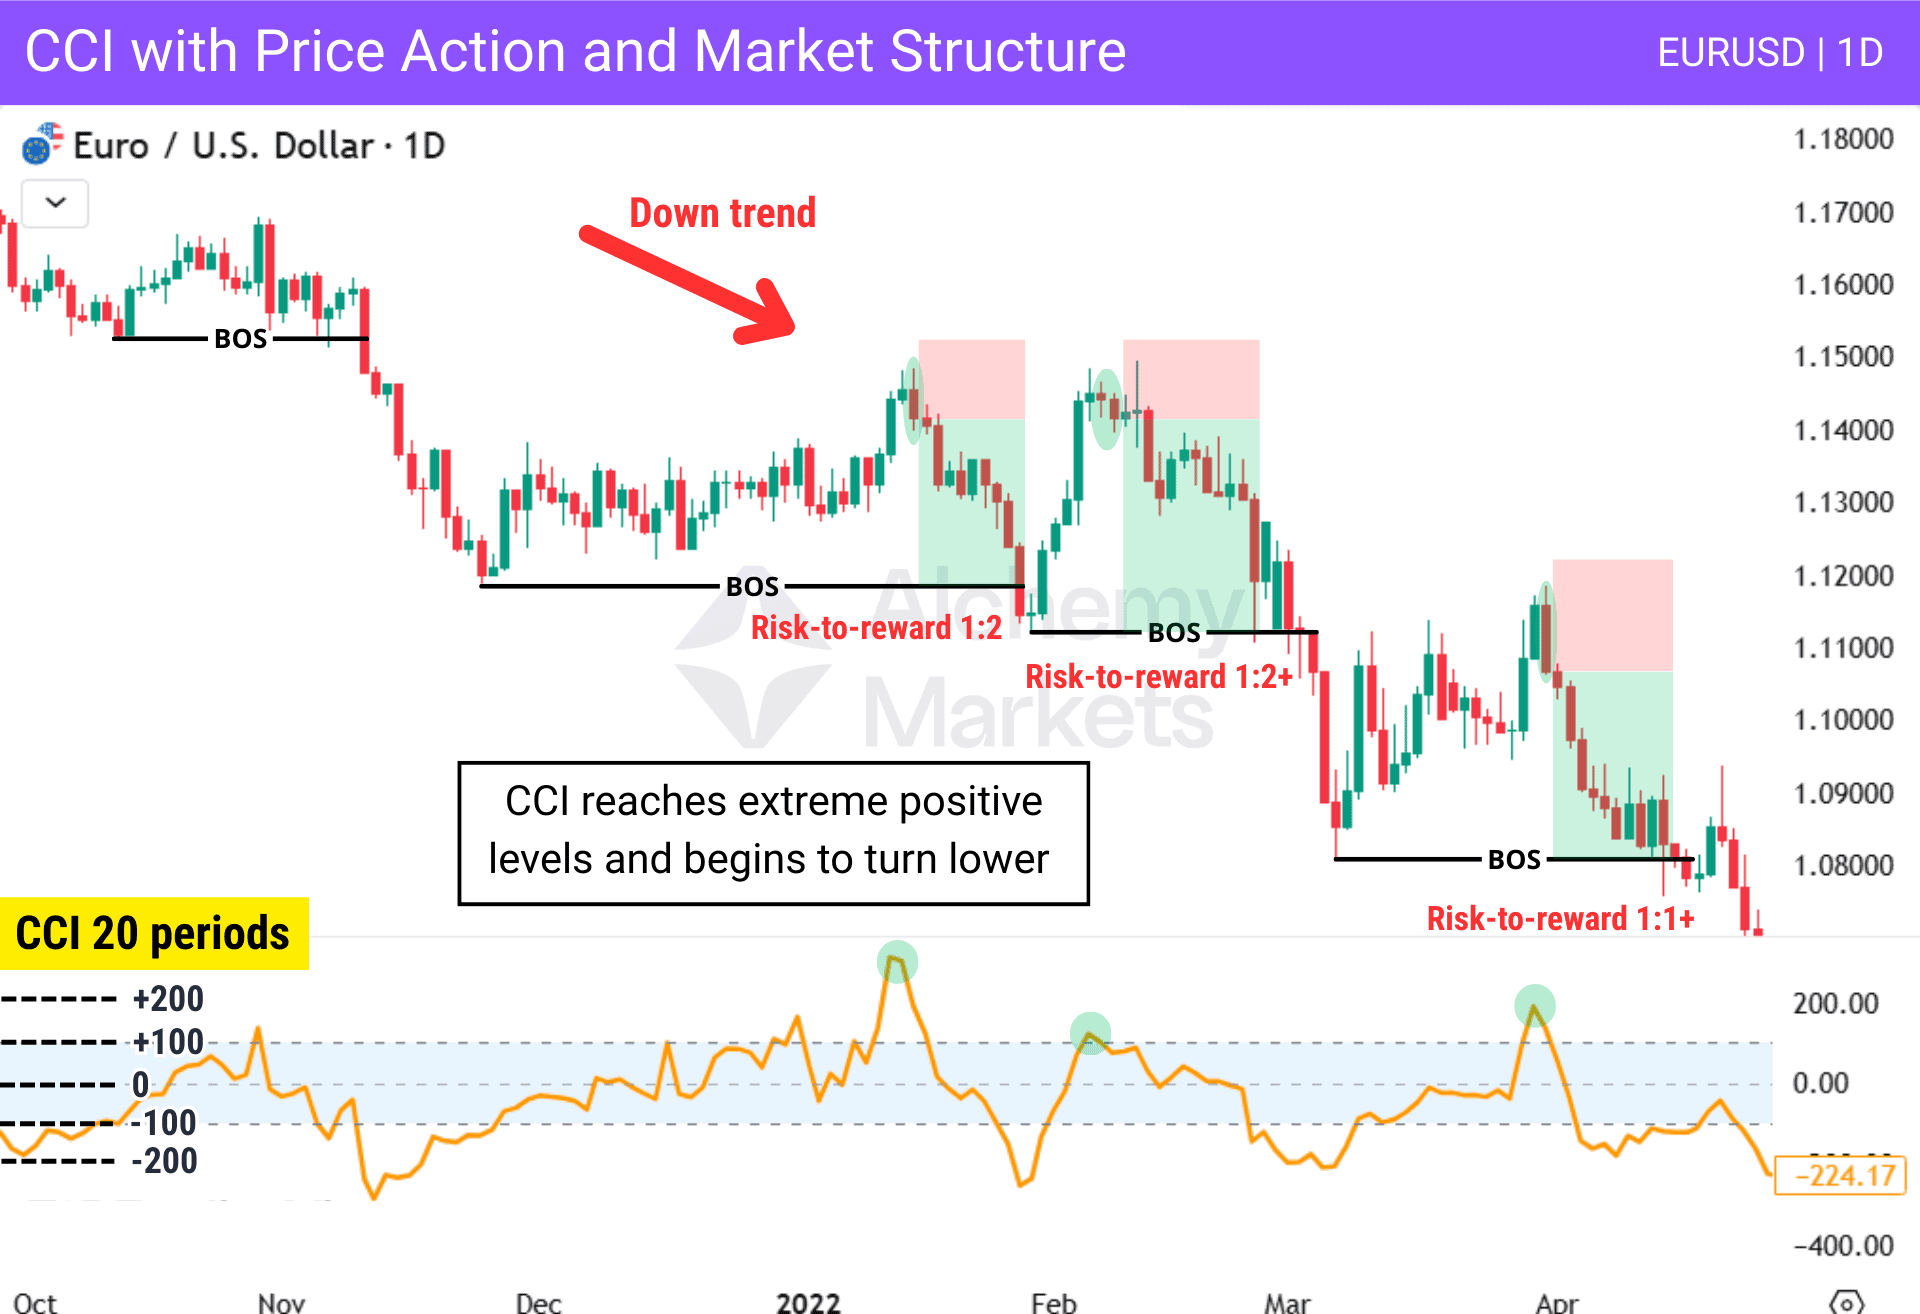
Price breaks structures multiple times to the downside and forms strong bearish candles (such as a bearish engulfing pattern) during pullbacks, signalling that price is ready to resume the trend.
As the pullback develops, CCI reaches extreme positive levels and begins to turn lower, confirming the trade, while candlestick confirmation provides the entry signal and increases the probability of continuation.
CCI with Volume Analysis
Volume shows whether momentum is supported by real market participation. CCI measures deviation from the average, but it does not show commitment behind the move. When both align, signals become more reliable.
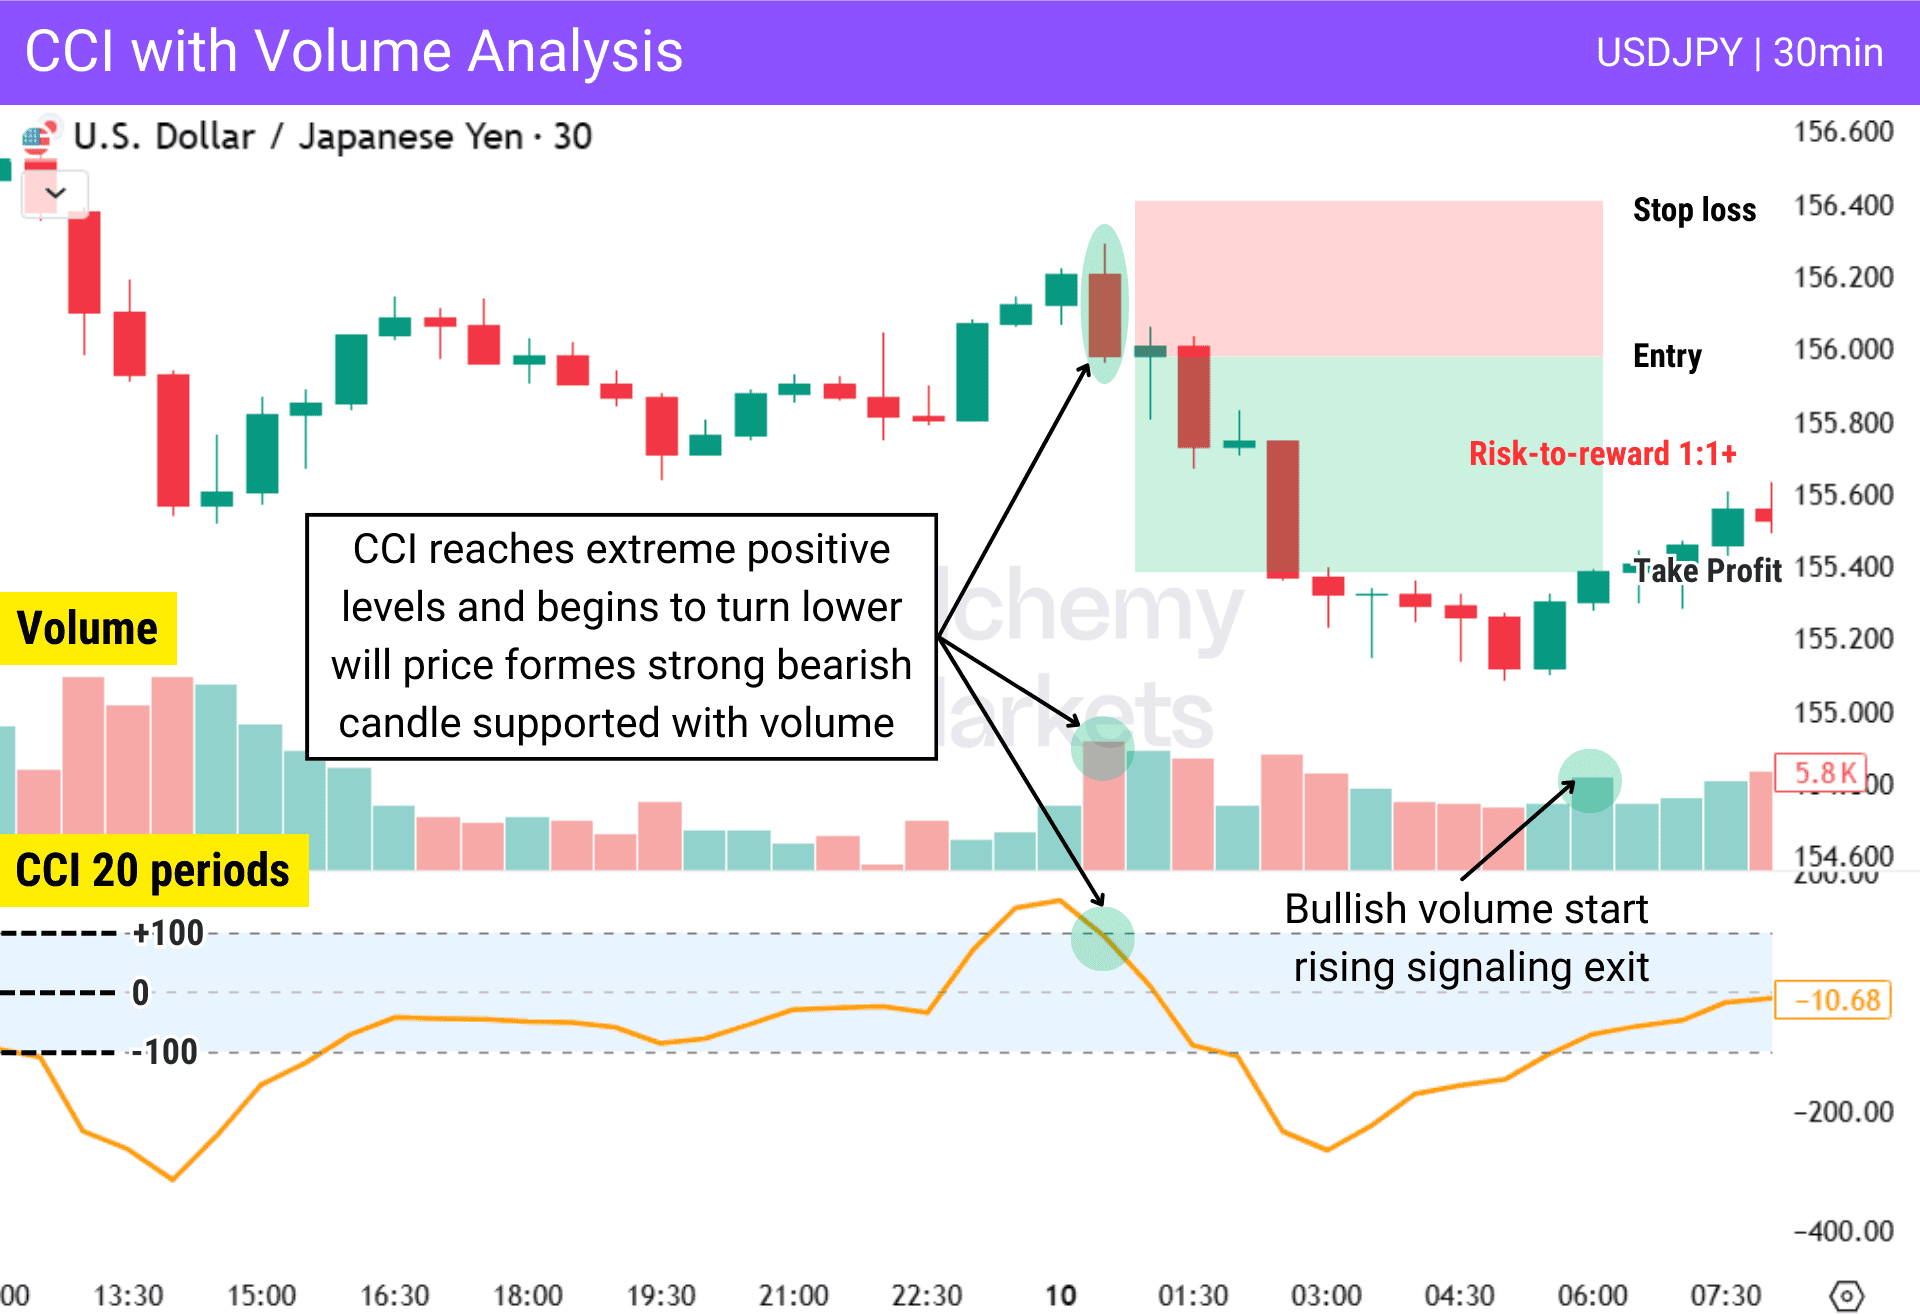
In the chart above, CCI pushes above the extreme positive level +100. As CCI begins to turn lower and a strong bearish candle forms with elevated volume, it signals that sellers are stepping in and that it may be a good time to place a short trade.
The later increase in bullish volume suggests participation shifting again to buyers, warning of a potential exit.
CCI Divergence for Reversal Trading
Reversals usually occur when price reaches strong structural levels or zones, or during extreme macro events. CCI divergence can help confirm these reversals and take advantage of them.
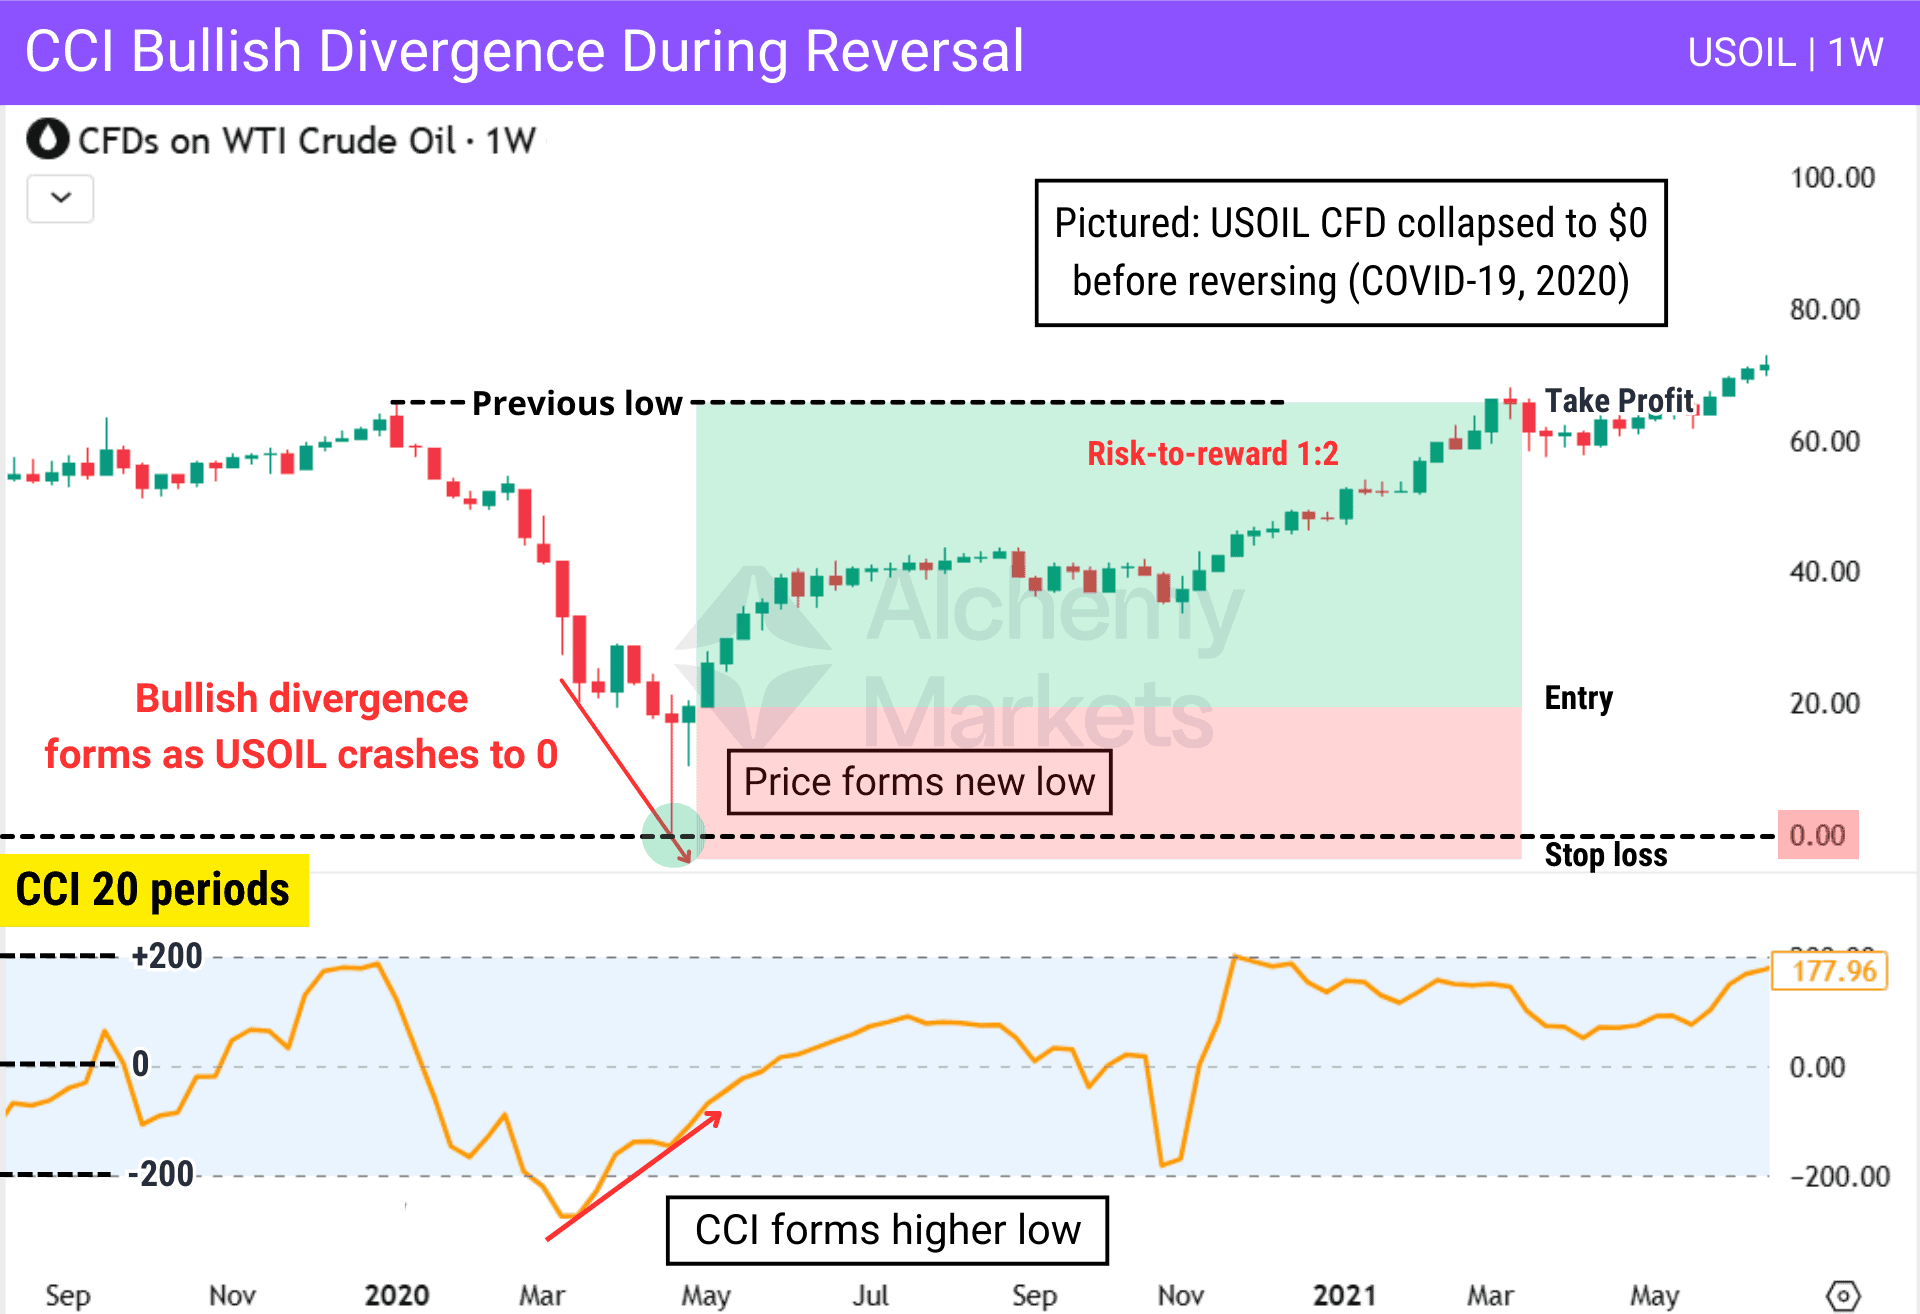
In this weekly example, USOIL CFD collapsed during the COVID-19 shock before beginning to stabilise. Although price formed a new low, CCI formed a higher low, signalling that selling pressure was weakening.
The divergence appeared near the psychological level 0, increasing the probability that price could stabilise and reverse.
CCI Momentum Shifts
Momentum shifts occur when market pressure transitions quickly from buying to selling or from selling to buying after an extended move. CCI helps identify these shifts earlier when the indicator reaches extreme levels and then starts reversing sharply.
However, CCI extremes alone do not always signal a reversal. During strong market movements the indicator may reach +100 or +200 multiple times before price actually turns, which can produce false signals.
Traders must combine CCI signals with additional confirmations. These may include alignment with the higher-timeframe bias, reactions at strong levels, or clear rejection candles. Extreme CCI readings that appear randomly in the middle of a move are usually less reliable.
Even with confirmation, momentum signals can fail. Using a stop loss and appropriate position sizing helps manage risk when trading these setups.
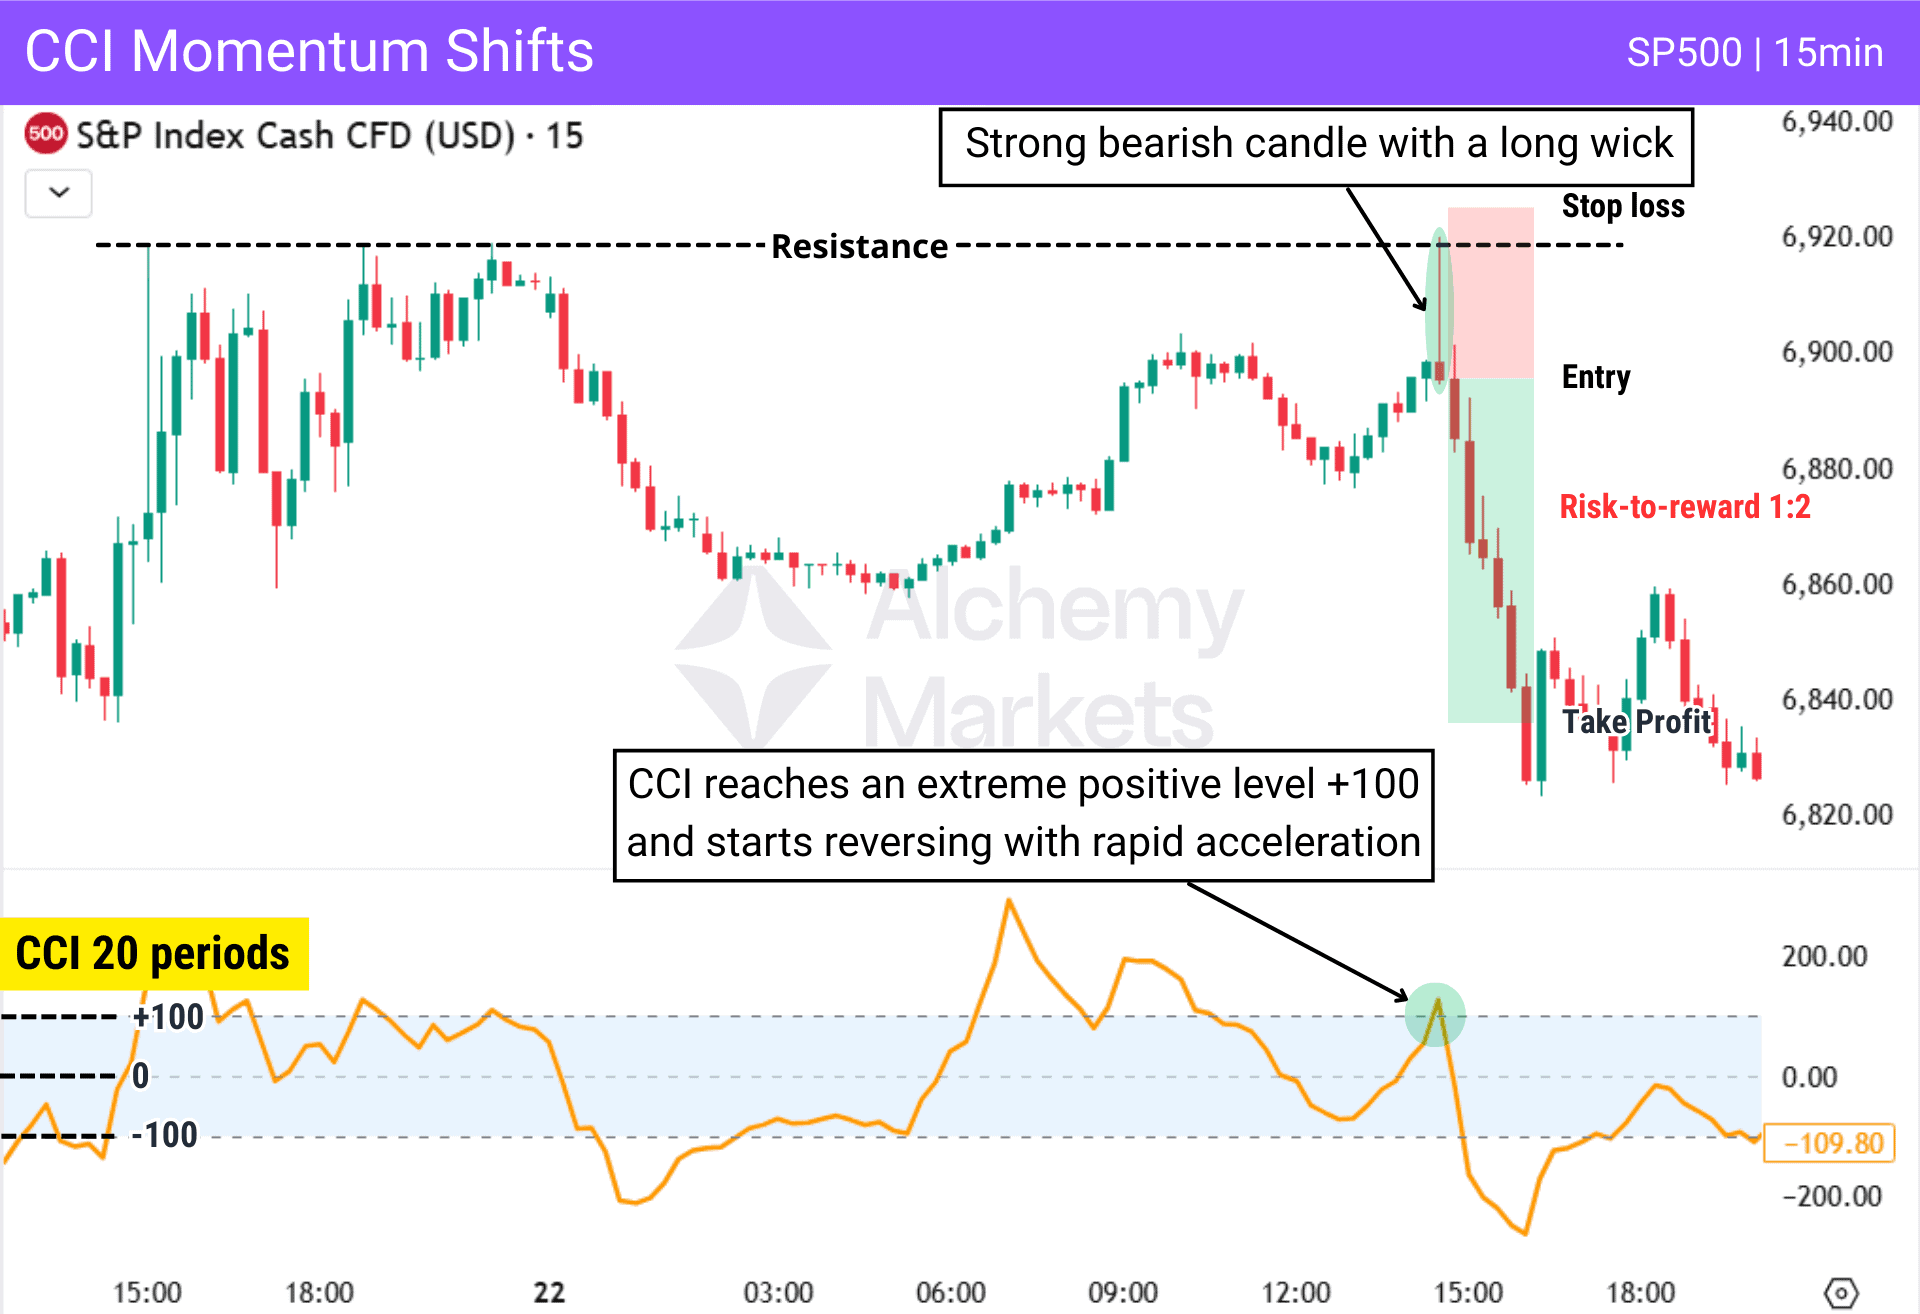
In the example above, price approaches resistance and forms a strong bearish rejection candle (Shooting Star candlestick reversal pattern). At the same time, CCI reaches +100 and quickly reverses from it, signalling compression in bullish pressure.
The alignment between price rejection and CCI acceleration confirms a bearish momentum shift suitable for taking a short trade.
Key Takeaways
The CCI does not operate the same way in all market conditions. Its effectiveness depends on market structure, volatility, and the tools used alongside it. Adapting its application to context improves reliability and helps reduce false signals.
- In strong trends, CCI should be used to time pullback entries, not to call reversals.
- In ranging markets, CCI excels at identifying overbought and oversold levels for counter-trend trades.
- In choppy markets, CCI can provide too many false signals; therefore, it is better to avoid relying on it when price action is unclear.
- Use ±100 levels in normal conditions for more responsive signals, and ±200 levels in strong trending or high-volatility environments to filter noise.
Advantages of the CCI Indicator
The CCI can be a helpful tool for traders when making trading decisions and confirming setups. Below are some of its main advantages:
| Advantage | Explanation |
| Clear overbought and oversold signals | The CCI highlights when price deviates significantly from its average, helping traders identify stretched conditions. |
| Supports divergence and momentum analysis | It helps detect weakening momentum when price and indicator behaviour no longer align. |
| Adaptable across timeframes | The CCI can be applied to intraday, swing, and higher-timeframe analysis. |
| Adjustable sensitivity | Shorter settings increase responsiveness, while longer settings smooth signals for broader trends. |
| Works well with other tools | It integrates effectively with support and resistance, moving averages, and candlestick patterns. |
| Flexible threshold usage | Traders can use ±100 for standard conditions or ±200 to filter stronger trends and volatility. |
Disadvantages of the CCI Indicator
Like every indicator, the CCI has limitations and should not be used in isolation. Understanding these drawbacks helps traders avoid common mistakes and unrealistic expectations.
It is also important to note that extreme CCI readings do not automatically signal reversals; they only indicate that price has moved far from its average.
| Disadvantage | Explanation |
| Derived from historical price data | The CCI is calculated from past price averages, so signals may react after price movement has already started. |
| False signals in choppy markets | In sideways conditions, the indicator can generate frequent and unreliable readings. |
| Overbought and oversold can persist | During strong trends, extreme readings may continue for long periods without leading to reversals. |
| No universal threshold | What qualifies as extreme can vary depending on the asset, volatility, and timeframe. |
| Requires confirmation | Using the CCI alone increases risk; combining it with market structure or other tools improves reliability. |
| Parameter sensitivity | Different settings can produce different signals, which may confuse inexperienced traders. |
Some traders mistakenly treat extreme CCI readings as automatic reversal signals, but in reality the indicator only highlights strong deviations from the average and should be used alongside other forms of analysis.
CCI Indicator vs RSI
The Relative Strength Index (RSI) and the Commodity Channel Index (CCI) are both momentum oscillators, but they measure price behaviour differently.
RSI measures the speed and magnitude of recent gains versus losses within a fixed 0–100 range. CCI measures how far price deviates from its statistical mean and has no defined upper or lower limits.
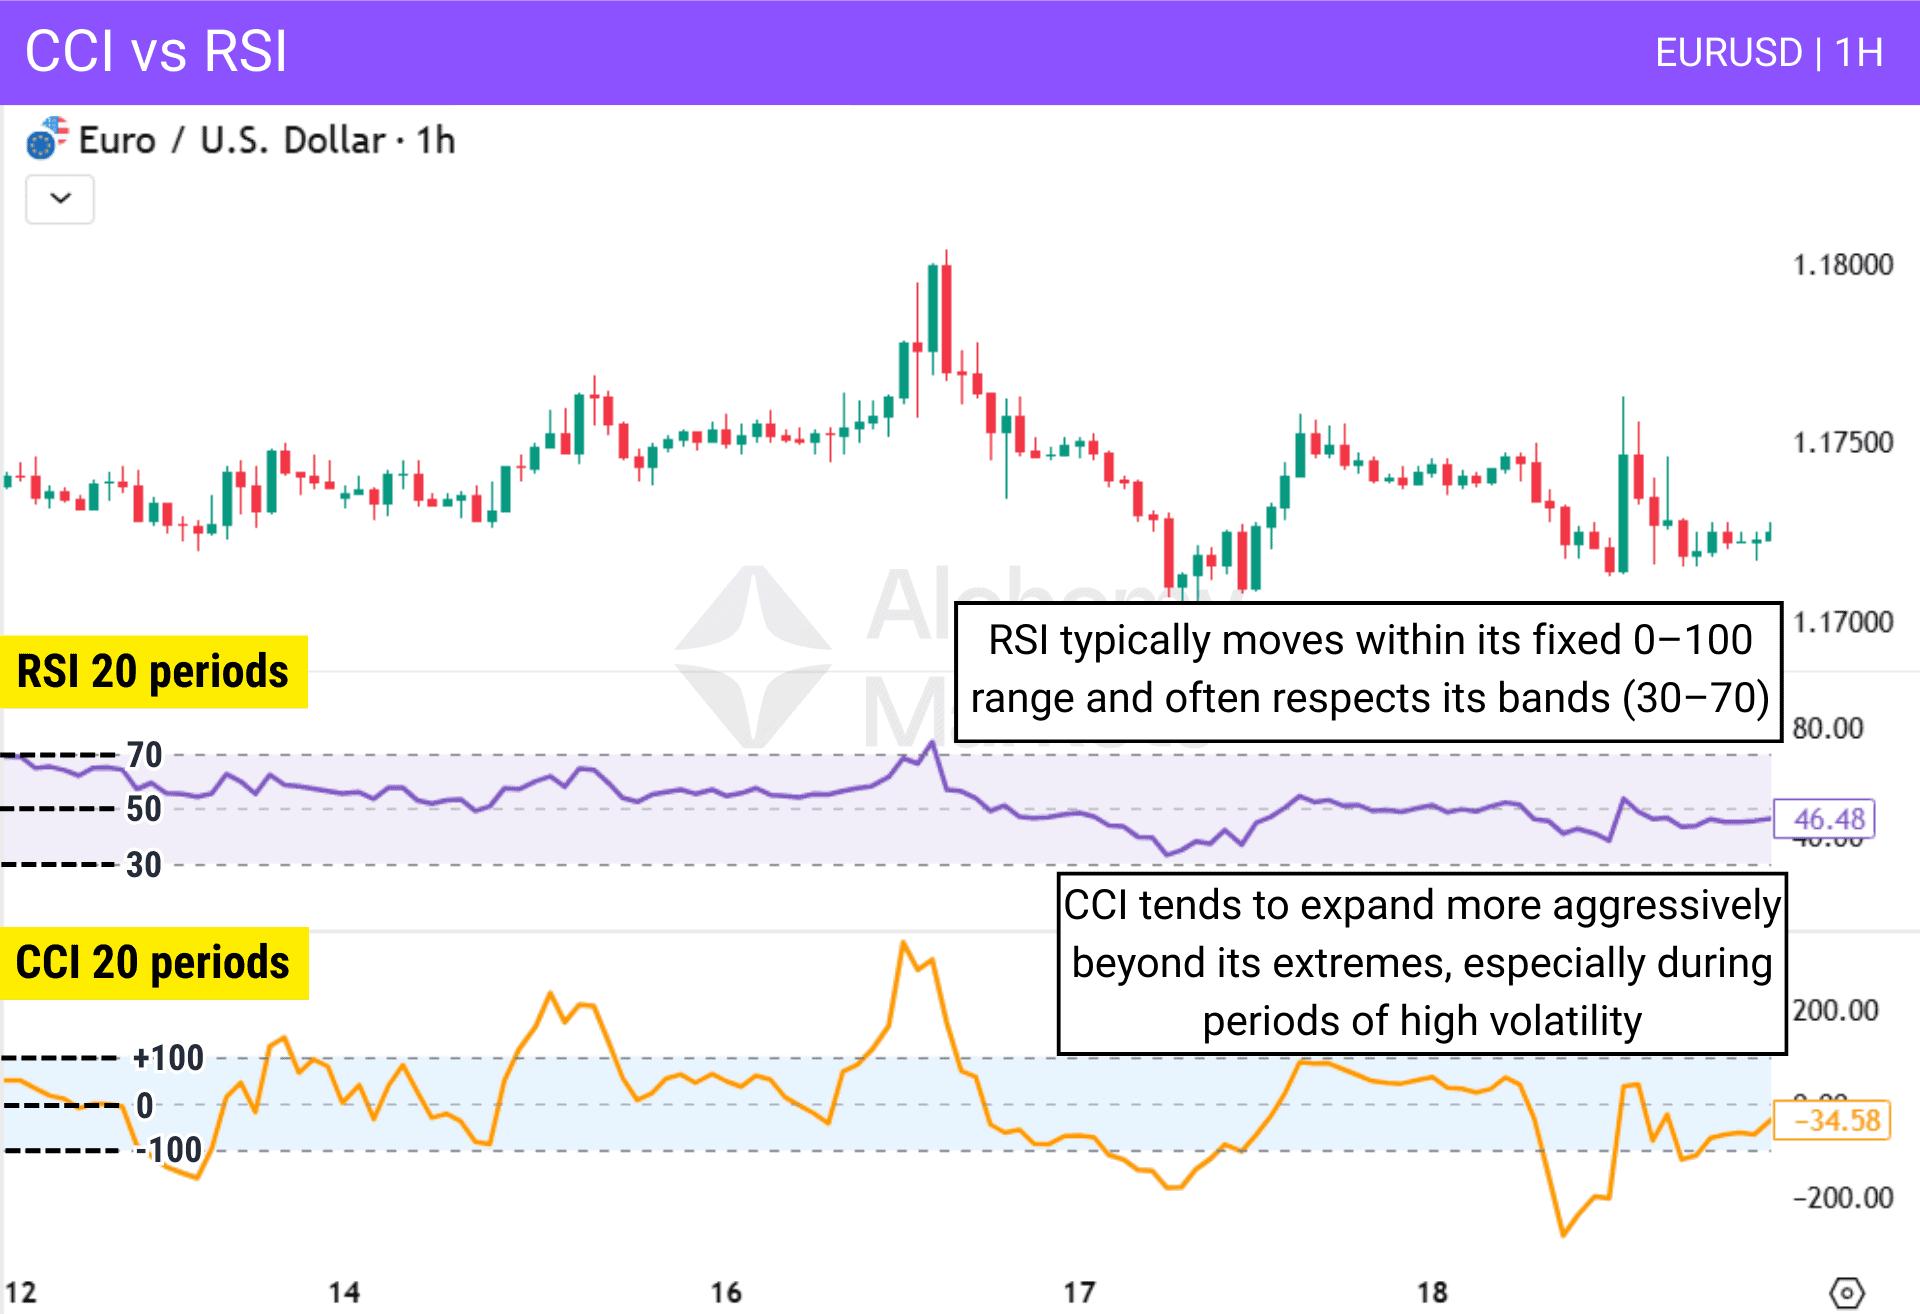
Key differences include:
- RSI uses fixed thresholds (30 and 70 by default), while CCI commonly uses ±100 but can also apply ±200 depending on volatility.
- CCI often expands more during volatility increases because it reflects deviation from the mean.
- RSI typically produces smoother signals due to its bounded structure.
- CCI can reach extreme readings more quickly during strong price expansions.
In strong uptrends, RSI can remain above 70 for extended periods. Similarly, CCI can remain above +100 during sustained trends without signalling immediate reversal. Neither tool is universally superior; they simply measure different aspects of price behaviour.
CCI Indicator vs MACD
MACD is built from exponential moving averages and is primarily used to identify trend direction and momentum shifts over broader swings. CCI, by contrast, focuses on price deviation relative to its average and is generally more responsive to short-term changes.
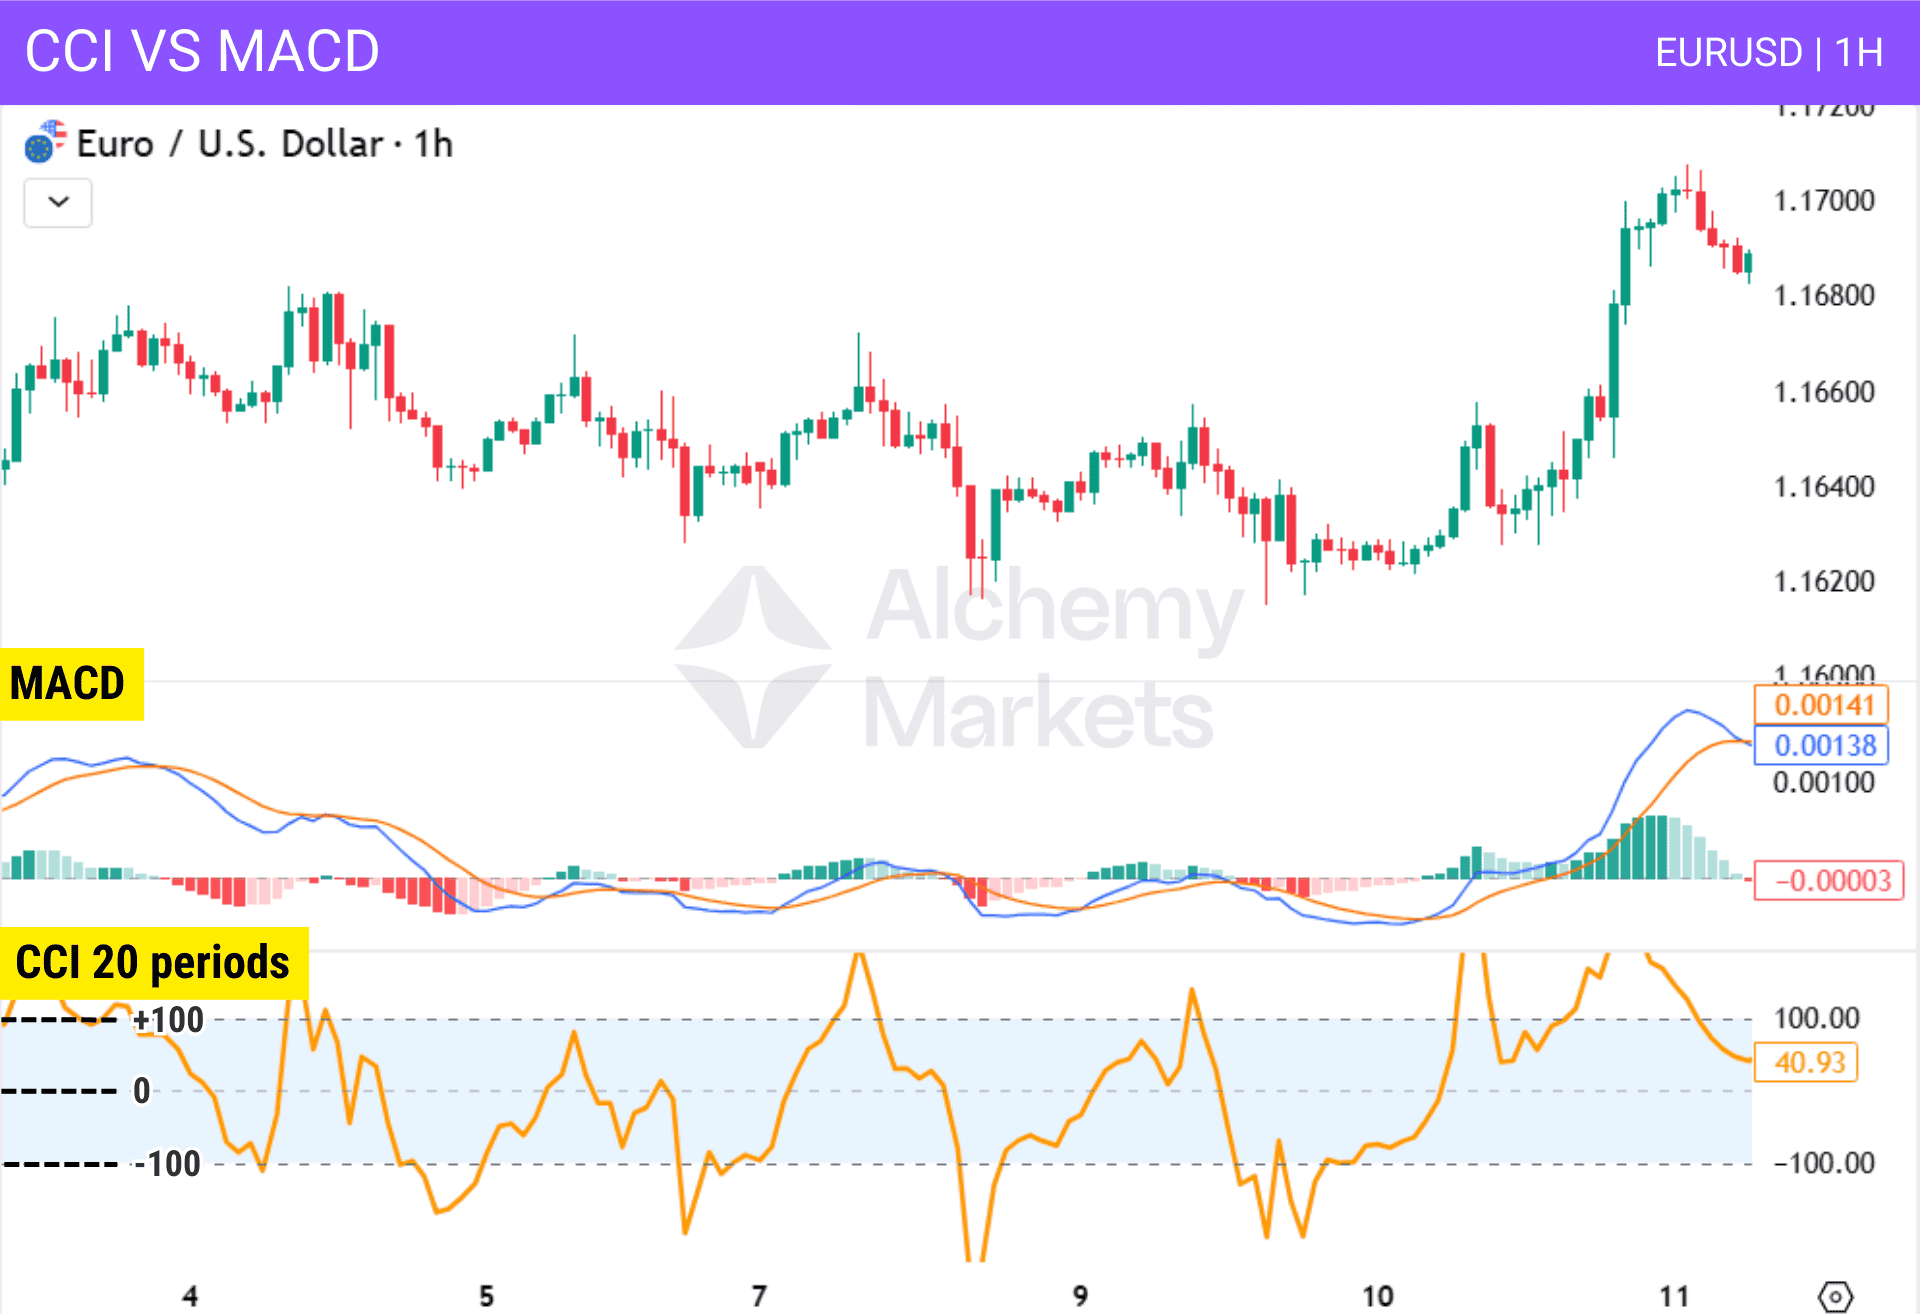
Major differences include:
- MACD is commonly used for trend confirmation.
- CCI reacts more quickly to short-term price acceleration.
- MACD generates crossover signals and histogram divergence.
- CCI highlights deviation extremes rather than moving-average relationships.
In fast-moving markets, CCI may provide earlier signals because it responds directly to deviation. However, MACD often filters short-term noise more effectively due to its smoothing structure.
CCI Indicator vs Stochastic Oscillator
The Stochastic Oscillator compares the closing price to its recent high-low range. The CCI compares price to its statistical average. Both are used to identify overbought and oversold conditions, but their calculations are structurally different.
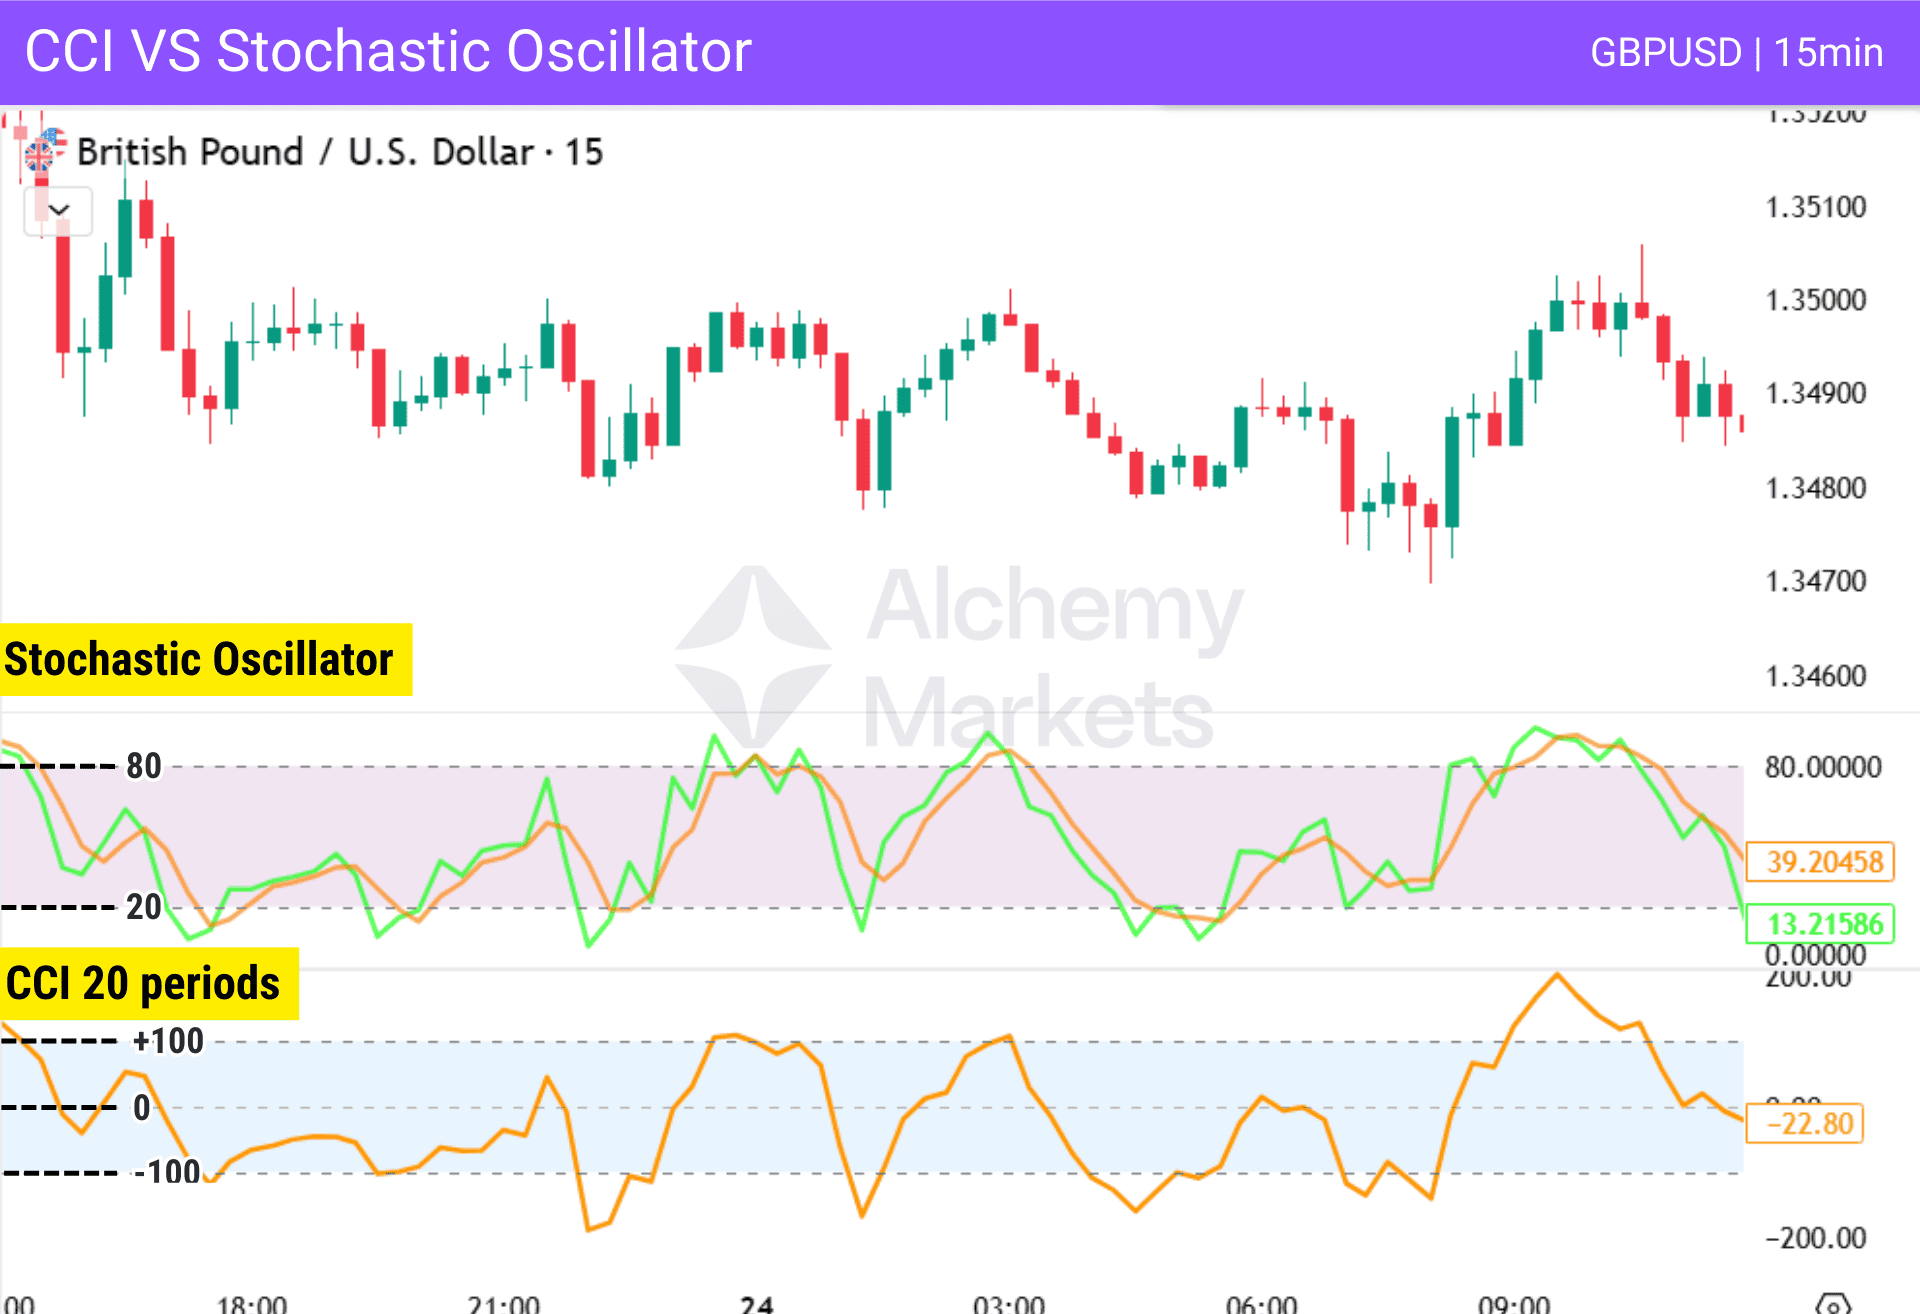
Comparative characteristics:
- Stochastic oscillates within a fixed 0–100 range.
- CCI has no fixed bounds and expands during volatility shifts.
- Stochastic often performs well in clearly defined range-bound markets.
- CCI can be used in both trending and ranging markets.
CCI Indicator vs Williams %R
Williams %R measures where price closes relative to its recent high-low range. It is structurally similar to the Stochastic Oscillator. CCI differs by focusing on deviation from the mean rather than range positioning.
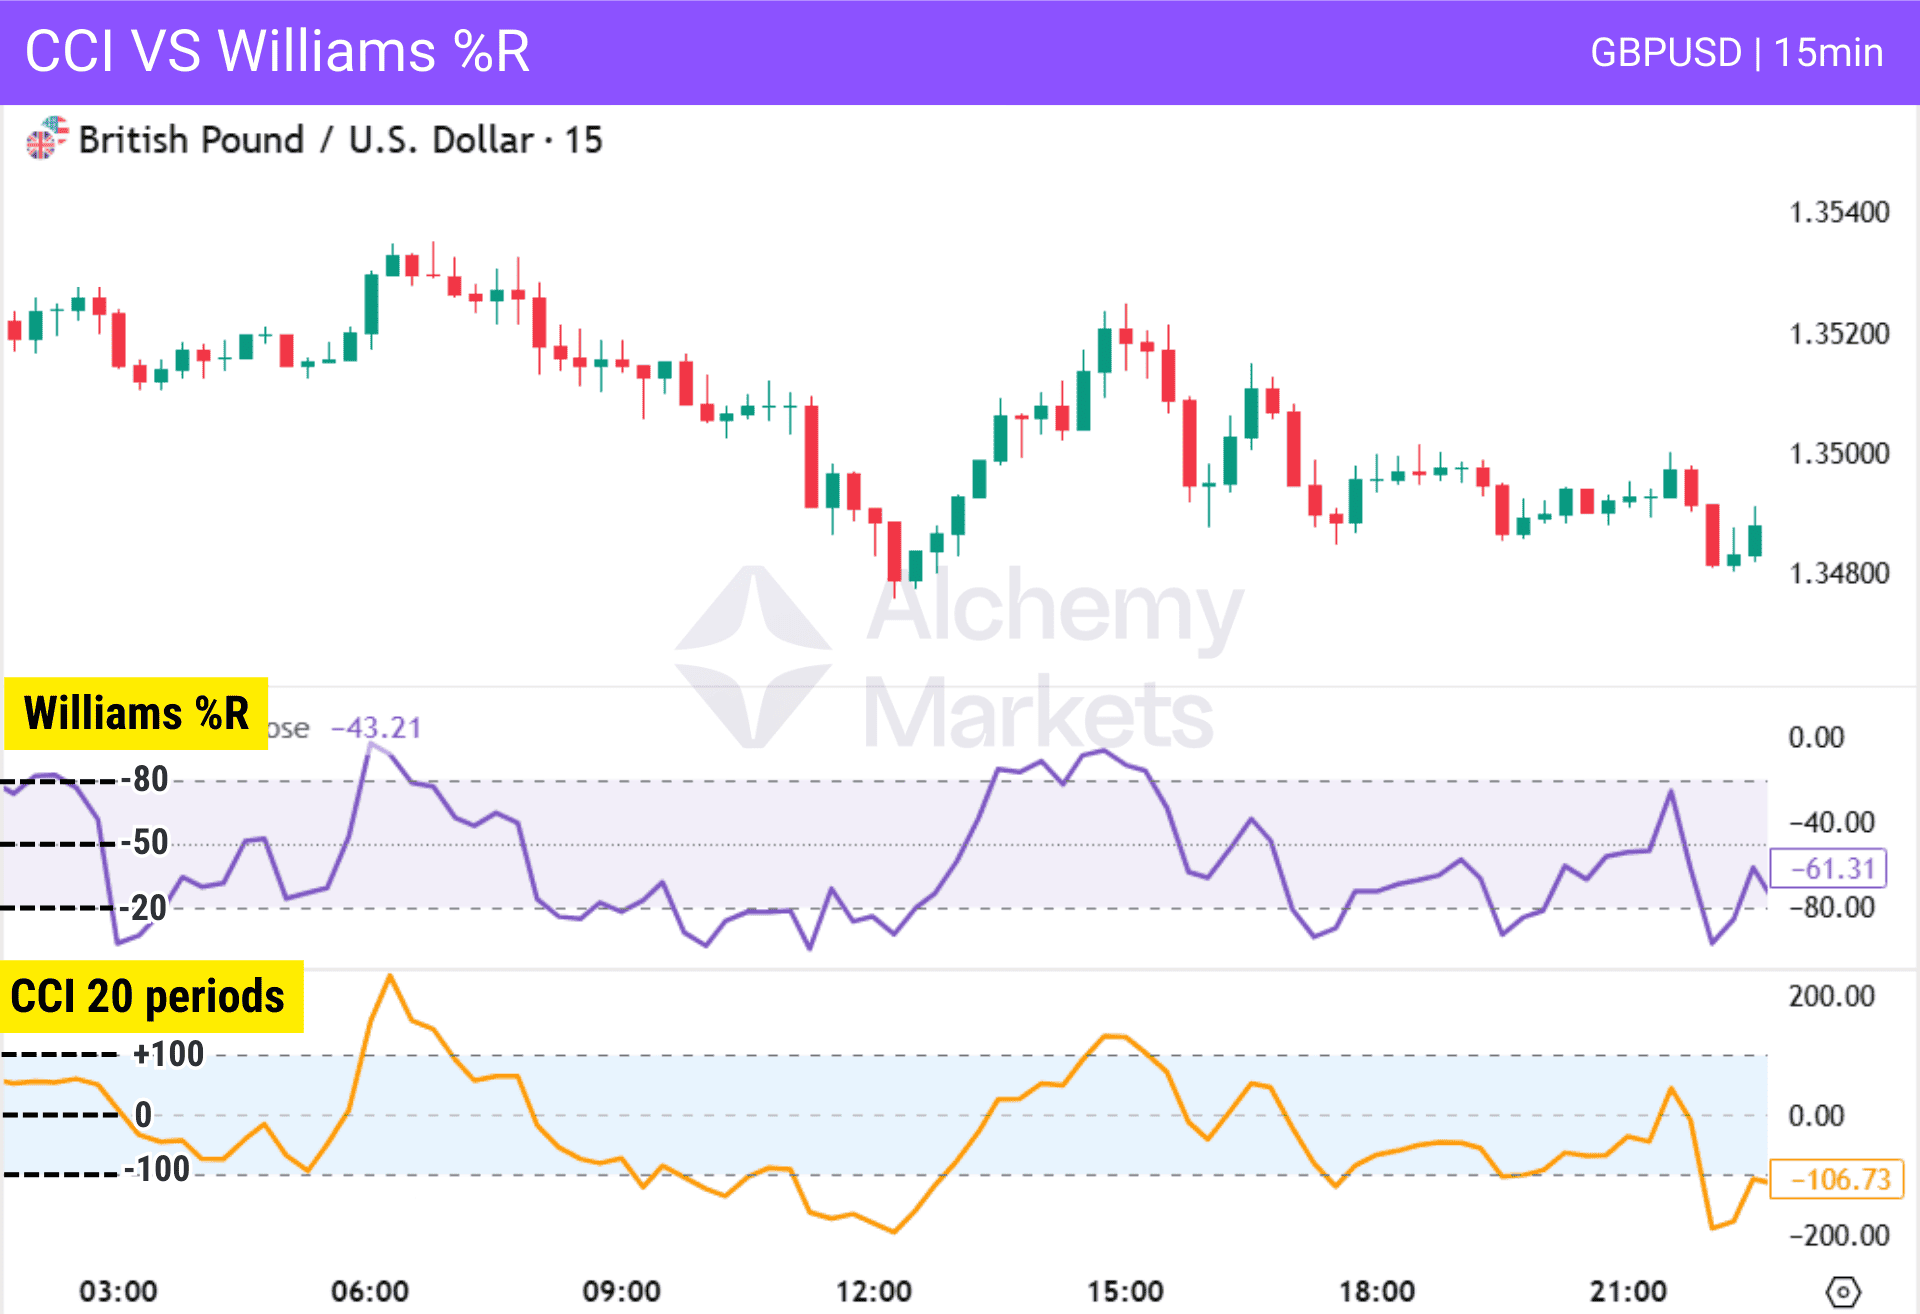
Core distinctions:
- Williams %R operates within a fixed range between 0 and −100, with overbought and oversold levels commonly observed near −20 and −80.
- CCI uses flexible deviation thresholds such as ±100 or ±200 depending on volatility conditions.
- CCI is often used to measure how far price moves away from its average during expansions and pullbacks.
- Williams %R is typically more sensitive and may generate signals more frequently.
Each oscillator provides a different perspective on market behaviour, and their effectiveness depends on context, timeframe, and volatility conditions.
FAQ
What is the best CCI indicator setting?
There is no single best CCI setting, as it depends on trading style and volatility. Short-term traders often use 5–10 periods, swing traders prefer 14–20, and position traders apply 30+ periods for smoother signals.
The default 14 or 20 remains popular because it balances responsiveness and stability.
What are the best timeframes for CCI trading?
CCI can be applied to any timeframe, but effectiveness depends on market structure. Lower timeframes generate more signals but increase noise, while higher timeframes provide cleaner momentum shifts. Many traders align lower entries with higher timeframe direction.
What are the common CCI trading mistakes to watch out for?
Common mistakes include trading extreme levels without context and ignoring overall trend direction. Overbought or oversold readings do not guarantee reversals, especially in strong trends. Using CCI without confirmation often leads to false signals.
How reliable is the CCI indicator?
The CCI is reliable when used with structure, trend context, and risk management. It measures price deviation effectively but does not predict direction on its own. Its reliability increases when combined with confirmation tools.
What is the range of the CCI indicator?
CCI does not operate within fixed upper or lower boundaries. While ±100 are commonly referenced levels, readings can extend significantly beyond them depending on volatility, such as ±200 or beyond.
What does a CCI above 100 mean?
CCI measures how far price is from its average (SMA), adjusted by the market’s typical deviation. A value of +100 means price is about 1.5× its normal distance above the average, signalling unusually strong upside movement.
What are CCI indicator best settings?
The most common CCI setting is a 14-period with ±100 levels, but many traders prefer widening the thresholds to ±200 to focus only on truly extreme moves.
Mechanically, the period controls sensitivity while the levels define how far price must deviate from its average, so using ±200 simply raises the bar and filters out weaker, noisier signals.
Is CCI a leading or lagging indicator?
CCI is structurally reactive because it is calculated from historical price data. However, divergence setups can sometimes provide early warning signs of weakening momentum. It is best treated as a confirmation tool rather than a forecasting instrument.
Which markets does the CCI work best on?
CCI works well in markets that display cyclical behaviour or clear momentum phases. It is widely used in forex, commodities, indices, stocks, and cryptocurrencies. Performance depends more on volatility and structure than the asset class itself.
How do you use the Commodity Channel Index when trading forex?
In forex trading, price is largely driven by interest rate expectations, central bank policy, and macroeconomic data. Traders often combine CCI with technical analysis tools such as support and resistance, trendlines, or moving averages to confirm trading decisions.
The indicator is commonly used to time pullbacks within trends or identify overbought and oversold conditions during ranging periods.
How do you use the Commodity Channel Index when trading commodities?
Commodity markets are often influenced by supply and demand cycles, and geopolitical events. These forces can push prices far from their average levels, which the CCI helps visualise.
How do you use the Commodity Channel Index when trading cryptocurrencies?
Cryptocurrency markets often experience higher volatility and rapid sentiment shifts compared to traditional assets. These conditions frequently push CCI beyond ±100 or even ±200 levels, reflecting strong momentum expansions. Traders often use higher timeframes and combine CCI with other tools to analyse market trends and confirm entries.
How to filter out false CCI signals?
False signals often occur in choppy markets or during low-momentum conditions. Aligning CCI readings with the trend direction and structural confirmation improves consistency. Combine CCI with additional confirmations and avoid trading when price lacks clarity.


